. 2017 Mar 23;543(7646):519-524.
doi: 10.1038/nature21411. Epub 2017 Mar 8.

Complex multi-enhancer contacts captured by genome architecture mapping

Affiliations

Complex multi-enhancer contacts captured by genome architecture mapping

Robert A Beagrie et al. Nature. .

Abstract

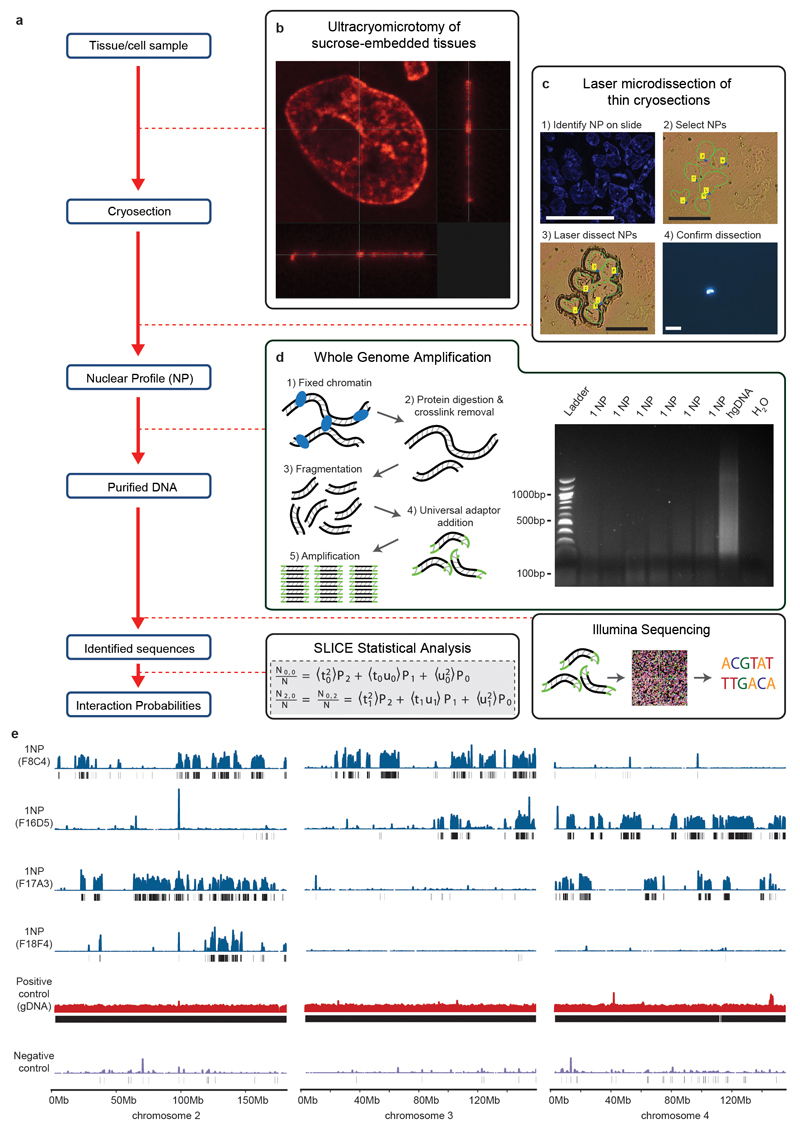
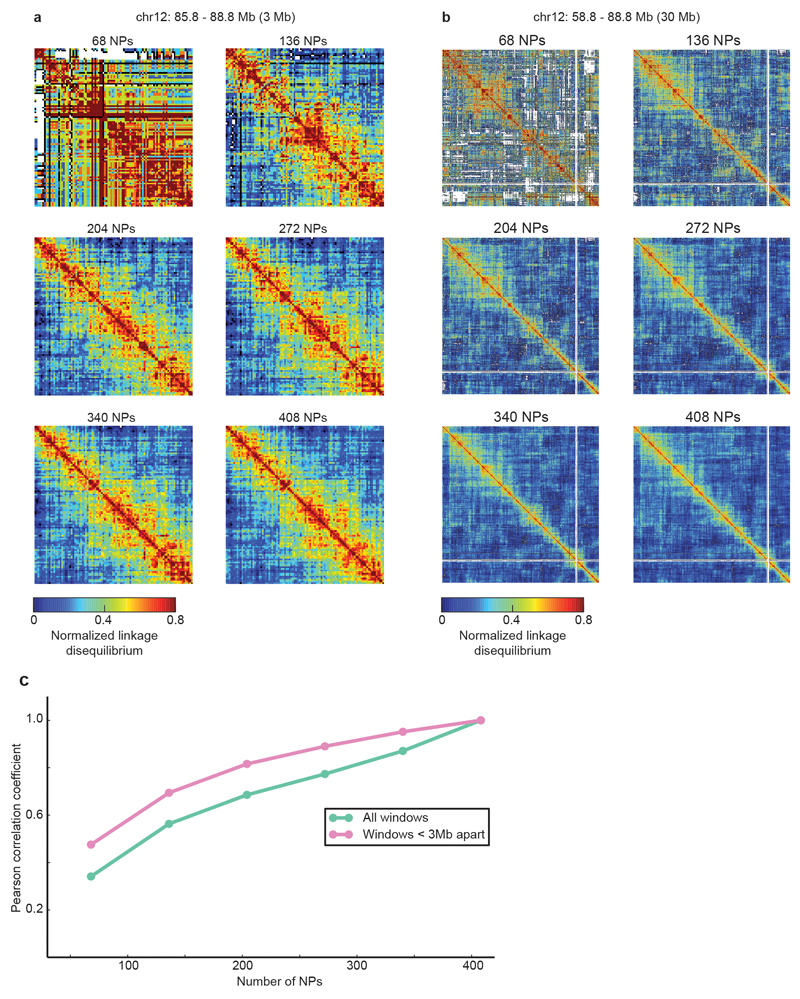
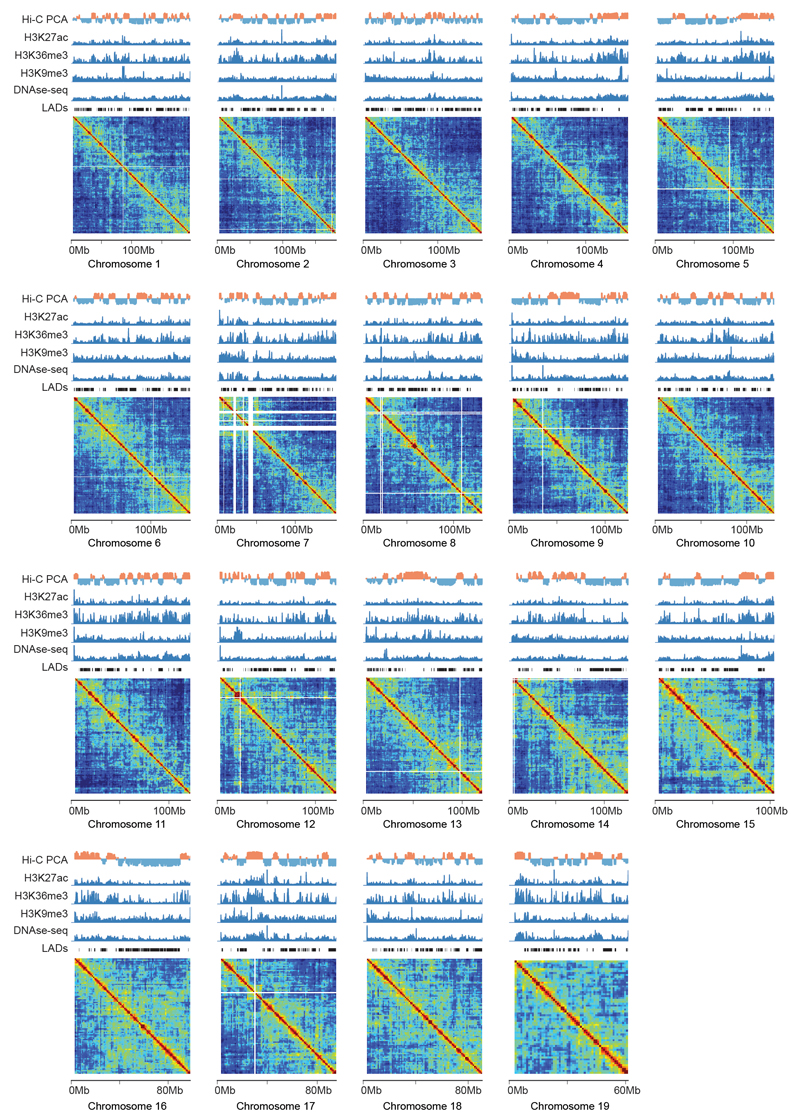
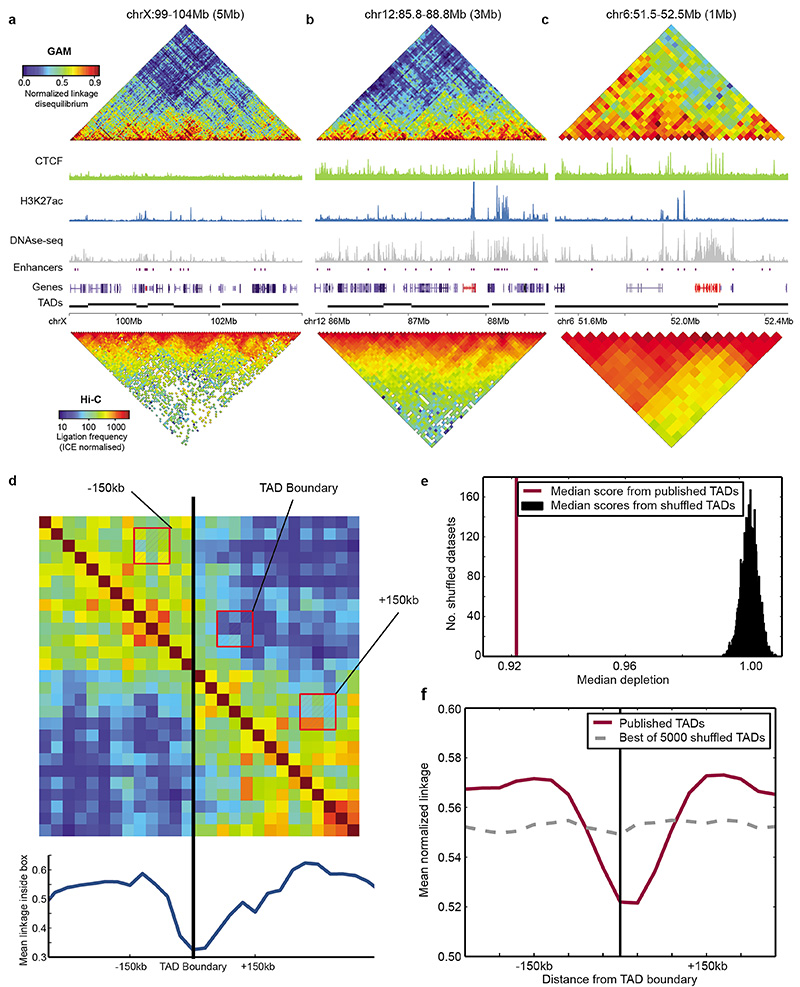
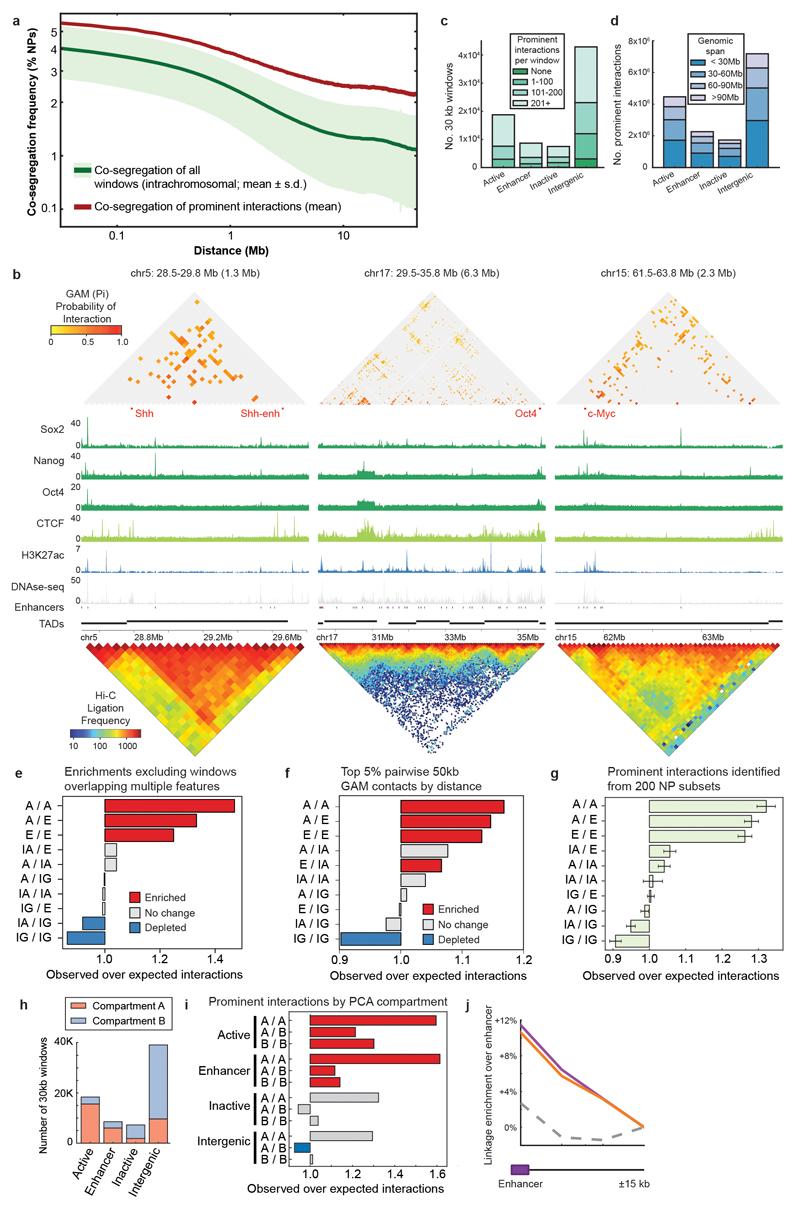
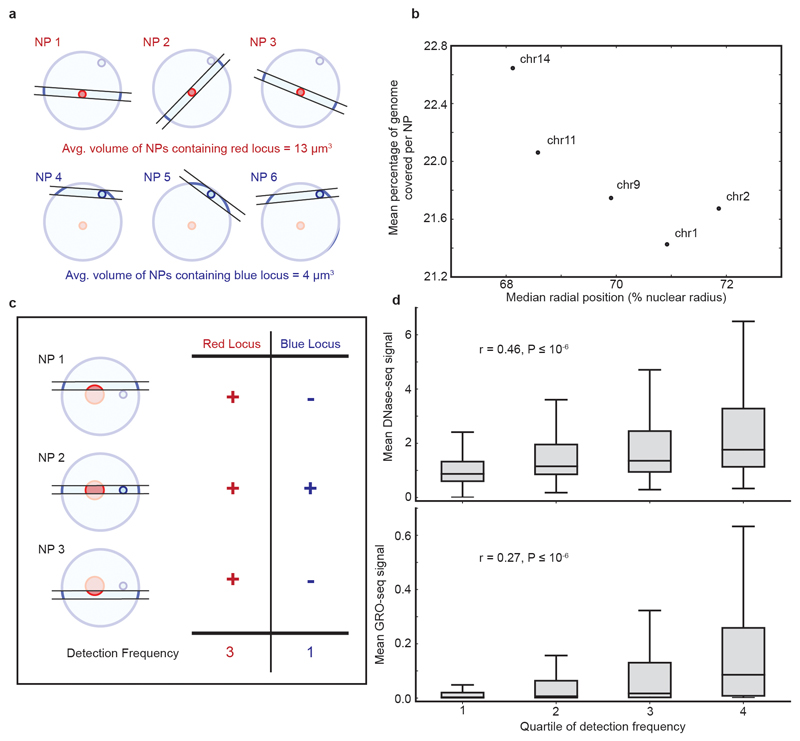
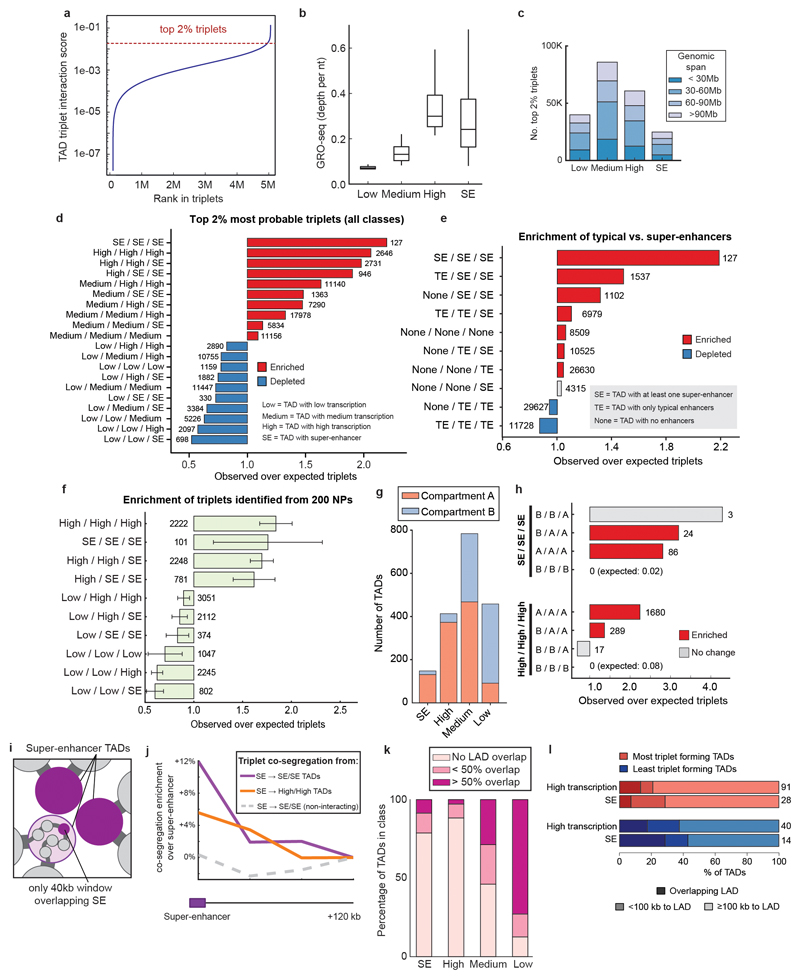
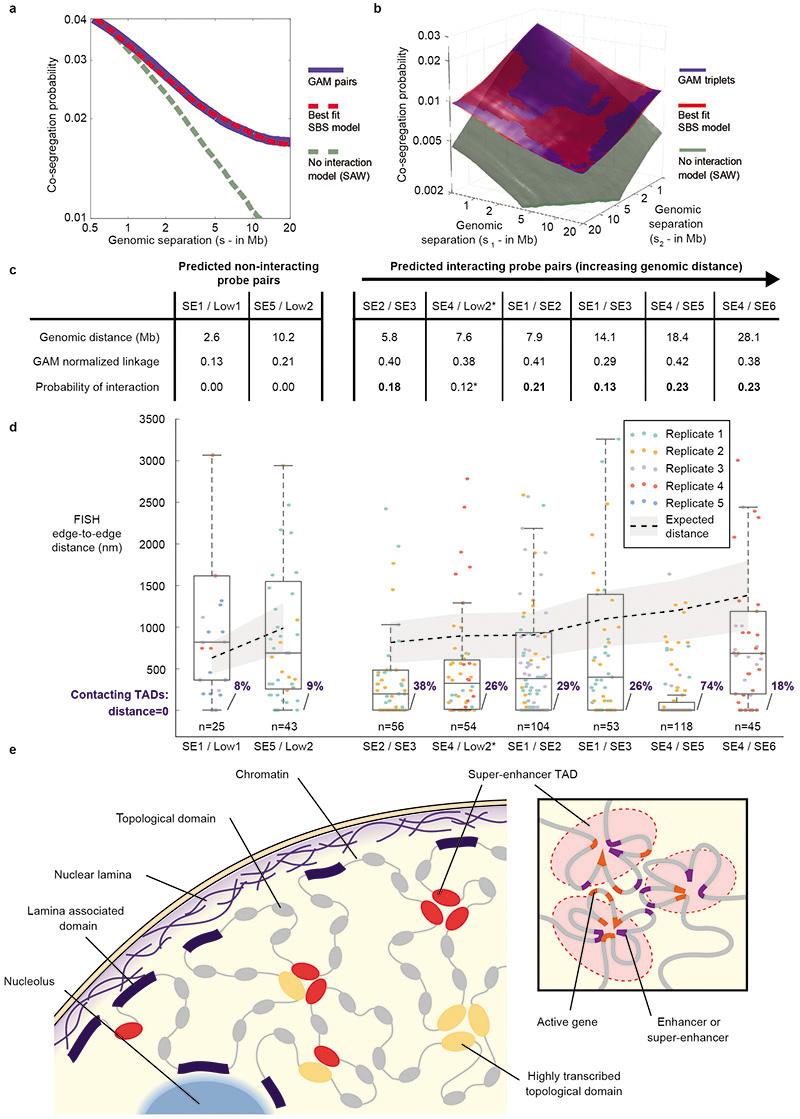
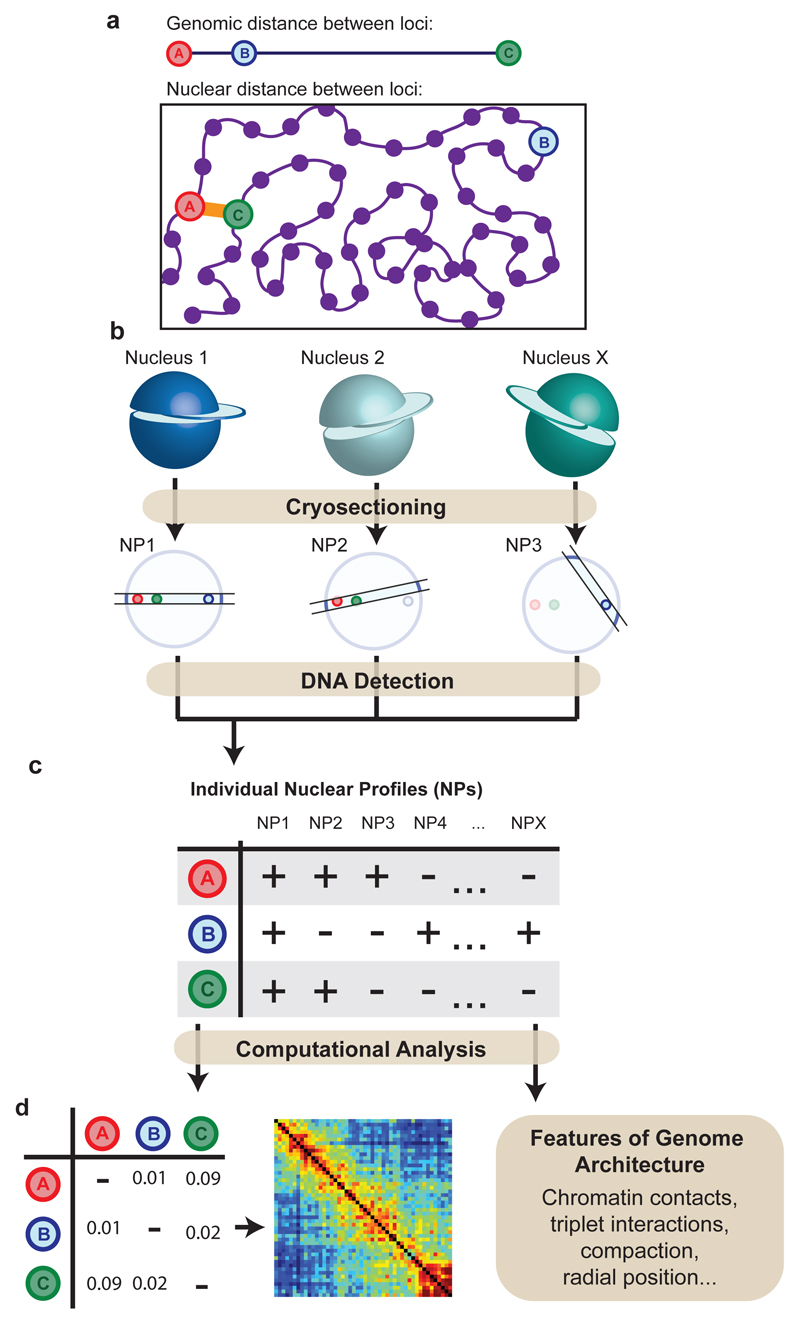
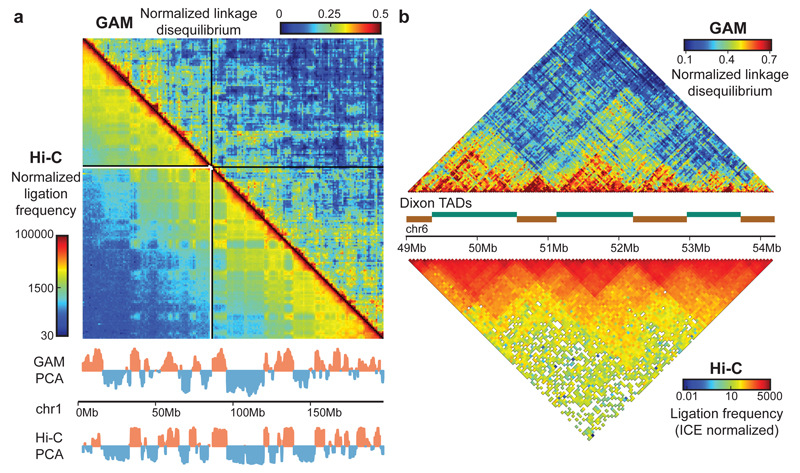
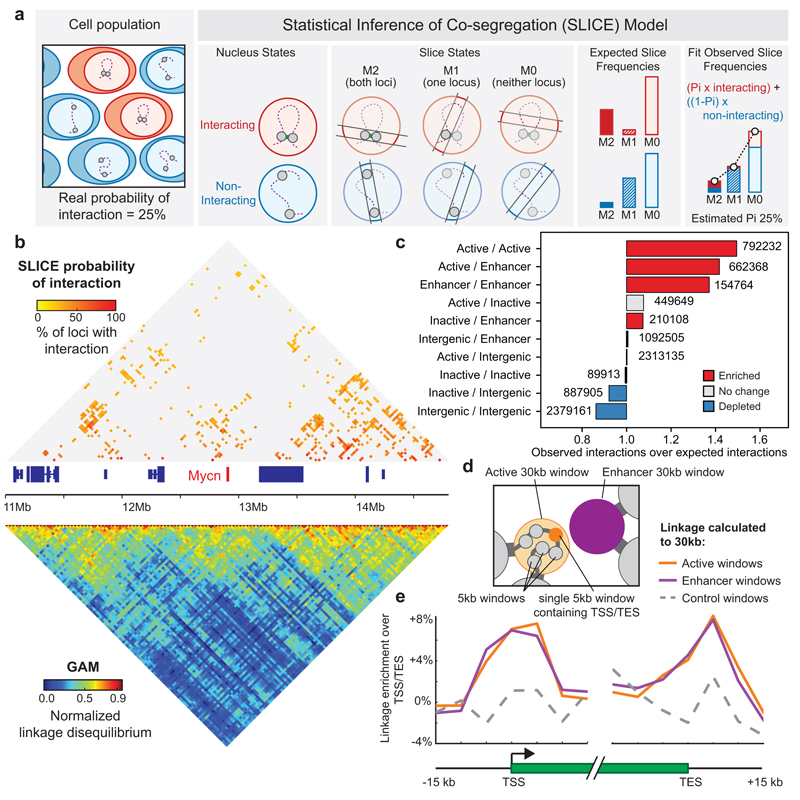
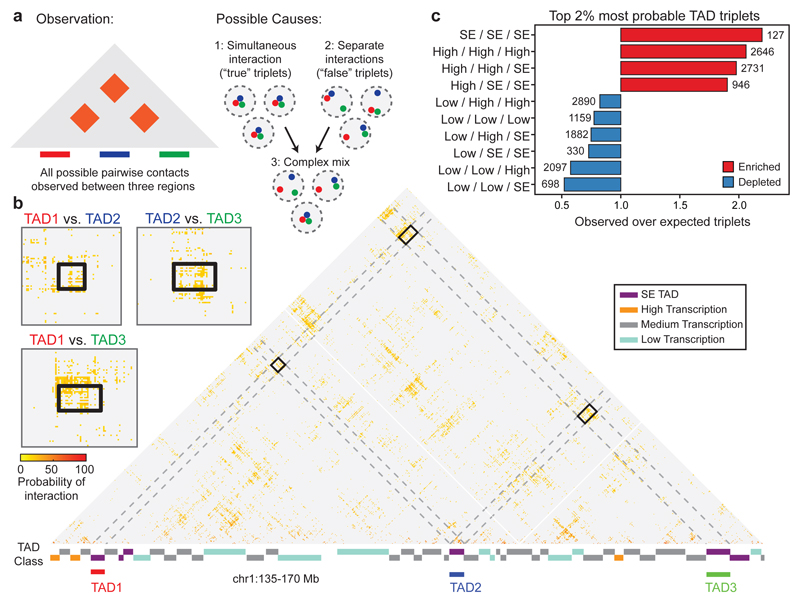
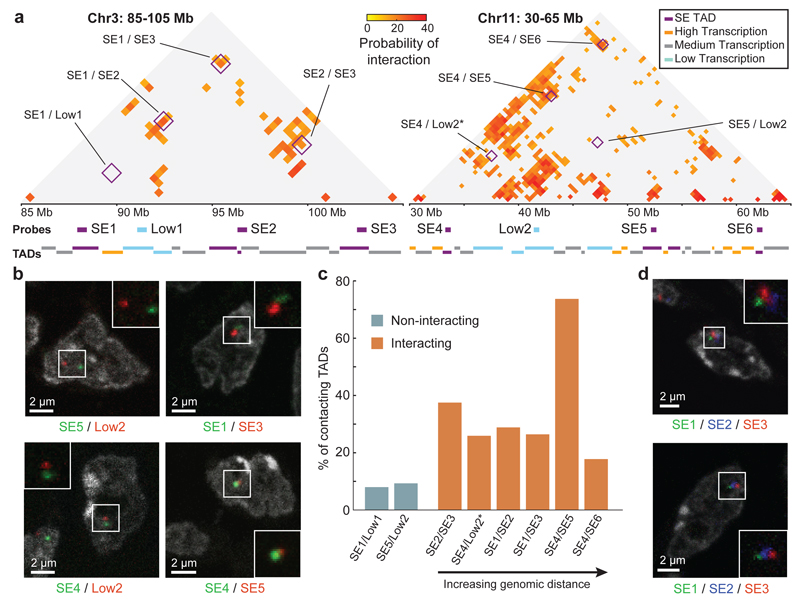
The organization of the genome in the nucleus and the interactions of genes with their regulatory elements are key features of transcriptional control and their disruption can cause disease. Here we report a genome-wide method, genome architecture mapping (GAM), for measuring chromatin contacts and other features of three-dimensional chromatin topology on the basis of sequencing DNA from a large collection of thin nuclear sections. We apply GAM to mouse embryonic stem cells and identify enrichment for specific interactions between active genes and enhancers across very large genomic distances using a mathematical model termed SLICE (statistical inference of co-segregation). GAM also reveals an abundance of three-way contacts across the genome, especially between regions that are highly transcribed or contain super-enhancers, providing a level of insight into genome architecture that, owing to the technical limitations of current technologies, has previously remained unattainable. Furthermore, GAM highlights a role for gene-expression-specific contacts in organizing the genome in mammalian nuclei.


Conflict of interest statement

Competing Interests

The authors declare competing financial interests: a patent was filed on behalf of A.P., P.A.W.E., M.N., A.S. and R.A.B. by the Max-Delbrück Centre for Molecular Medicine, Berlin. The other authors declare no competing financial interests.

Figures

Extended Data Figure 1
Extended Data Figure 1. Limitations of current genome-wide methods for measuring chromatin interactions.
a, The table lists the current genome-wide methods for measuring chromatin interactions and compares their various limitations. CNVs = copy number variants. b, GAM has few of the limitations that affect current genome-wide methods for mapping genome architecture. c, In 3C-based methods, the presence of multiple loci in a single interaction may dilute the measured ligation frequency between any two member loci. In GAM, the measured interaction is not affected by multiplicity. d, Two interactions on different chromosomes (or distant on the same chromosome) can be correlated (occur together in the same cells), anti-correlated (one interaction occurs whilst the other does not) or independent (they occur either together or in different single cells randomly).
Extended Data Figure 2
Extended Data Figure 2. Outline of the GAM method.
a, Overview of the GAM methodology. b, Ultra-thin slice through a single nucleus produced by cryosectioning (reproduced from Histochemistry and Cell Biology, Advances in imaging the interphase nucleus using thin cryosections, 128, 2007, 97, A. P. (© Springer-Verlag 2007) with permission of Springer). c, Isolation of individual NPs from cryosections using laser capture microdissection. Scale bars are 30 µm. d, Whole genome amplified DNA extracted from microdissected NPs. e, Identification of regions in mouse chromosomes 2, 3 and 4, present in the four NPs, by next-generation sequencing. Coverage of mouse genomic DNA (gDNA) amplified by WGA is mostly even, with a few spikes possibly due to amplification biases. Black bars under each track indicate windows called as positive by a negative binomial approach.
Extended Data Figure 3
Extended Data Figure 3. Quality control of the GAM dataset.
a, Percentage of reads mapped to the mouse genome was reproducible between 13 independently collected batches of NPs, and a minimal threshold of 15% mapped reads was used to identify highest quality NPs. Dashed line shows position of cut-off for low-quality samples. Histogram below shows overall distribution. b, Sequencing depth versus number of 30 kb windows identified by a negative binomial fitting approach for four individual NPs. c, Percentage of 30 kb genomic windows identified in each NP, was reproducible between collection batches. Black diamonds indicate NP samples that did not pass quality control. Histogram below shows overall distribution. d, Histogram showing the percentage of the diploid mouse genome identified in each NP. Dashed line shows maximum genomic coverage obtainable from 0.22 μm slices of a 9 μm diameter spherical nucleus. e, Boxplots showing the percentage of 30 kb windows from each chromosome identified in each NP. mESC-46C cells are male and therefore haploid for the X chromosome. f, Positions of three ~40 kb fosmid probes within the HoxB locus. g, cryoFISH experiments were carried out by hybridizing each fosmid probe to cryosections. Probes were detected using specific, fluorophore-conjugated antibodies. Arrows indicate the localization of 40 kb genomic windows only within a small proportion of NPs, as expected from their small thickness. h, Comparison of probe detection in single NPs by cryoFISH and GAM. Top row: percentage of NPs that were labelled by each probe (median of four replicate experiments in mESC-OS25 cells, each replicate containing 1500-2600 NPs). Bottom row: percentage of NPs from the mESC-400 dataset in which the region encompassing each probe was positively detected (in mESC-46C cells).
Extended Data Figure 4
Extended Data Figure 4. Exploration and normalization of biases in the mESC-400 dataset.
a, Normalized linkage disequilibrium effectively reduces bias in GAM datasets. 30 kb windows were divided into equal groups according to their detection frequency, GC content or mappability (grey bar plots give mean ± interquartile range, left). Mean observed over expected values (% bias) between windows in each group are shown for three different normalization schemes (heat maps, middle). Calculating the normalized linkage disequilibrium results in the lowest absolute % bias in all three cases (box plots, right). b, The normalized linkage disequilibrium corrects for confounding effects on co-segregation matrices caused by small differences in the detection frequency of locus pairs. c, GAM matrices are less biased than Hi-C matrices both before and after ICE-normalization. Observed over expected values are given for 50 kb windows stratified by restriction site density, GC content and mappability.
Extended Data Figure 5
Extended Data Figure 5. Four hundred NPs are sufficient to extract most of the information about co-segregation of loci at 30 kb resolution.
a and b, Normalized linkage disequilibrium matrix for a 3 Mb (a) and a 30 Mb (b) genomic region around the Esrrb locus plotted with increasing numbers of NPs included. c, Pearson Correlation Coefficient between eroded datasets including only the indicated number of NPs and the full mESC-400 dataset. Green line indicates correlation over all pairs of loci, and pink for only those loci within 3Mb of each other.
Extended Data Figure 6
Extended Data Figure 6. GAM contact matrices for all chromosomes at 1 Mb resolution.
GAM matrices of normalized linkage disequilibrium are shown for all chromosomes at 1Mb resolution, alongside published ChIP-seq tracks for H3K27ac, H3K36me3 and H3K9me3, DNAse-seq, Hi-C PCA compartments and lamin associated domains (LADs) from mESCs (Supplementary Table 3). White lines within matrices represent genomic regions with poor mappability.
Extended Data Figure 7
Extended Data Figure 7. GAM reproduces a significant depletion of long-range contacts around previously identified TAD boundaries.
a, TAD organization of the Xist locus (Xist highlighted in red). b, TAD organization of the Esrrb locus (Esrrb highlighted in red). c, TAD organization of the HoxA locus (HoxA gene cluster highlighted in red). d, Depletion of long-range contacts observed when a 3x3 window box is moved across an example TAD boundary, at an offset of 2 windows from the matrix diagonal (i.e. insulation score). e, Median ratio between linkage observed at a boundary vs. 150 kb upstream and downstream of the boundary was significantly lower for a previously published list of TAD boundaries in mESC (purple line) than for 5000 randomly shuffled versions of the list (permutation test, P < 2x10⁻⁴; black histogram). f, Average profile of long-range contacts calculated over all TAD boundaries (purple line). The average profile with the largest depletion observed after 5000 random permutations of TAD boundaries is shown for comparison (dashed grey line).
Extended Data Figure 8
Extended Data Figure 8. Prominent interactions identified by SLICE co-segregate frequently in raw GAM data.
a, Mean co-segregation frequency of pairs of prominently interacting windows (red line) is consistently higher than the mean co-segregation frequency of all intrachromosomal window pairs (green line ± s.d.; green area) across a wide range of genomic distances. For example, when we consider all genomic loci separated by 10 Mb, we find that they co-segregate on average much less frequently (in 5.3 out of 408 NPs; ± 2.6 s.d.) than locus pairs classified as interacting (in 10.1 out of 408 NPs; ± 2.2 s.d.). b, Prominent interactions identified by SLICE over the Shh, Oct4 and c-Myc loci. Also shown are ChIP-seq tracks for pluripotency transcription factors Sox2, Nanog and Oct4, and for CTCF and H3K27ac, as well as DNAse-seq, positions of predicted enhancers and topological domains and published Hi-C data at 50 kb resolution. c, Number of prominent interactions by overlapping feature present in each window. d, Genomic distances between pairs of prominently interacting windows by overlapping feature. e, Enrichment of genomic features overlapped by prominently interacting 30 kb windows. As for Fig. 3c, but excluding windows overlapping more than one feature (e.g. both an inactive gene and an active gene). f, As for Fig. 3c except enrichments are calculated for the top 5% most interacting pairs of 50 kb windows at each genomic distance ranked by GAM normalized linkage. g, Enrichments calculated from independent 200 NP subsamples of the mESC-400 dataset (n=10, mean ± s.d.). h, A small proportion of 30 kb windows within the broadly inactive compartment B (calculated from Hi-C at 100 kb resolution) overlap active genes or enhancers. i, Prominent interactions involving Active and Enhancer windows are enriched irrespective of A or B compartmentalization, demonstrating that observed enrichments between Active regions and Enhancers are not a trivial consequence of nuclear compartmentalization j, Average linkage from 5 kb windows overlapping an enhancer to prominently interacting 30 kb Active windows (orange), Enhancer windows (purple) or non-interacting Active windows (control windows; grey).
Extended Data Figure 9
Extended Data Figure 9. GAM also provides information about locus radial positioning and compaction.
a, A locus positioned centrally within the nucleus is more frequently found in equatorial NPs, which have a larger volume. In contrast, a locus positioned close to the nuclear periphery is more frequently found in apical sections, which have a smaller volume. b, The mean percentage of the genome covered per NP (as a proxy for NP volume) is negatively correlated with radial positioning in the five mouse autosomes for which radial position data is available. c, A more de-compacted locus with a smaller volume is intersected more frequently (i.e. is detected in more NPs) than a corresponding compacted locus with a larger volume. d, 30 kb windows in the highest quartiles of detection frequency also show a higher coverage by DNase-seq (upper panel) and GRO-seq (lower panel), indicating a greater level of active transcription. This is consistent with a general de-compaction of actively transcribed chromatin regions, leading to a volume-induced increase in detection frequency.
Extended Data Figure 10
Extended Data Figure 10. TAD triplet enrichment analysis.
a, Ranking of candidate triplet TADs on the same autosomal chromosome by their mean Pi3 at a spatial distance of <100nm and position of the cut-off for the top 2% selected for further analysis. b, Classification of TADs. TADs overlapping Super Enhancers are designated SE. Non-SE TADs are designated low transcription when their GRO-seq coverage is in the bottom 25% quartile, or high transcription when it is in the top 25%. Remaining TADs are classified as medium transcription TADs. c, Genomic span of top 2% triplet interactions by TAD class. d, Enrichment analysis as in Fig. 4c additionally showing triplets containing medium transcription TADs. e, Enrichment analysis as in Fig. 4c, except TADs are classified according to whether they overlap super-enhancers (SE), typical enhancers (TE) or no enhancers (None). f, Enrichment of TAD triplet classes calculated from independent 200 NP subsamples of the mESC-400 dataset (n=10, mean ± s.d.). g, TAD classification stratified by overlap with A and B compartments calculated from Hi-C at 1 Mb resolution. h, Enrichments calculated between sets of three SE TADs or three highly transcribed TADs, stratified by their overlap with PCA compartments. i, Scheme for testing whether within an interacting triplet, two SE-TADs preferentially contact the 40 kb window overlapping the SE of the third SE-TAD. j, Average co-segregation between a 40 kb window directly overlapping an SE and two other SE-TADs in a triplet (purple line), two highly expressed TADs in a triplet (orange line), or two SE-TADs not in a triplet (dashed line). The SE-containing 40 kb windows co-segregate more frequently with the two other SE-TADs in their triplet than 40 kb windows located 120 kb upstream or downstream (paired t-test, P < 10). A lower, yet significant enrichment was also found for one SE-TAD interacting with two highly -transcribed TADs (P < 10), whilst no significant enrichment was detected between SE-TADs that did not form top triplets (P = 0.68). k, Percentage of TADs in each class that overlap Lamina Associated Domains (LADs). l, Highly transcribed and SE-TADs that form the least triplet contacts more frequently overlap or are closer to LADs compared with TADs that form the most triplet contacts. Therefore, proximity to the nuclear lamina appears to curb the formation of higher complexity contacts involving highly-transcribed TADs, either by restricting access to more central enhancer clusters or by limiting the surface available for the formation of multiple contacts.
Extended Data Figure 11
Extended Data Figure 11. Model for chromatin organization in mESC nuclei.
a and b, Polymer modelling performed using the Strings & Binders Switch (SBS) model under different conditions. We sampled the ensemble of (1) polymers in the coil thermodynamics state, equivalent to the random-open conformation of a Self-Avoiding Walk (SAW) model; (2) polymers in the compact state, where binder-specific interactions prevail and fold the polymer in closed conformations; and (3) mixtures of the SBS polymers in coil and compact states. From these in silico models, we calculated the co-segregation frequency of polymer bead pairs (a) or triplets (b) for a wide range of genomic lengths (from 0.5 up to 20 Mb). The long-range decay of co-segregation probability observed in the mESC-400 dataset (blue line and surface) is not consistent with the SAW model that lacks specific interactions (grey line and surface). Instead, the observed decay of pairs or triplets are closely matched by a 40:60 mixture of coil/compact SBS polymers (best-fit SBS model: red line, RSS =1%; red surface RSS =2%), consistent with pair and triplet contacts being abundant features of chromatin folding across large genomic distances. c, Comparison of GAM normalized linkage and SLICE Probability of Interaction (Pi) between tested pairs of TADs. d, Distribution of inter-TAD distances obtained from cryoFISH data. Grey shading and dashed black line give the median distance expected between non-interacting TADs at different linear separations. e, The chromatin fibre is organized in topologically associating domains (TADs). Inactive TADs often coincide with LADs and are therefore generally associated with either the nuclear lamina or the surface of the nucleoli. Highly transcribed TADs and TADs containing strong enhancers form clusters away from the nuclear periphery. Inset: contacts within and between highly transcribed or strong enhancer TADs are nucleated by active genes and enhancer elements.
Figure 1
Figure 1. Concept of Genome Architecture Mapping.
a, Physical interactions between genomic loci do not follow linear genomic position. b, Physically proximal loci are found more frequently in the same thin nuclear section (nuclear profile; NP) than distant loci. c, Loci present in each NP are identified. d, Locus co-segregation scored in a large collection of NPs is used to infer preferred contacts, radial position and compaction of each locus.
Figure 2
Figure 2. GAM independently reproduces general features of genome architecture identified by Hi-C.
a, GAM and Hi-C identify similar A and B compartments by PCA at 1Mb resolution. b, GAM independently identifies TADs.
Figure 3
Figure 3. Enhancers and active genes are enriched among specifically interacting genomic regions detected using the SLICE statistical model.
a, SLICE model. Locus pairs across the genome exist in interacting or non-interacting states. Slicing through nuclei generates NPs containing both loci (M2), one locus (M1) or neither locus (M0) in different frequencies for interacting and non-interacting loci. The probability of interaction (Pi) is estimated by comparing observed with modelled state frequency. b, Prominent interactions (P ≤ 0.05) in a 3 Mb region. c, Enrichment of genomic features calculated relative to random permutation. d, Scheme for testing whether Active and Enhancer 30 kb windows preferentially contact the 5 kb window overlapping the active gene transcription start site (TSS) or transcription end site (TES). e, Average linkage from 5 kb windows overlapping active gene TSSs or TESs to prominently interacting 30 kb Active windows, Enhancer windows or non-interacting Active windows (control windows).
Figure 4
Figure 4. Super-enhancers are highly enriched among the most highly interacting TAD triplets.
a, The detection of three simultaneously interacting regions cannot be inferred from pairwise contact data alone. b, Example of a three-way interaction between TADs on chromosome 1 detected by SLICE. Large matrix shows prominent pairwise interactions over the entire region; small matrices show zoom of prominent interactions between the three TADs. c, Enrichment or depletion of different TAD classes in triplet interactions, relative to the value obtained after random shuffling of triplet positions.
Figure 5
Figure 5. Complex interactions between SE-TADs span tens of megabases.
a, SLICE probability of interaction (Pi) matrices for two genomic regions spanning 20 and 35 Mb. Positions of 500 kb FISH probes are indicated. Interactions between tested combinations of TADs are indicated (purple boxes). *The predicted Pi for SE4/Low2 is not represented in the matrix as it falls just below the significance threshold at their genomic distance. b, CryoFISH images of DAPI-stained cryosections highlight examples of interacting and non-interacting TAD pairs. c, Frequency of TAD-TAD contacts from cryoFISH images. d, Images show examples of TAD triplets.

Comment in

References

    1. Dekker J, Rippe K, Dekker M, Kleckner N. Capturing chromosome conformation. Science. 2002;295:1306–11. - PubMed
    1. Simonis M, et al. Nuclear organization of active and inactive chromatin domains uncovered by chromosome conformation capture-on-chip (4C) Nat Genet. 2006;38:1348–54. - PubMed
    1. Nora EP, et al. Spatial partitioning of the regulatory landscape of the X-inactivation centre. Nature. 2012;485:381–385. - PMC - PubMed
    1. Rodley CDM, Bertels F, Jones B, O’Sullivan JM. Global identification of yeast chromosome interactions using Genome conformation capture. Fungal Genet Biol. 2009;46:879–86. - PubMed
    1. Dixon JR, et al. Topological domains in mammalian genomes identified by analysis of chromatin interactions. Nature. 2012;485:376–380. - PMC - PubMed

Publication types