. 2017 Mar 16;543(7645):447-451.
doi: 10.1038/nature21705. Epub 2017 Mar 8.

Hypersensitive termination of the hypoxic response by a disordered protein switch

Affiliations

Hypersensitive termination of the hypoxic response by a disordered protein switch

Rebecca B Berlow et al. Nature. .

Abstract

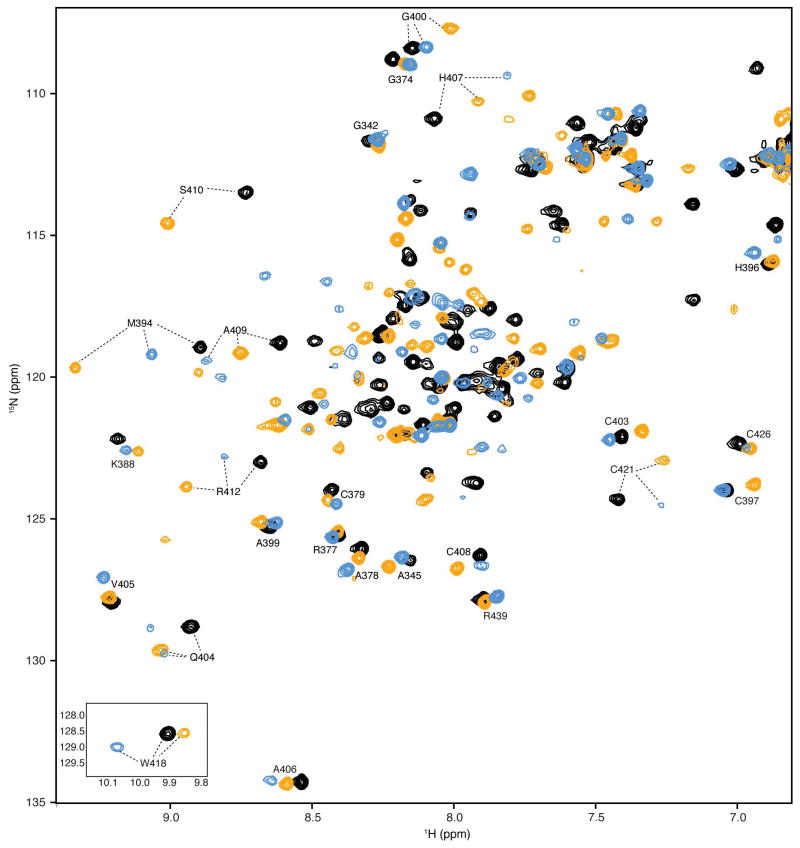
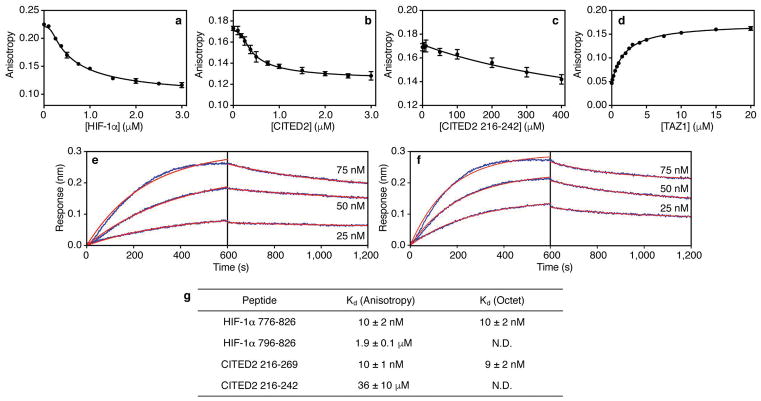
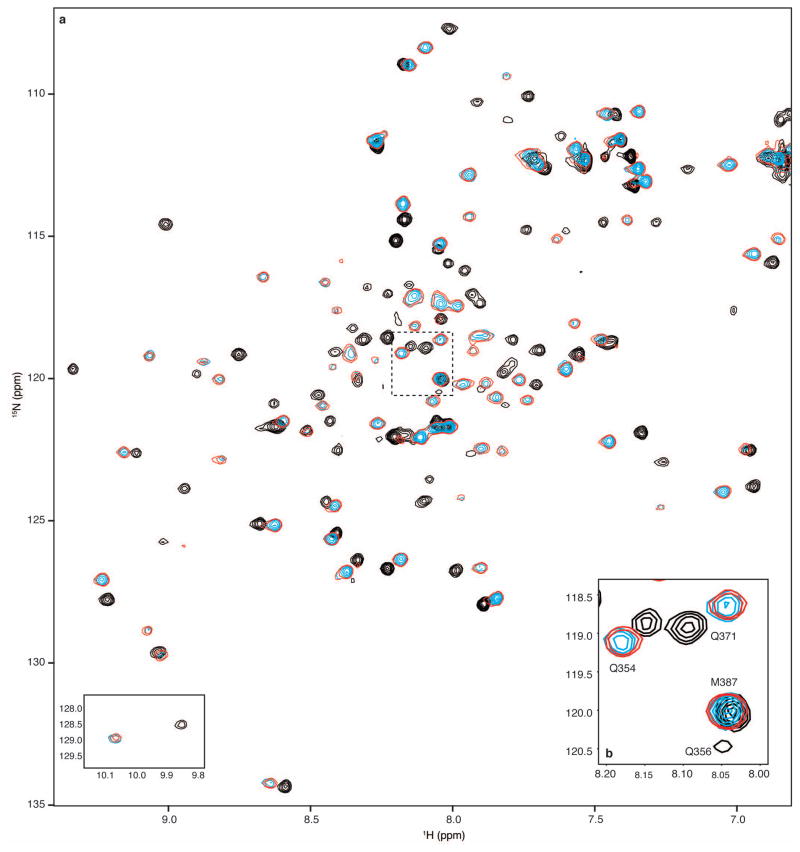
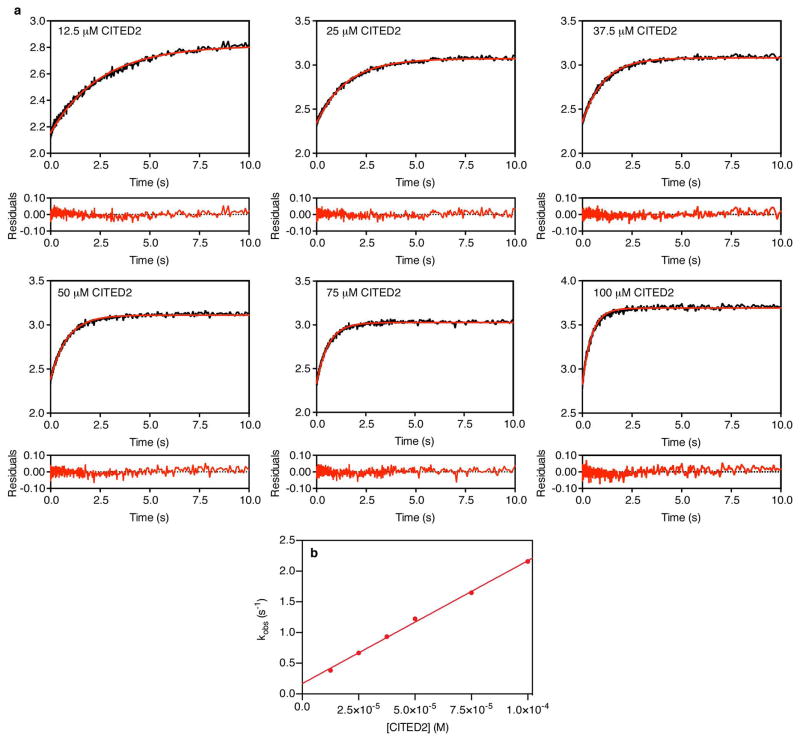
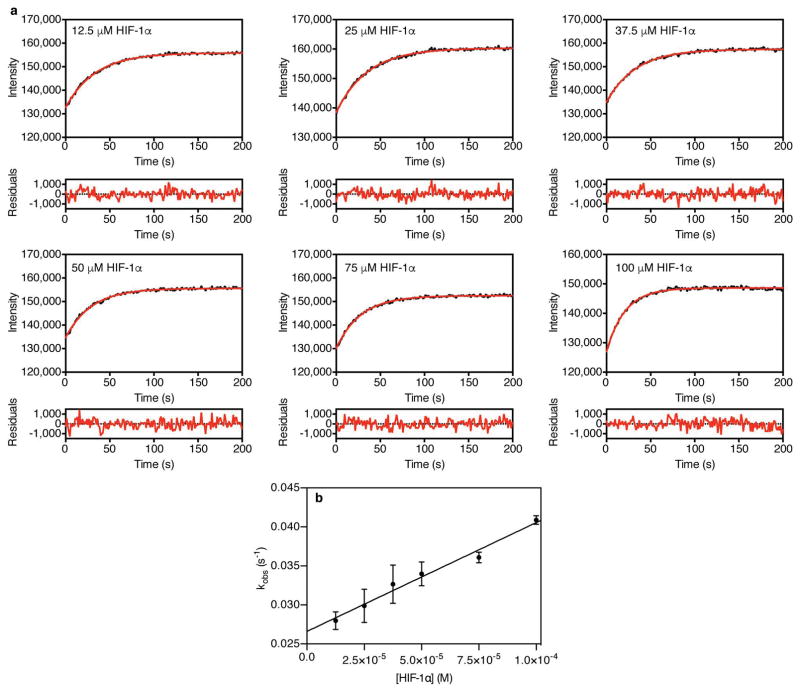
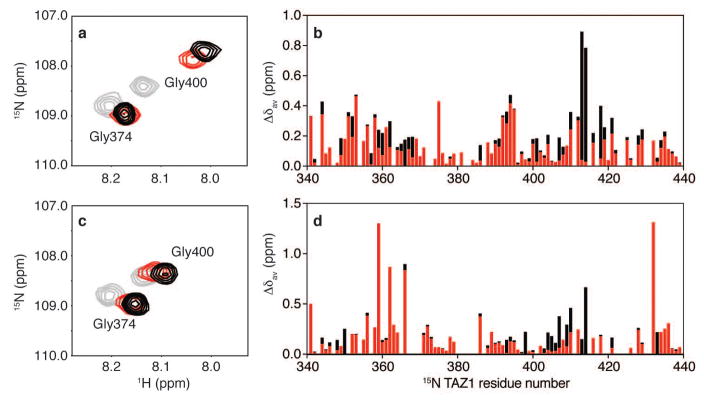
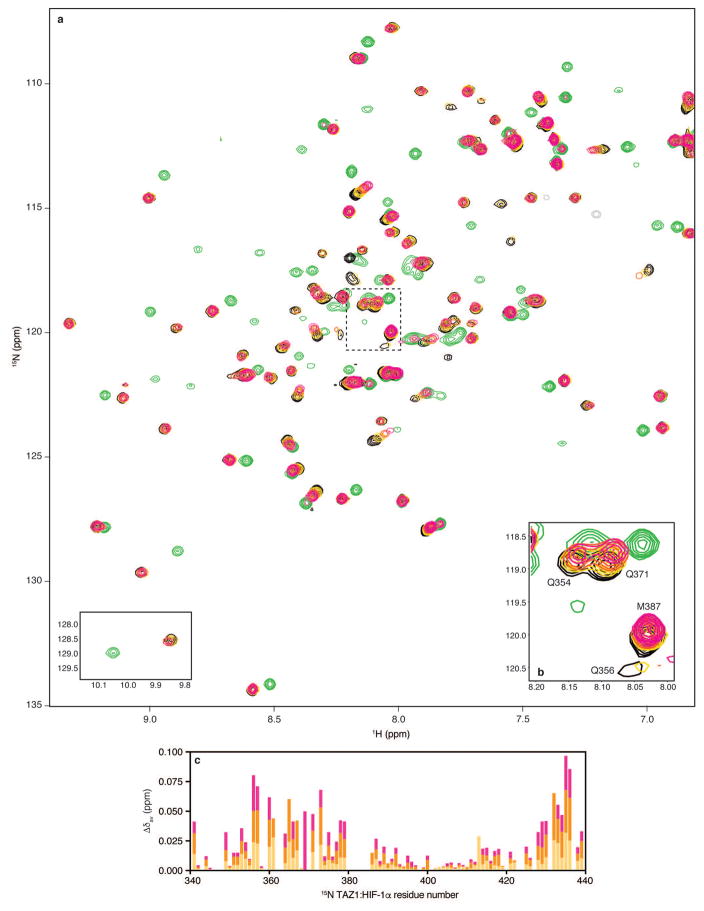
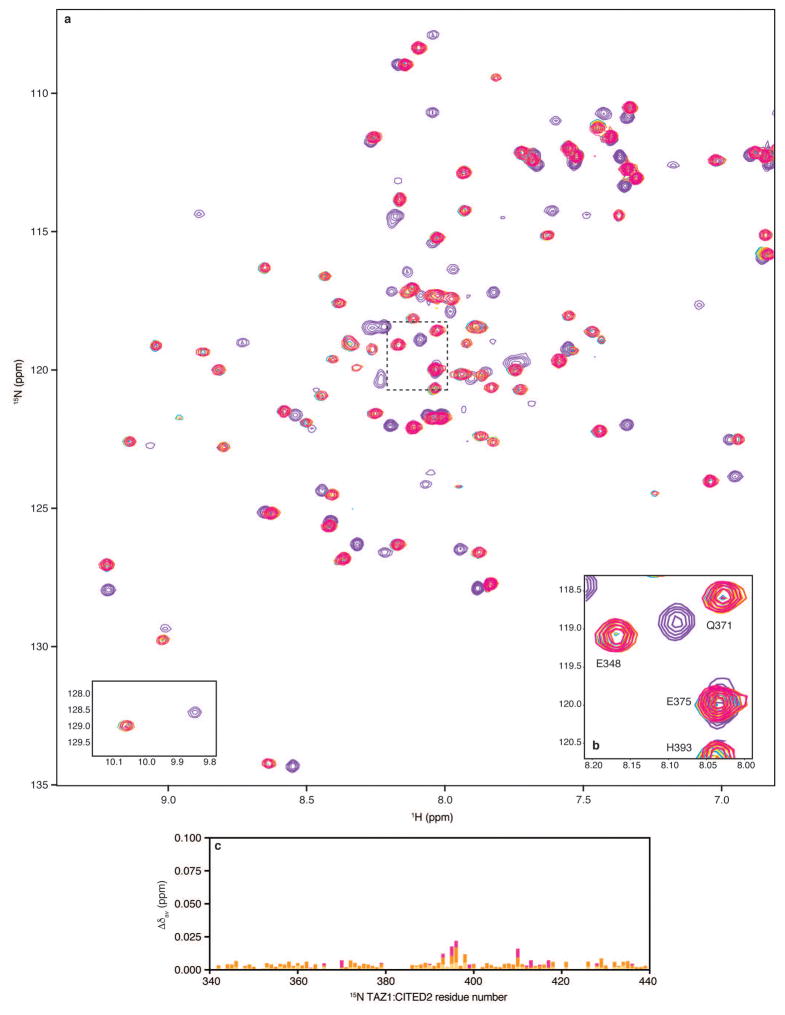
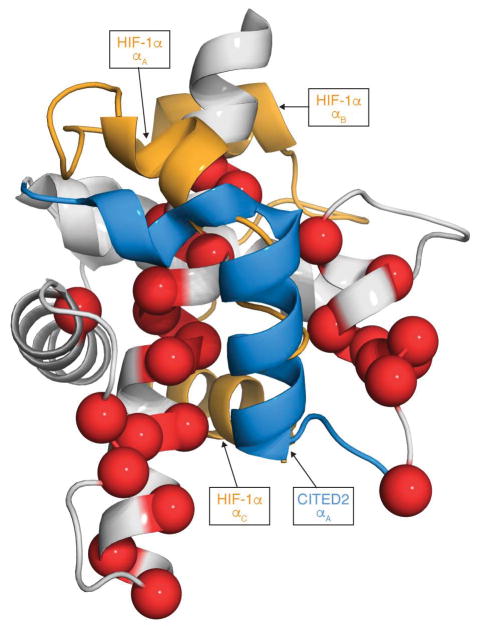
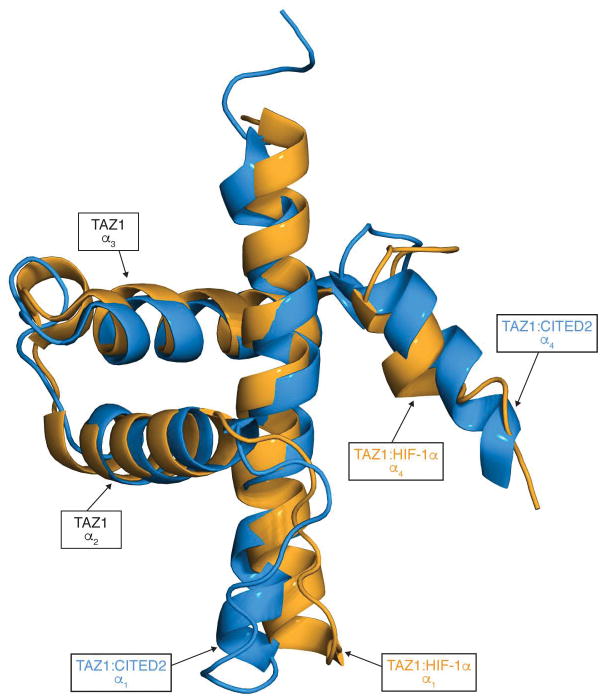
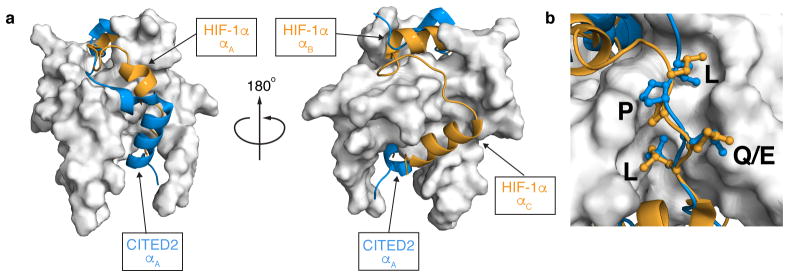
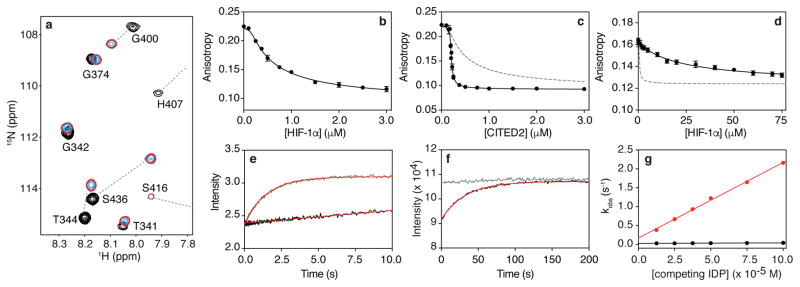
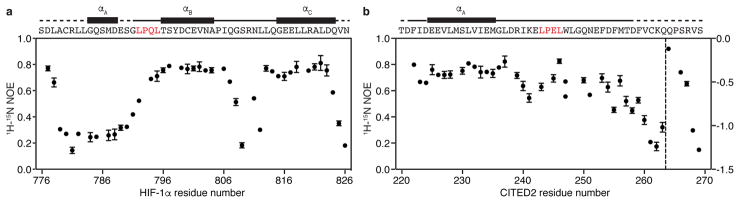
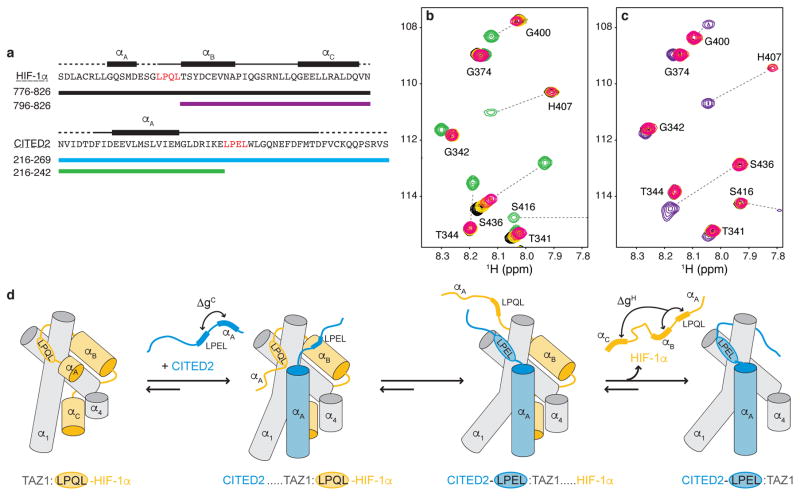
The cellular response to hypoxia is critical for cell survival and is fine-tuned to allow cells to recover from hypoxic stress and adapt to heterogeneous or fluctuating oxygen levels. The hypoxic response is mediated by the α-subunit of the transcription factor HIF-1 (HIF-1α), which interacts through its intrinsically disordered C-terminal transactivation domain with the TAZ1 (also known as CH1) domain of the general transcriptional coactivators CBP and p300 to control the transcription of critical adaptive genes. One such gene encodes CITED2, a negative feedback regulator that attenuates HIF-1 transcriptional activity by competing for TAZ1 binding through its own disordered transactivation domain. Little is known about the molecular mechanism by which CITED2 displaces the tightly bound HIF-1α from their common cellular target. The HIF-1α and CITED2 transactivation domains bind to TAZ1 through helical motifs that flank a conserved LP(Q/E)L sequence that is essential for negative feedback regulation. Here we show that human CITED2 displaces HIF-1α by forming a transient ternary complex with TAZ1 and HIF-1α and competing for a shared binding site through its LPEL motif, thus promoting a conformational change in TAZ1 that increases the rate of HIF-1α dissociation. Through allosteric enhancement of HIF-1α release, CITED2 activates a highly responsive negative feedback circuit that rapidly and efficiently attenuates the hypoxic response, even at modest CITED2 concentrations. This hypersensitive regulatory switch is entirely dependent on the unique flexibility and binding properties of these intrinsically disordered proteins and probably exemplifies a common strategy used by the cell to respond rapidly to environmental signals.


Conflict of interest statement

The authors declare no conflict of interest.

Figures

Extended Data Figure 1
Extended Data Figure 1. Representative 1H-15N HSQC spectra of 15N-TAZ1, 15N-TAZ1 bound to HIF-1α, and 15N-TAZ1 bound to CITED2
Superimposed 1H-15N HSQC spectra are shown for 15N-TAZ1 in black, 15N-TAZ1 bound to HIF-1α (residues 776-826) in orange, and 15N-TAZ1 bound to CITED2 (residues 216-269) in blue. Selected cross peaks are labeled with residue assignments. The tryptophan indole resonances are shown as an inset in the lower left corner.
Extended Data Figure 2
Extended Data Figure 2. Determination of binding affinities for HIF-1α and CITED2 peptides by fluorescence anisotropy and bio-layer interferometry (Octet)
a, Fluorescence anisotropy data for titration of unlabeled HIF-1α peptide into a pre-formed complex of Alexa Fluor 594-labeled HIF-1α peptide and unlabeled TAZ1. b, Fluorescence anisotropy data for titration of unlabeled CITED2 peptide into a pre-formed complex of Alexa Fluor 594-labeled CITED2 peptide and unlabeled TAZ1. c, Fluorescence anisotropy data for titration of unlabeled CITED2 216-242 into a pre-formed complex of Alexa Fluor 594-labeled CITED2 peptide and unlabeled TAZ1. d, Fluorescence anisotropy data for titration of unlabeled TAZ1 into Alexa Fluor 488-labeled HIF-1α 796-826. In panels a–d, the data shown represent the average (circles) and standard deviation (error bars) of three independent measurements. e, Representative bio-layer interferometry (Octet) data for HIF-1α 776-826 binding to GST-TAZ1. Data are shown in blue for three concentrations of HIF-1α as marked. The red lines are the result of fitting the data globally to obtain a shared Kd value for the three concentrations shown. f, Representative bio-layer interferometry (Octet) data for CITED2 216-269 binding to GST-TAZ1. Data are shown in blue for three concentrations of CITED2 as marked. The red lines are the result of fitting the data globally to obtain a shared Kd value for the three concentrations shown. g, Tabulated Kd values for the HIF-1α and CITED2 peptides included in this study. N.D. = not determined. The reported Kd values are the average and standard deviation of the Kd values obtained from non-linear least squares fitting of at least three independent sets of experimental data.
Extended Data Figure 3
Extended Data Figure 3. Monitoring HIF-1α and CITED2 competition for 15N-TAZ1 binding by NMR spectroscopy
a, Full 1H-15N HSQC spectra from NMR competition experiments with HIF-1α and CITED2 transactivation domain peptides. Superimposed spectra are shown for 15N-TAZ1 in the presence of one molar equivalent of HIF-1α (black), one molar equivalent of CITED2 (cyan), and one molar equivalent of both HIF-1α and CITED2 peptides (red, with fewer contours displayed for visibility). The tryptophan indole amide resonances are shown as an inset in the lower left corner. b, Detailed view of selected 15N-TAZ1 resonances. The spectral region highlighted in panel b is marked by the dotted lines on the full spectra in a. The spectra are displayed as described for a.
Extended Data Figure 4
Extended Data Figure 4. Monitoring CITED2 competition for TAZ1 binding by stopped-flow fluorescence
a. Representative time-resolved fluorescence data for rapid mixing of unlabeled CITED2 peptide with Alexa Fluor 488-labeled HIF-1α peptide in a pre-formed complex with unlabeled TAZ1 (complex concentration = 0.25 μM). The data shown are the average of 10 shots. The concentrations of CITED2 used in each experiment are indicated in the upper left corner of each graph. The red lines are fits to a single exponential function, and the residuals from fitting are shown below the graph of the data obtained at each concentration of CITED2. b. Concentration dependence of observed rates (kobs) from time-resolved fluorescence experiments monitoring CITED2 competition for TAZ1 binding, determined from stopped-flow fluorescence measurements. The data shown represent the average (circles) and standard deviation (error bars) of three independent measurements. The solid red line is the result of fitting to a linear function.
Extended Data Figure 5
Extended Data Figure 5. Monitoring HIF-1α competition for TAZ1 binding by fluorescence
Representative time-resolved fluorescence data for mixing of unlabeled HIF-1α peptide with Alexa Fluor 488-labeled HIF-1α peptide in a pre-formed complex with unlabeled TAZ1 (complex concentration = 0.25 μM). The data shown are the average of 3 independent measurements. The concentrations of HIF-1α peptide used in each experiment are indicated in the upper left corner of each graph. The red lines are fits to a single exponential function, and the residuals from fitting are shown below the graph of the data obtained at each concentration of HIF-1α. b. Concentration dependence of observed rates (kobs) from time-resolved fluorescence experiments monitoring HIF-1α competition for TAZ1 binding, determined by standard fluorescence intensity measurements. The data shown represent the average (circles) and standard deviation (error bars) of three independent measurements. The solid black line is the result of fitting to a linear function.
Extended Data Figure 6
Extended Data Figure 6. Binding of full-length and truncated HIF-1α and CITED2 transactivation domain peptides to 15N-TAZ1
a,c, Representative regions from superimposed 1H-15N HSQC spectra of 15N-TAZ1 bound to HIF-1α and CITED2 peptides. In a, free 15N-TAZ1 is shown in gray, 15N-TAZ1 bound to HIF 796-826 is shown in red, and 15N-TAZ1 bound to HIF 776-826 is shown in black. In c, 15N-TAZ1 is free (gray), bound to CITED 216-242 (red), and bound to CITED 216-269 (black). b, Weighted average 1H-15N chemical shift changes (Δδav) for each 15N-TAZ1 residue upon addition of HIF-1α 776-826 (black) and HIF-1α 796-826 (red). d, Weighted average 1H-15N chemical shift changes (Δδav) for each 15N-TAZ1 residue upon addition of CITED2 216-269 (black) and CITED2 216-242 (red). Weighted average 1H-15N chemical shift changes were calculated as Δδav = [(δH)2 + (δN/5)2]1/2.
Extended Data Figure 7
Extended Data Figure 7. Monitoring HIF-1α and CITED2 216-242 competition for 15N-TAZ1 binding by NMR spectroscopy
a, Full 1H-15N HSQC spectra from NMR competition experiments with HIF-1α peptide and CITED2 216-242. Superimposed spectra are shown for 15N-TAZ1 in the presence of one molar equivalent of HIF-1α peptide (black), five molar equivalents of CITED2 216-242 (green), and one molar equivalent of HIF-1α peptide plus one (gold), three (orange), and five (magenta) molar equivalents of CITED2 216-242. The tryptophan indole amide resonances are shown as an inset in the lower left corner. b, Detailed view of selected 15N-TAZ1 resonances. The spectral region highlighted in panel b is marked by the dotted lines on the full spectra in a. The spectra are displayed as described for a. c, Weighted average 1H-15N chemical shift changes (Δδav) for each 15N-TAZ1:HIF-1α residue upon addition of one (gold), three (orange), or five (magenta) molar equivalents of CITED2 216-242. Weighted average 1H-15N chemical shift changes were calculated as Δδav = [(δH)2 + (δN/5)2]1/2.
Extended Data Figure 8
Extended Data Figure 8. Monitoring CITED2 and HIF-1α 796-826 competition for 15N-TAZ1 binding by NMR spectroscopy
a, Full 1H-15N HSQC spectra from NMR competition experiments with CITED2 peptide and HIF-1α 796-826. Superimposed spectra are shown for 15N-TAZ1 in the presence of one molar equivalent of CITED2 peptide (cyan), five molar equivalents of HIF-1α 796-826 (purple), and one molar equivalent of CITED2 peptide plus one (gold), three (orange), and five (magenta) molar equivalents of HIF-1α 796-826. The tryptophan indole amide resonances are shown as an inset in the lower left corner. b, Detailed view of selected 15N-TAZ1 resonances. The spectral region highlighted in panel b is marked by the dotted lines on the full spectra in a. The spectra are displayed as described for a. c, Weighted average 1H-15N chemical shift changes (Δδav) for each 15N-TAZ1:CITED2 residue upon addition of one (gold), three (orange), or five (magenta) molar equivalents of HIF-1α 796-826. Weighted average 1H-15N chemical shift changes were calculated as Δδav = [(δH)2 + (δN/5)2]1/2.
Extended Data Figure 9
Extended Data Figure 9. Location of spectral changes for 15N-TAZ1:HIF-1α upon titration with the CITED2 216-242 peptide
15N-TAZ1:HIF-1α resonances that shift and/or broaden upon addition of an equimolar amount of CITED2 216-242 are mapped onto the structure of the TAZ1:HIF-1α complex as red spheres. TAZ1 (residues 340-439) is shown in gray and the HIF-1α transactivation domain is shown in orange (residues 776-826). The expected structure of the CITED2 216-242 peptide in complex with TAZ1 is shown in blue. Structural motifs of HIF-1α and CITED2 are labeled for reference.
Extended Data Figure 10
Extended Data Figure 10. Structural differences in the TAZ1 domain of CBP upon binding HIF-1α and CITED2
Superposition of the TAZ1 structures in complex with HIF-1α (orange) and CITED2 (blue). The structures of the bound HIF-1α and CITED2 peptides are omitted for clarity, and the TAZ1 helices are labeled for reference.
Figure 1
Figure 1. HIF-1α and CITED2 bind to a partially overlapping surface of TAZ1
a, Superimposed structures of the TAZ1:HIF-1α (PDB ID: 1L8C) and TAZ1:CITED2 (PDB ID: 1R8U) complexes. TAZ1 is shown in the surface representation in gray; HIF-1α (orange) and CITED2 (blue) peptides are shown as ribbons. The model is rotated 180° between the left and right panels. HIF-1α and CITED2 binding motifs are labeled. b, Expanded view of the binding site for the conserved LP(Q/E)L motif. The color scheme is as described in (a).
Figure 2
Figure 2. CITED2 is an unexpectedly efficient competitor for TAZ1
a, Portion of superimposed 1H-15N heteronuclear single quantum correlation (HSQC) spectra of 15N-TAZ1 (residues 340-439) in the presence of HIF-1α (black), CITED2 (cyan), and both HIF-1α and CITED2 peptides (red, with fewer contours displayed for clarity). b,c Fluorescence anisotropy data for titration of unlabeled HIF-1α (b) and CITED2 (c) peptides into a pre-formed complex of Alexa Fluor 594-labeled HIF-1α peptide and unlabeled TAZ1. The gray dashed line in (c) represents a simulated curve for KdCITED2 = 10 ± 1 nM (Extended Data Fig. 2). d, Fluorescence anisotropy data for titration of unlabeled HIF-1α peptide into a pre-formed complex of Alexa Fluor 594-labeled CITED2 and unlabeled TAZ1. The gray dashed line represents a simulated curve for KdHIF-1α = 10 ± 2 nM (Extended Data Fig. 2). In b, c, and d, solid black curves represent fits to the data (see Methods). e, Stopped-flow experiment monitoring the change in fluorescence of Alexa Fluor 488-labeled HIF-1α peptide in complex with unlabeled TAZ1 (complex concentration = 0.25 μM) upon rapid mixing with 25 μM HIF-1α (black) or 25 μM CITED2 (gray) peptide. f, Fluorescence intensity of Alexa Fluor 488-labeled HIF-1α peptide in complex with unlabeled TAZ1 (complex concentration = 0.25 μM) upon mixing with 25 μM HIF-1α (black) or 25 μM CITED2 (gray) peptide. In e and f the result of fitting to a single exponential function is shown in red. g, Concentration dependence of observed rates (kobs) from time-resolved fluorescence experiments monitoring HIF-1α (black) and CITED2 (red) peptide competition for TAZ1 binding. The data shown represent the average (circles) and standard deviation (error bars) of three independent measurements. The solid lines are the result of fitting to a linear function.
Figure 3
Figure 3. HIF-1α and CITED2 bind TAZ1 through both static and dynamic interactions
{1H}-15N heteronuclear NOE values for 15N-HIF-1α (a) and 15N-CITED2 (b) peptides in complex with TAZ1. The amino acid sequences of the HIF-1α and CITED2 transactivation domains and the positions of the helical motifs formed upon TAZ1 binding are shown above the data. The conserved LP(Q/E)L motif is shown in red. In b, data points to the right of the dashed vertical line are plotted according to the right y-axis. The data shown represent the average (circles) and standard deviation (error bars) of three repeated experiments.
Figure 4
Figure 4. The conserved LP(Q/E)L motif mediates competition between HIF-1α and CITED2
a, Amino acid sequences of HIF-1α (top) and CITED2 (bottom) transactivation domain peptides and locations of helical motifs. The LP(Q/E)L motif is shown in red. Truncated constructs are indicated by colored bars. b, Superimposed 1H-15N HSQC spectra of 100 μM 15N-TAZ1 in the presence of one molar equivalent of HIF-1α peptide (black), five molar equivalents of CITED2 216-242 (green), and one molar equivalent of HIF-1α peptide plus one (gold), three (orange), or five (magenta) molar equivalents of CITED2 216-242. c, Superimposed 1H-15N HSQC spectra of 100 μM 15N-TAZ1 in the presence of one molar equivalent of CITED2 peptide (cyan), five molar equivalents of HIF-1α 796-826 (purple), and one molar equivalent of CITED2 peptide plus one (gold), three (orange), or five (magenta) molar equivalents of HIF-1α 796-826. The cyan, gold, orange, magenta spectra cross peaks are almost exactly superimposed. d, Schematic mechanism for displacement of HIF-1α from its complex with TAZ1 by CITED2. The α1, α3, and α4 helices of TAZ1 are represented as gray cylinders, HIF-1α is shown in orange, and CITED2 in blue. ΔgC and ΔgH represent thermodynamic coupling between the αA and LPEL motifs of CITED2 and between the LPQL-αB and αC motifs of HIF-1α, respectively.

Comment in

References

    1. Semenza GL. Oxygen sensing, hypoxia-inducible factors, and disease pathophysiology. Annu Rev Pathol Mech Dis. 2014;9:47–71. - PubMed
    1. Henze AT, Acker T. Feedback regulators of hypoxia-inducible factors and their role in cancer biology. Cell Cycle. 2010;9:2821–2835. - PubMed
    1. Wang GL, Jiang B, Rue EA, Semenza GL. Hypoxia-inducible factor 1 is a basic-helix-loop-helix-PAS heterodimer regulated by cellular O2 tension. Proc Natl Acad Sci USA. 1995;92:5510–5514. - PMC - PubMed
    1. Arany Z, et al. An essential role for p300/CBP in the cellular response to hypoxia. Proc Natl Acad Sci USA. 1996;93:12969–12973. - PMC - PubMed
    1. Dames SA, Martinez-Yamout M, De Guzman RN, Dyson HJ, Wright PE. Structural basis for Hif-1α/CBP recognition in the cellular hypoxic response. Proc Natl Acad Sci USA. 2002;99:5271–5276. - PMC - PubMed

Publication types

MeSH terms