

Fingolimod effects in neuroinflammation: Regulation of astroglial glutamate transporters?
- PMID: 28273090
- PMCID: PMC5342171
- DOI: 10.1371/journal.pone.0171552
Fingolimod effects in neuroinflammation: Regulation of astroglial glutamate transporters?
Abstract
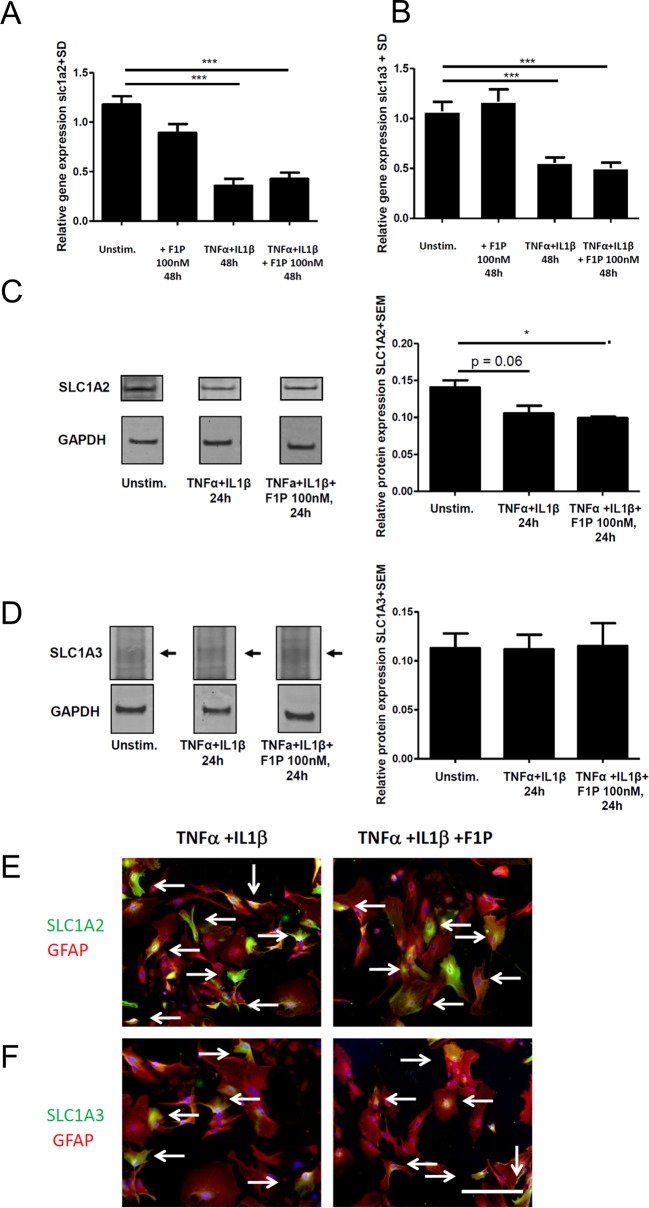
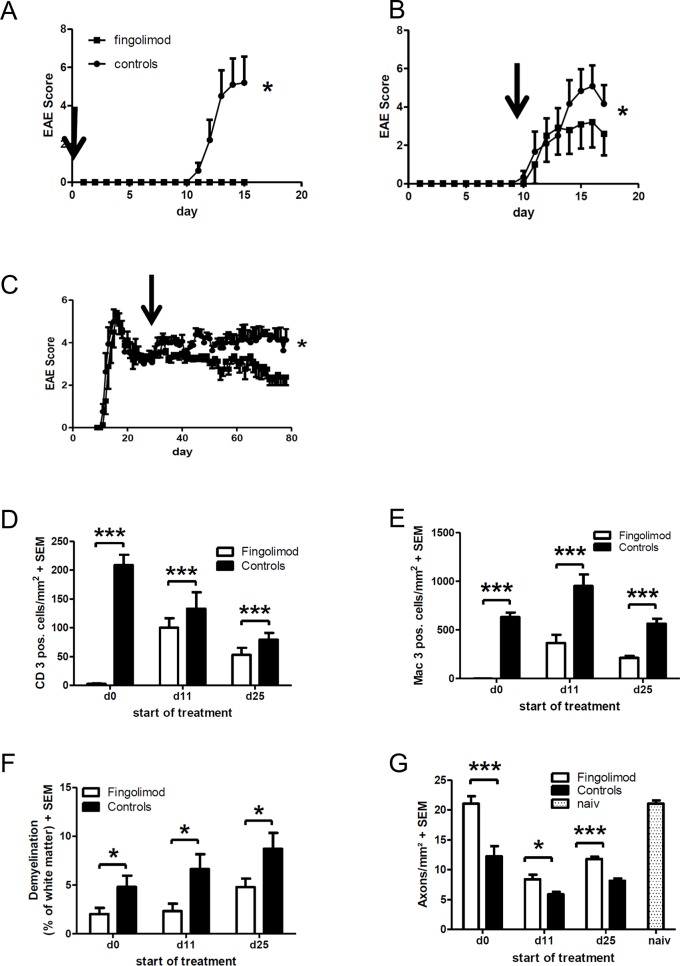
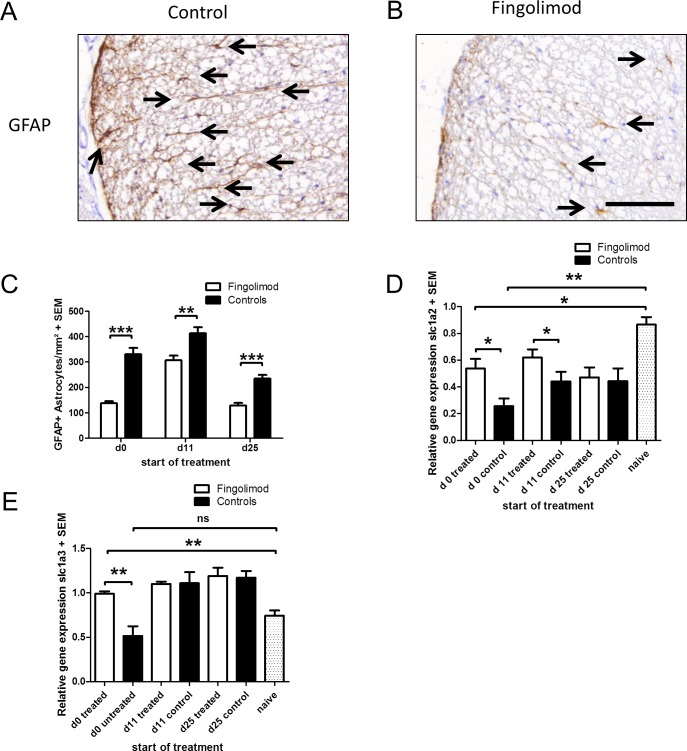
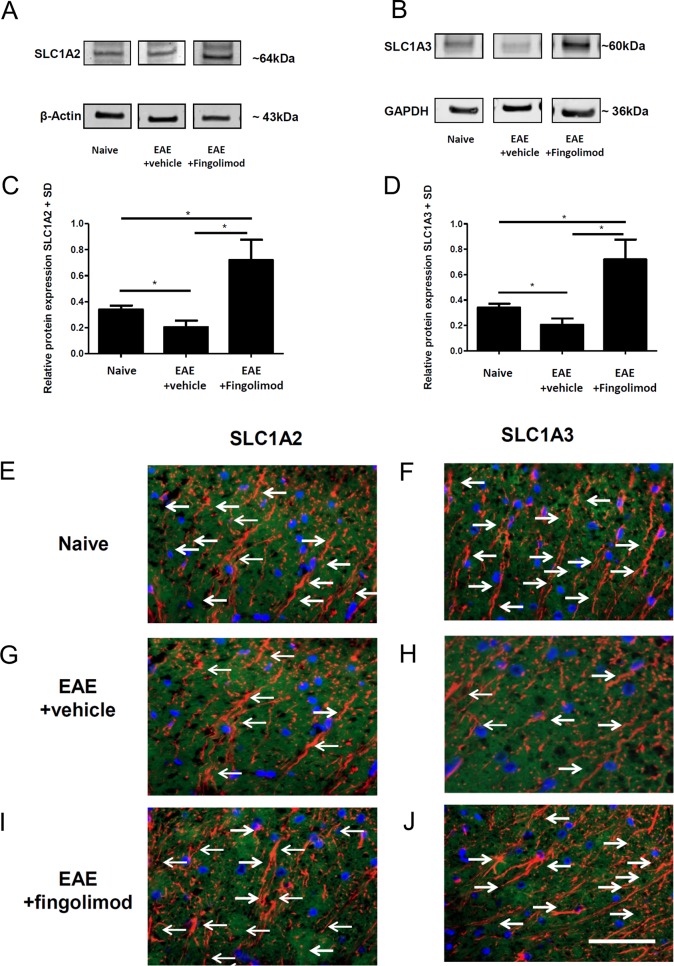
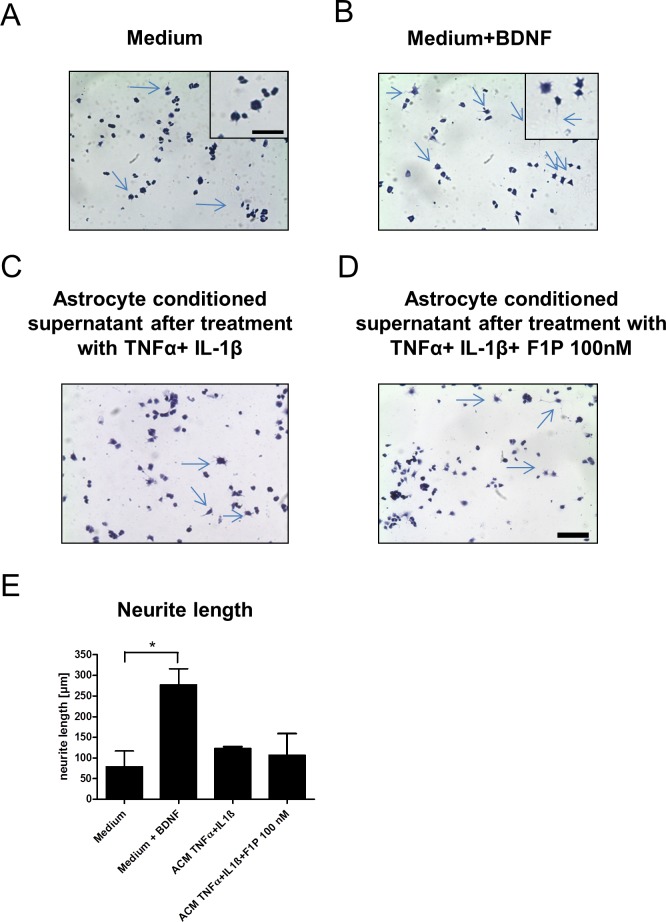
Fingolimod is an oral sphingosine-1-phosphate-receptor modulator which reduces the recirculation of immune cells and may also directly target glial cells. Here we investigate effects of fingolimod on expression of astroglial glutamate transporters under pro-inflammatory conditions. In astrocyte cell culture, the addition of pro-inflammatory cytokines led to a significant downregulation of glutamate transporters glutamate transporter-1 (slc1a2/SLC1A2) and glutamate aspartate transporter (slc1a3/SLC1A3) expression on the mRNA or protein level. In this setting, the direct application of fingolimod-1 phosphate (F1P) on astrocytes did not change expression levels of slc1a2 and slc1a3 mRNA. The analysis of both transporters on the protein level by Western Blot and immunocytochemistry did also not reveal any effect of F1P. On a functional level, the addition of conditioned supernatants from F1P treated astrocytes to neuronal cell culture did not result in increased neurite growth. In experimental autoimmune encephalomyelitis as a model of multiple sclerosis, fingolimod treatment reduced T cell and macrophages/microglia mediated inflammation and also diminished astrocyte activation. At the same time, fingolimod restored the reduced expression of slc1a2 and slc1a3 in the inflamed spinal cord on the mRNA level and of SLC1A2 and SLC1A3 on the protein level, presumably via indirect, anti-inflammatory mechanisms. These findings provide further evidence for a predominantly peripheral effect of the compound in neuroinflammation.
Conflict of interest statement
Figures
Similar articles
-
Excitatory amino acid transporter expression by astrocytes is neuroprotective against microglial excitotoxicity.Brain Res. 2008 May 19;1210:11-9. doi: 10.1016/j.brainres.2008.03.012. Epub 2008 Mar 20. Brain Res. 2008. PMID: 18410911
-
Fingolimod may support neuroprotection via blockade of astrocyte nitric oxide.Ann Neurol. 2014 Sep;76(3):325-37. doi: 10.1002/ana.24217. Epub 2014 Jul 15. Ann Neurol. 2014. PMID: 25043204
-
Methylmercury alters the in vitro uptake of glutamate in GLAST- and GLT-1-transfected mutant CHO-K1 cells.Biol Trace Elem Res. 2005 Dec;107(3):231-45. doi: 10.1385/BTER:107:3:231. Biol Trace Elem Res. 2005. PMID: 16286679
-
Potential neuroprotective effect of Fingolimod in multiple sclerosis and its association with clinical variables.Expert Opin Pharmacother. 2018 Mar;19(4):387-395. doi: 10.1080/14656566.2018.1434143. Epub 2018 Feb 3. Expert Opin Pharmacother. 2018. PMID: 29397790 Review.
-
The sphingosine 1-phosphate receptor modulator fingolimod as a therapeutic agent: Recent findings and new perspectives.Pharmacol Ther. 2018 May;185:34-49. doi: 10.1016/j.pharmthera.2017.11.001. Epub 2017 Nov 8. Pharmacol Ther. 2018. PMID: 29127024 Review.
Cited by
-
Still in Search for an EAAT Activator: GT949 Does Not Activate EAAT2, nor EAAT3 in Impedance and Radioligand Uptake Assays.ACS Chem Neurosci. 2024 Apr 3;15(7):1424-1431. doi: 10.1021/acschemneuro.3c00731. Epub 2024 Mar 13. ACS Chem Neurosci. 2024. PMID: 38478848 Free PMC article.
-
Cerebral Glutamate Regulation and Receptor Changes in Perioperative Neuroinflammation and Cognitive Dysfunction.Biomolecules. 2022 Apr 18;12(4):597. doi: 10.3390/biom12040597. Biomolecules. 2022. PMID: 35454185 Free PMC article. Review.
-
Anti-epileptogenic and Anti-convulsive Effects of Fingolimod in Experimental Temporal Lobe Epilepsy.Mol Neurobiol. 2019 Mar;56(3):1825-1840. doi: 10.1007/s12035-018-1181-y. Epub 2018 Jun 22. Mol Neurobiol. 2019. PMID: 29934763
-
TMS and EEG Pharmacodynamic Effects of a Selective Sphingosine-1-Phosphate Subtype 1 Receptor Agonist on Cortical Excitability in Healthy Subjects.Clin Pharmacol Ther. 2025 Mar;117(3):787-797. doi: 10.1002/cpt.3521. Epub 2024 Dec 6. Clin Pharmacol Ther. 2025. PMID: 39641417 Free PMC article. Clinical Trial.
-
Effects of vagus nerve stimulation are mediated in part by TrkB in a parkinson's disease model.Behav Brain Res. 2019 Nov 5;373:112080. doi: 10.1016/j.bbr.2019.112080. Epub 2019 Jul 10. Behav Brain Res. 2019. PMID: 31301412 Free PMC article.
References
-
- Danbolt NC. Glutamate uptake. Prog Neurobiol. 2001; 65 1–105 - PubMed
MeSH terms
Substances
LinkOut - more resources
Full Text Sources
Other Literature Sources
