Population structure of the hydrocoral Millepora platyphylla in habitats experiencing different flow regimes in Moorea, French Polynesia
- PMID: 28273119
- PMCID: PMC5342305
- DOI: 10.1371/journal.pone.0173513
Population structure of the hydrocoral Millepora platyphylla in habitats experiencing different flow regimes in Moorea, French Polynesia
Abstract
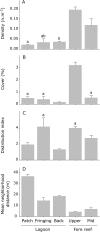
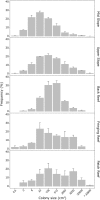
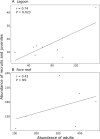
While the fire coral Millepora platyphylla is an important component of Indo-Pacific reefs, where it thrives in a wide range of environments, the ecological and biological processes driving its distribution and population structure are not well understood. Here, we quantified this species' population structure in five habitats with contrasting hydrodynamic regimes in Moorea, French Polynesia; two in the fore reef: mid and upper slopes, and three in the lagoon: back, fringing and patch reefs. A total of 3651 colonies of fire corals were mapped and measured over 45,000 m2 of surveyed reef. Due to the species' sensitivity to fragmentation in response to strong water movement, hydrodynamic conditions (e.g. waves, pass and lagoonal circulation) corresponded to marked differences in colony size distributions, morphology and recruitment dynamics among habitats. The size structure varied among reef habitats with higher proportions of larger colonies in calm nearshore reefs (fringing and patch reefs), while populations were dominated by smaller colonies in the exposed fore reefs. The highest densities of fire corals were recorded in fore reef habitats (0.12-0.20 n.m-2) where the proportion of recruits and juveniles was higher at mid slope populations (49.3%) than on the upper slope near where waves break (29.0%). In the latter habitat, most colonies grew as vertical sheets on encrusting bases making them more vulnerable to colony fragmentation, whereas fire corals were encrusting or massive in all other habitats. The lowest densities of M. platyphylla occurred in lagoonal habitats (0.02-0.04 n.m-2) characterized by a combination of low water movement and other physical and biological stressors. This study reports the first evidence of population structure of fire corals in two common reef environments and illustrates the importance of water flow in driving population dynamic processes of these reef-building species.
Conflict of interest statement
Figures


Similar articles
-
On the occurrence of intracolonial genotypic variability in highly clonal populations of the hydrocoral Millepora platyphylla at Moorea (French Polynesia).Sci Rep. 2017 Nov 1;7(1):14861. doi: 10.1038/s41598-017-14684-3. Sci Rep. 2017. PMID: 29093527 Free PMC article.
-
Fire coral clones demonstrate phenotypic plasticity among reef habitats.Mol Ecol. 2017 Aug;26(15):3860-3869. doi: 10.1111/mec.14165. Epub 2017 May 30. Mol Ecol. 2017. PMID: 28475270
-
Spatial Patterns in the Distribution, Diversity and Abundance of Benthic Foraminifera around Moorea (Society Archipelago, French Polynesia).PLoS One. 2015 Dec 28;10(12):e0145752. doi: 10.1371/journal.pone.0145752. eCollection 2015. PLoS One. 2015. PMID: 26710320 Free PMC article.
-
Biology and ecology of the hydrocoral millepora on coral reefs.Adv Mar Biol. 2006;50:1-55. doi: 10.1016/S0065-2881(05)50001-4. Adv Mar Biol. 2006. PMID: 16782450 Review.
-
Environmental impacts of dredging and other sediment disturbances on corals: a review.Mar Pollut Bull. 2012 Sep;64(9):1737-65. doi: 10.1016/j.marpolbul.2012.05.008. Epub 2012 Jun 7. Mar Pollut Bull. 2012. PMID: 22682583 Review.
Cited by
-
On the occurrence of intracolonial genotypic variability in highly clonal populations of the hydrocoral Millepora platyphylla at Moorea (French Polynesia).Sci Rep. 2017 Nov 1;7(1):14861. doi: 10.1038/s41598-017-14684-3. Sci Rep. 2017. PMID: 29093527 Free PMC article.
-
Millepora in Pleistocene coral reefs of Egypt.Lethaia. 2022 Sep 7;55(2):1-12. doi: 10.18261/let.55.2.3. Lethaia. 2022. PMID: 37860272 Free PMC article. German.
-
Quantifying diversity and growth form distribution of scleractinian corals, in Mangrove Bay, El Qoseir, Egypt.Biodivers Data J. 2025 Jan 23;13:e134282. doi: 10.3897/BDJ.13.e134282. eCollection 2025. Biodivers Data J. 2025. PMID: 39896239 Free PMC article.
-
Naturally occurring fire coral clones demonstrate a genetic and environmental basis of microbiome composition.Nat Commun. 2021 Nov 4;12(1):6402. doi: 10.1038/s41467-021-26543-x. Nat Commun. 2021. PMID: 34737272 Free PMC article.
-
Comparative lipidomic analysis of phospholipids of hydrocorals and corals from tropical and cold-water regions.PLoS One. 2019 Apr 29;14(4):e0215759. doi: 10.1371/journal.pone.0215759. eCollection 2019. PLoS One. 2019. PMID: 31034482 Free PMC article.
References
-
- Wilkinson C. Status of coral reefs of the world: 2008. Global Coral Reef Monitoring Network and Reef and Rainforest Research Center; Townsville, Australia; 2008.
-
- Glynn PW. Coral reef bleaching: facts, hypotheses and implications. Glob Chang Biol. 1996; 2: 495–509.
-
- Vermeij MJA, Bak RPM. How are coral populations structured by light? Marine light regimes and the distribution of Madracis. Mar Ecol Prog Ser. 2002; 233: 105–116.
-
- Fabricius KE. Effects of terrestrial runoff on the ecology of corals and coral reefs: review and synthesis. Marine Poll Bull. 2005; 50: 125–146. - PubMed
-
- Monismith SG. Hydrodynamics of coral reefs. Annu Rev Fluid Mech. 2007; 39: 37–55.
MeSH terms
LinkOut - more resources
Full Text Sources
Other Literature Sources
Research Materials

