

Development of a new risk model for predicting cardiovascular events among hemodialysis patients: Population-based hemodialysis patients from the Japan Dialysis Outcome and Practice Patterns Study (J-DOPPS)
- PMID: 28273175
- PMCID: PMC5342257
- DOI: 10.1371/journal.pone.0173468
Development of a new risk model for predicting cardiovascular events among hemodialysis patients: Population-based hemodialysis patients from the Japan Dialysis Outcome and Practice Patterns Study (J-DOPPS)
Abstract
Background: Cardiovascular (CV) events are the primary cause of death and becoming bedridden among hemodialysis (HD) patients. The Framingham risk score (FRS) is useful for predicting incidence of CV events in the general population, but is considerd to be unsuitable for the prediction of the incidence of CV events in HD patients, given their characteristics due to atypical relationships between conventional risk factors and outcomes. We therefore aimed to develop a new prognostic prediction model for prevention and early detection of CV events among hemodialysis patients.
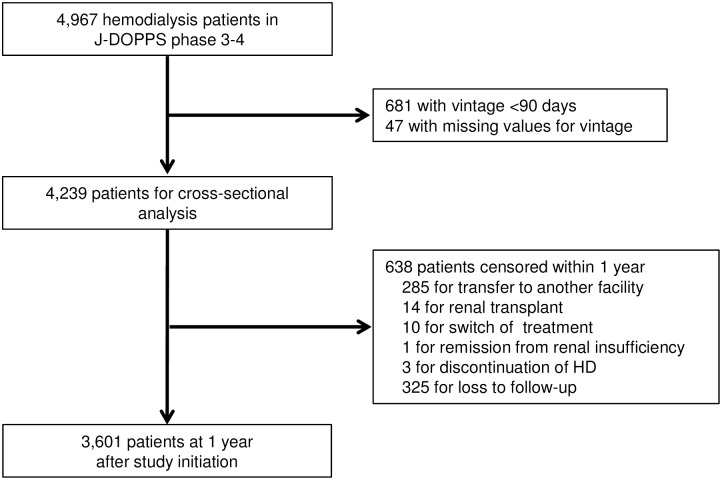
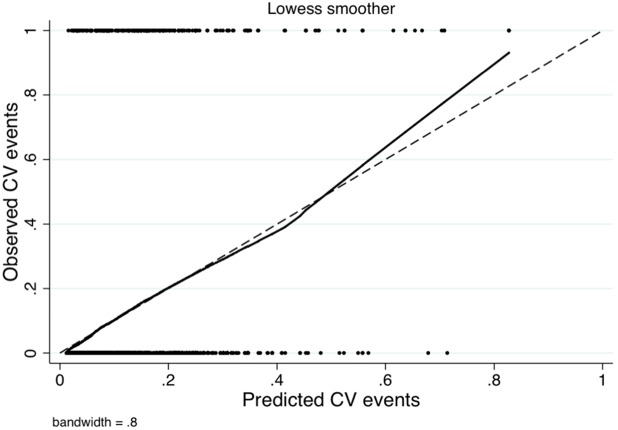
Methods: We enrolled 3,601 maintenance HD patients based on their data from the Japan Dialysis Outcomes and Practice Patterns Study (J-DOPPS), phases 3 and 4. We longitudinaly assessed the association between several potential candidate predictors and composite CV events in the year after study initiation. Potential candidate predictors included the component factors of FRS and other HD-specific risk factors. We used multivariable logistic regression with backward stepwise selection to develop our new prediction model and generated a calibration plot. Additinially, we performed bootstrapping to assess the internal validity.
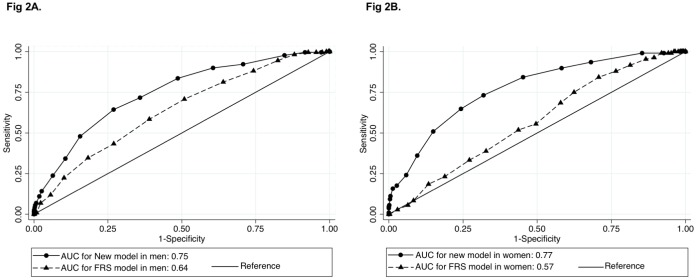
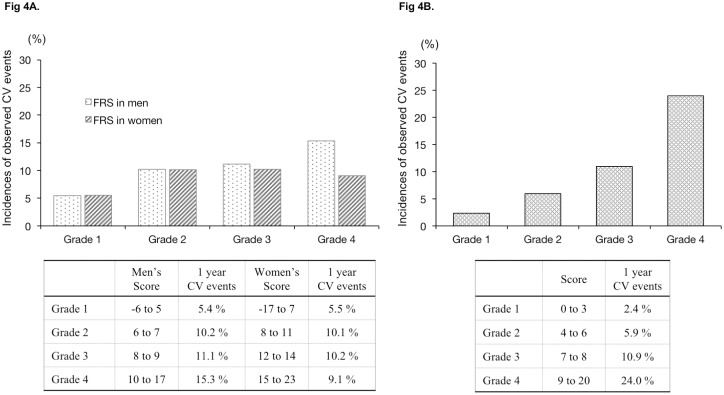
Results: We observed 328 composite CV events during 1-year follow-up. The final prediction model contained six variables: age, diabetes status, history of CV events, dialysis time per session, and serum phosphorus and albumin levels. The new model showed significantly better discrimination than the FRS, in both men (c-statistics: 0.76 for new model, 0.64 for FRS) and women (c-statistics: 0.77 for new model, 0.60 for FRS). Additionally, we confirmed the consistency between the observed results and predicted results using the calibration plot. Further, we found similar discrimination and calibration to the derivation model in the bootstrapping cohort.
Conclusions: We developed a new risk model consisting of only six predictors. Our new model predicted CV events more accurately than the FRS.
Conflict of interest statement
Figures
References
-
- Foley RN, Parfrey PS, Sarnak MJ. Epidemiology of cardiovascular disease in chronic renal disease. J Am Soc Neohrol. 1998; 9: S16–23. - PubMed
-
- Goodkin DA, Young EW, Kurokawa K, Prütz KG, Levin NW. Mortality among hemodialysis patients in Europe, Japan, and the United States: case-mix effects. Am J Kidney Dis. 2004; 44: 16–21. - PubMed
-
- K.DOQI Workgroup. K/DOQI clinical practice guidelines for cardiovascular disease in dialysis patients. Am J Kidney Dis. 2005; 45: S1–153. - PubMed
MeSH terms
LinkOut - more resources
Full Text Sources
Other Literature Sources
Medical
