

Population Pharmacokinetic Modeling of Secukinumab in Patients With Moderate to Severe Psoriasis
- PMID: 28273356
- PMCID: PMC5485066
- DOI: 10.1002/jcph.876
Population Pharmacokinetic Modeling of Secukinumab in Patients With Moderate to Severe Psoriasis
Abstract
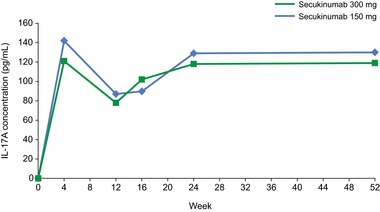
Secukinumab is a human monoclonal antibody with demonstrated efficacy for moderate to severe psoriasis; it binds to and neutralizes interleukin (IL)-17A. The pharmacokinetic (PK) parameters of secukinumab were best described by a 2-compartment model. Only weight was included in the final model, as other covariates did not affect clinical relevance. The estimated serum clearance of secukinumab was 0.19 L/day, with interindividual variability (IIV) of 32% coefficient of variation (CV), and low total volume of distribution (central compartment volume, 3.61 L with IIV of 30% CV; peripheral compartment volume, 2.87 L with IIV of 18% CV). The bioavailability of secukinumab after subcutaneous dosing was approximately 73%, with an absorption rate of 0.18/day with IIV of 35% CV. The PK profile of secukinumab was linear, with no evidence of a dose dependence of clearance. Clearance and volume of secukinumab varied with body weight in an allometric relationship. The time to maximum serum concentration at steady state occurred approximately 6 days after dosing for both secukinumab 300 mg and secukinumab 150 mg. Overall, the PK properties of secukinumab were typical of a 150-kDa human IgG1 antibody interacting with a soluble target.
Keywords: IL-17A; monoclonal antibody; pharmacodynamics; population pharmacokinetics; psoriasis; secukinumab.
© 2017 The Authors. The Journal of Clinical Pharmacology Published by Wiley Periodicals, Inc. on behalf of American College of Clinical Pharmacology.
Figures
References
-
- Lynde CW, Poulin Y, Vender R, Bourcier M, Khalil S. Interleukin 17A: toward a new understanding of psoriasis pathogenesis. J Am Acad Dermatol. 2014;71(1):141–150. - PubMed
-
- Nestle FO, Kaplan DH, Barker J. Psoriasis. N Engl J Med. 2009;361(5):496–509. - PubMed
-
- Di Cesare A, Di Meglio P, Nestle FO. The IL‐23/Th17 axis in the immunopathogenesis of psoriasis. J Invest Dermatol. 2009;129(6):1339–1350. - PubMed
MeSH terms
Substances
LinkOut - more resources
Full Text Sources
Other Literature Sources
Medical
