. 2017 Mar 7;25(3):610-621.
doi: 10.1016/j.cmet.2017.02.005.

Matching Dietary Amino Acid Balance to the In Silico-Translated Exome Optimizes Growth and Reproduction without Cost to Lifespan

Affiliations

Matching Dietary Amino Acid Balance to the In Silico-Translated Exome Optimizes Growth and Reproduction without Cost to Lifespan

Matthew D W Piper et al. Cell Metab. .

Erratum in

Abstract

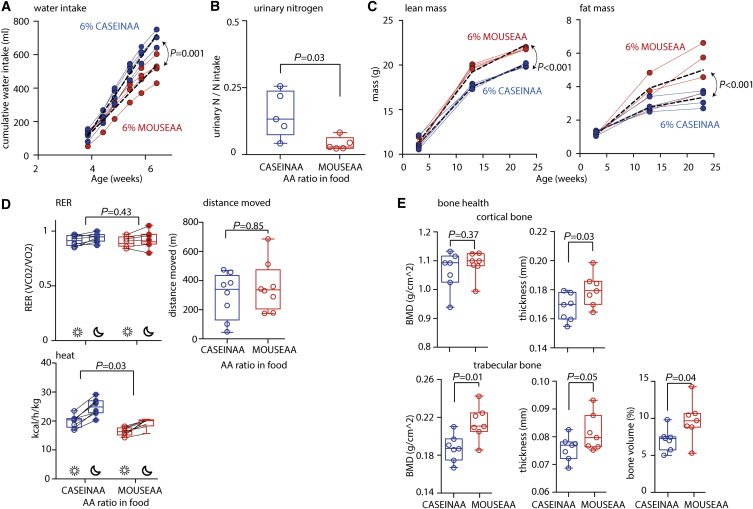
Balancing the quantity and quality of dietary protein relative to other nutrients is a key determinant of evolutionary fitness. A theoretical framework for defining a balanced diet would both reduce the enormous workload to optimize diets empirically and represent a breakthrough toward tailoring diets to the needs of consumers. Here, we report a simple and powerful in silico technique that uses the genome information of an organism to define its dietary amino acid requirements. We show for the fruit fly Drosophila melanogaster that such "exome-matched" diets are more satiating, enhance growth, and increase reproduction relative to non-matched diets. Thus, early life fitness traits can be enhanced at low levels of dietary amino acids that do not impose a cost to lifespan. Exome matching also enhanced mouse growth, indicating that it can be applied to other organisms whose genome sequence is known.

Keywords: Drosophila; amino acids; diet balance; dietary restriction; fitness; growth; lifespan; mouse; reproduction; trade-off.


Figures

None
Graphical abstract
Figure 1
Figure 1
“Exome Matching” to Design Dietary AA Ratios (A) Computationally, we assembled the proportional representation of each amino acid (AA) in each of D. melanogaster’s 19,736 genes. From these, the mean proportional representation of each AA for all genes was determined. This “exome-matched” proportion is that in FLYAA. (B) Comparison of the relative abundance of each AA profile in this study: MM1AA (mismatch1 AA), FLYAA, MM2AA (mismatch2 AA), and YAA (yeast AA). The ten EAAs are listed first, followed by the non-essentials (gray text).
Figure 2
Figure 2
Effect of AA Ratio on Drosophila Feeding (A) Flies pre-starved for AAs were offered two diets differing only in the AA ratio (total mass fixed at 21.4 g/L). Flies preferred the matched ratio (FLYAA) over either MM1AA or MM2AA (p < 0.03 in all trials). No preference was observed when the choice was MM1AA versus MM2AA (p > 0.29 in 8 trials, p = 0.02 in 1 trial) (nine independent trials for MM1AA versus MM2AA, five independent trials each for FLYAA versus MM1AA and FLYAA versus MM2AA; chi-square test; 40 flies per assay). (B) After pre-feeding on a yeast-based diet, food intake of holidic medium was assessed using flyPAD. Flies on FLYAA ate significantly more (p = 0.03) than those on MM1AA, but not MM2AA (p = 0.06). After outlier (gray data points) removal, comparison of FLYAA versus MM2AA became significant (p = 0.02), while confidence in the difference between FLYAA and MM2AA increased (p = 0.01), indicating FLYAA has greater appetitive value than the MM diets (32 individually housed flies monitored per treatment; Wilcoxon rank-sum test and Tukey’s test for outlier detection). (C) Yeast intake was assessed using flyPAD after flies were pretreated on the indicated diets. Flies pretreated with either MM diet ate more than those pretreated with FLYAA or a yeast-based diet (p < 0.001 for all comparisons), indicating that FLYAA is more satiating than either MM diet (two independent trials with between 22 and 30 individually monitored flies per food type; linear model with trial and dietary pretreatment as fixed effects). (D) The preference of flies for yeast (higher yeast preference index, YPI) or sugar (lower YPI) was scored after pretreatment on each of the four diets indicated. FLYAA reduced YPI as effectively as yeast, and more so than either MM diet (20 independent trials for all conditions except 19 for yeast pretreatment; Dunn’s test for pairwise comparisons; p < 0.05; N.S., not significant). See also Figure S1.
Figure 3
Figure 3
Exome Matching Provides a Quantitative Assessment of Dietary AA Limitations (A) Comparing the relative proportion of dietary essential AAs (EAAs; y axes) to that from in silico exome translation (x axis) reveals the most underrepresented, and thus restricting (r), EAA in the diet (red point; M in graph left of panel and R to the right). If diet and translated exome were perfectly matched, all points would lie along the black line with slope = 1. Calculations are based on EAAs (dark gray points) and conditionally EAAs (mid-gray points) because undersupply of C or Y reduces M or F, respectively. For MM1AA, reducing M to supplement C did not surpass the limitation by R. Non-essentials (light gray points) can be generated de novo. (B) Increasing or decreasing R concentration in MM1AA produced a proportionally matched change in egg laying. This was not the case for another EAA, lysine (K) (three trials; different letters represent significant differences, p < 0.05, Wilcoxon rank-sum test; five replicate vials per treatment per trial). (C) Egg laying (green bars) increased in proportion to R addition up to ∼1.7×, but not higher. Gray bars show egg-laying prediction if only constrained by R. Red bars show the prediction from exome matching that M becomes a limiting AA at 1.71× R addition (representative of two trials; ten replicate vials per treatment per trial). (D) Adding isoleucine (I) to MM2AA increased egg laying (blue bars) in agreement with exome-matching prediction. Exome matching (red bars) predicts that W becomes limiting at 1.61× I addition (representative of two trials; ten replicate vials per treatment). (E) Five different dietary AA ratios and their relative AA proportions plotted against the proportions from exome matching. Predicted restricting EAA (r) highlighted in red. The slope of the red line through r can be used to calculate the egg-laying differences between AA ratios (only EAA shown for clarity). (F) Observed versus exome-matched predictions for egg laying on several concentrations of AA ratios shown in (E) (symbol colors matched between panels). Black diagonal line shows observations = prediction. Egg laying plateaued at intermediate and high levels corresponding to the maximum egg laying attained on concentrated yeast-based food (2SY; average shown by red data point adjacent to y axis ± SE; red shaded area). (G) Observed and expected egg laying for three concentrations of MM1AA, MM2AA, and FLYAA. Egg laying increased similarly with each total AA mass increment, but output was higher on FLYAA than either MM ratio for any given mass of AA (effect of AA ratio on egg laying, p < 0.0001; effect of AA mass, p < 0.0001; p = 0.63 for interaction; generalized linear model). Egg laying plateaued at the level of rich, yeast-based food (2SY; 10.7 g, FLYAA versus 2SY, p = 0.5; 21.4 g, FLYAA versus 2SY, p = 1; Wilcoxon rank-sum test) (2–16 trials per condition; 10 replicate vials per condition per trial). See also Figure S2. All observed egg laying data reported as mean ± SE.
Figure 4
Figure 4
Ovarian-Expressed Genes Use AA in a Pattern Similar to that of the Whole Exome Average (A) In silico-translated genes were ranked (x axis) from least to most similar based on how their AA usage represented that of the whole exome average (y axis). (B) The average rank of ovarian-expressed genes was lower than any other tissue, and was somewhat smaller than expected by chance (p = 0.09, Catmap), indicating the ovary uniquely uses AAs in a manner representative of the exome average.
Figure 5
Figure 5
Effect of AA Ratio and Concentration on Development (A) Dilutions of the total mass of AAs for each ratio lengthened fly development time. FLYAA supported quicker development than MM1AA, MM2AA, and YAA in a manner that was less affected by AA dilution (for each comparison in both assays, effect of AA mass, p < 0.001; effect of AA ratio, p < 0.003; massAA ratio, p < 0.03; linear model). Using the measured proteome for dietary AA ratio design showed no differences from exome matching (p > 0.4 for effect of AA ratio and interaction with AA mass; linear model; dashed gray lines represent model estimates). Each panel represents a different trial group in which conditions were run concurrently. Each panel shows data from three or more independent trials. (B) Numbers for each developmental stage were scored at the indicated time points and expressed as a proportion of viable individuals in the assay. The proportion at each stage changed over time and with AA ratio (p < 0.001 for effect of time, AA ratio, and their interaction), with an apparent extension of the third instar stage for MM diets (p < 0.05; data are from three trials with five replicate vials per treatment per trial; each vial contained between 24 and 29 viable individuals; for linear model with mixed effects, vial, nested within trial, was assigned as a random effect). See also Figure S3. (C) Third instar larvae were assessed for phosphorylated and total 4e-BP using western blots. Both forms had significantly lower levels for larvae from FLYAA than from the MM diets (p < 0.05; for linear model with mixed effects, AA ratio as a fixed effect and replicate blot as random effect; two rounds of gels and blotting of each diet in triplicate were run; 4e-BP bands were normalized to total protein). Corresponding blotted image shown in Figure S3A. (D) Mouse growth rate was significantly enhanced (p < 0.001) by changing a constant mass of AAs from the ratio found in casein (CASEINAA) to that of the translated mouse exome (MOUSEAA). Data collected using five mice in each of four cages per food treatment. Points connected by colored dotted lines represent mass averages per cage. One of two independent trials is shown. Linear mixed effects model: AA ratio, time, and their interaction were treated as fixed effects, while the data from individual mice (nested within cages) and the slope of their mass accumulation were random effects. Heavy black dashed lines show the data fit from the statistical model.
Figure 6
Figure 6
Exome Matching Broadly Alters Mouse Physiology (A) Mice on CASEINAA voluntarily consumed 35% more water than those on MOUSEAA (p = 0.001). Cumulative water consumption per cage shown with heavy black dashed line showing statistical model fit. One of two independent trials is shown. Liner mixed effects model: AA ratio, time, and their interaction as main effects, and cage and its interaction with time were random effects. (B) After 20 weeks of development on the media, MOUSEAA mice excreted a smaller proportion of their ingested nitrogen in urine than those fed CASEINAA (p = 0.03, Wilcoxon rank-sum test). Data show urinary nitrogen excretion from five individual mice. Collected in a single trial. (C) Feeding on MOUSEAA caused a significant increase in the rate of accumulation of both fat (p < 0.001) and lean (p < 0.001) mass during 20 weeks of exposure. Measurements are from each of five mice in four cages (cage averages, colored lines) for both diets. Data gathered from a single trial. Linear model with mixed effects: AA ratio, ln(time), and their interaction were fixed effects, while the data from individual mice (nested within cages) and the slope of their mass accumulation were random effects. (D) At night, RER of all mice was significantly increased (p = 0.01), but there was no effect of diet (p = 0.43, multivariate ANOVA). Total distance moved by mice was not different between diets (p = 0.85, t test). However, there was an increase in thermogenesis of mice on CASEINAA over those on MOUISEAA (p < 0.001), and the increase was more pronounced at night (p = 0.025, diettime of day interaction, multivariate ANOVA). Data shown are normalized to lean mass; analysis using non-normalized data yielded the same outcomes qualitatively. Data are from eight individuals at 23–24 weeks of age from a single cohort. (E) Mice that developed on MOUSEAA had significantly enhanced femur cortical thickness (p = 0.03), trabecular bone mineral density (BMD) (p = 0.01), and trabecular volume (p = 0.44) when compared with those reared on CASEINAA. t test. Data collected from one trial. Seven animals per condition. See also Figure S6.
Figure 7
Figure 7
Exome Matching Alters Mouse Development, but Not Fly Lifespan (A) CASEINAA and another MMAA profile (mmMOUSEAA) had similar, but significantly different (p < 0.05), growth rates. (B and C) Reducing the AA (B) predicted to be limiting in mmMOUSEAA (T) reduced growth rate (p < 0.001), but reducing M (C), which was predicted by exome matching to be in excess, did not (p = 0.22). (D) No growth rate difference was detectable for mice feeding on MOUSEAA versus those maintained on NRCAA (p = 0.12). See also Figure S7. (E) Mice fed a diet with AA proportions according to whole-body AA analysis (BODYCOMPAA) had significantly slower growth rate than those on MOUSEAA (p = 0.01). Five mice in each of four cages per nutritional condition. Linear model with mixed effects: AA ratio, time, and their interaction were treated as fixed effects; individual mice nested within cages and the slope of their mass accumulation were random effects. (F) For flies, the relative concentrations of dietary AAs altered median lifespan (p < 0.001), but with no effect of AA ratio, either alone (p = 0.2) or to modify the response to AA concentration (p = 0.55). Linear model with mixed effects: AA concentration and ratio as fixed effects and trial as a random effect. Medians from four trials. A total of 100 flies per condition were used for all trials, except one in which 200 were used.

Comment in

References

    1. Bass T.M., Grandison R.C., Wong R., Martinez P., Partridge L., Piper M.D. Optimization of dietary restriction protocols in Drosophila. J. Gerontol. A Biol. Sci. Med. Sci. 2007;62:1071–1081. - PMC - PubMed
    1. Breslin T., Edén P., Krogh M. Comparing functional annotation analyses with Catmap. BMC Bioinformatics. 2004;5:193. - PMC - PubMed
    1. Bülow M.H., Aebersold R., Pankratz M.J., Jünger M.A. The Drosophila FoxA ortholog Fork head regulates growth and gene expression downstream of Target of rapamycin. PLoS ONE. 2010;5:e15171. - PMC - PubMed
    1. Chintapalli V.R., Wang J., Dow J.A. Using FlyAtlas to identify better Drosophila melanogaster models of human disease. Nat. Genet. 2007;39:715–720. - PubMed
    1. Cooper D.M. Food preferences of larval and adult Drosophila. Evolution. 1960;14:41–55.

Publication types

MeSH terms

LinkOut - more resources