. 2017 Mar 7;25(3):635-646.
doi: 10.1016/j.cmet.2017.02.007.

Orai1-Mediated Antimicrobial Secretion from Pancreatic Acini Shapes the Gut Microbiome and Regulates Gut Innate Immunity

Affiliations

Orai1-Mediated Antimicrobial Secretion from Pancreatic Acini Shapes the Gut Microbiome and Regulates Gut Innate Immunity

Malini Ahuja et al. Cell Metab. .

Abstract

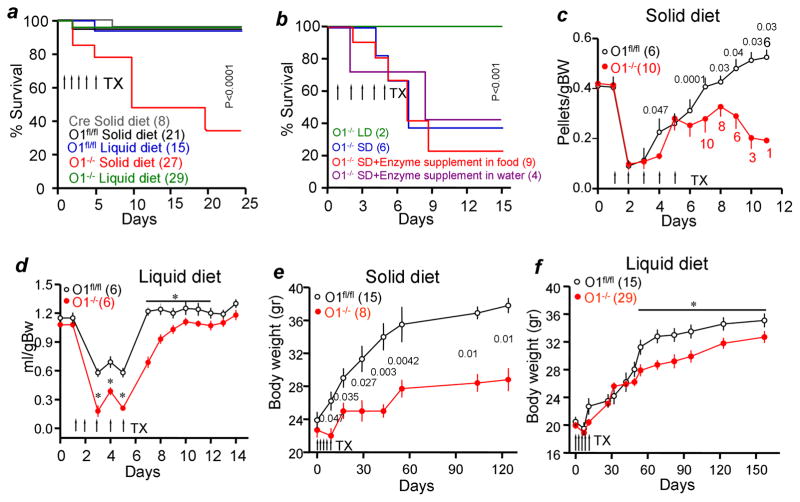
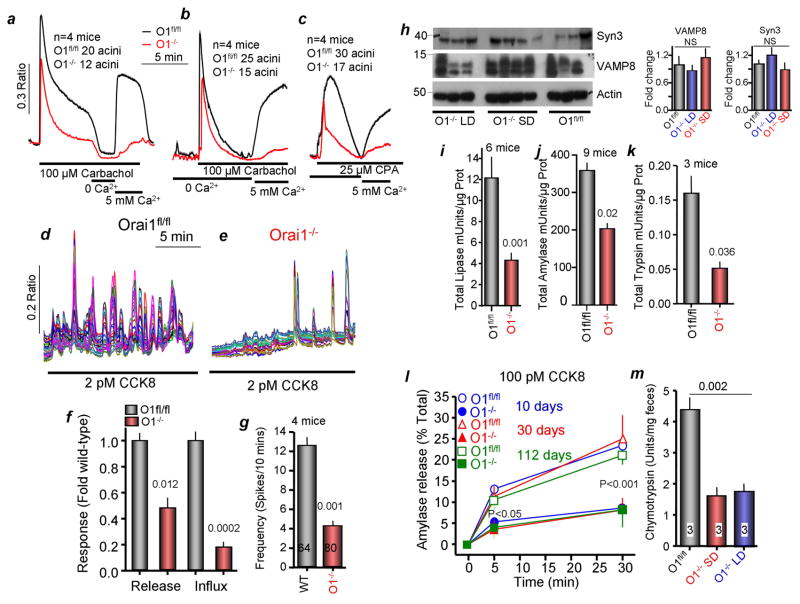
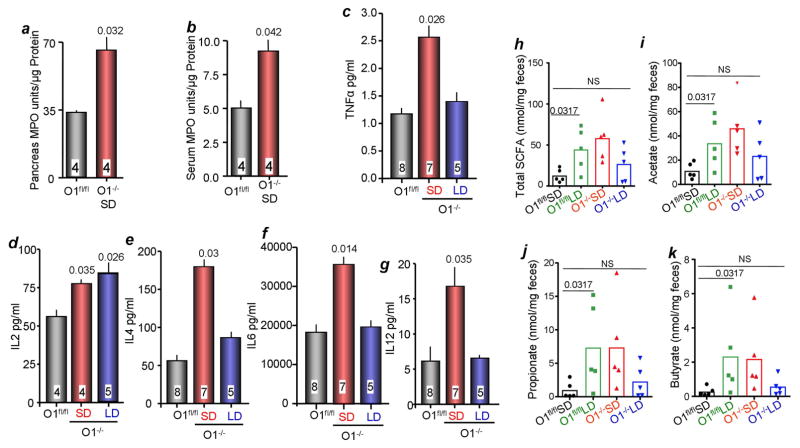
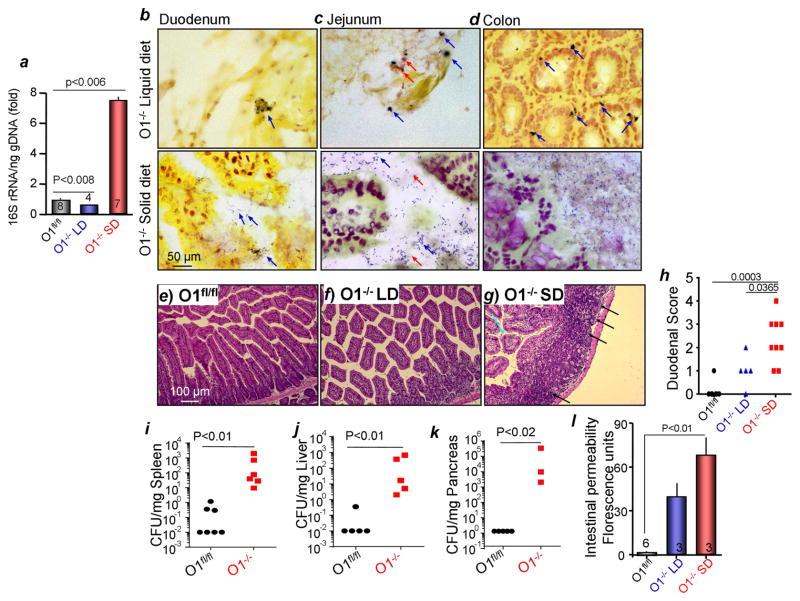
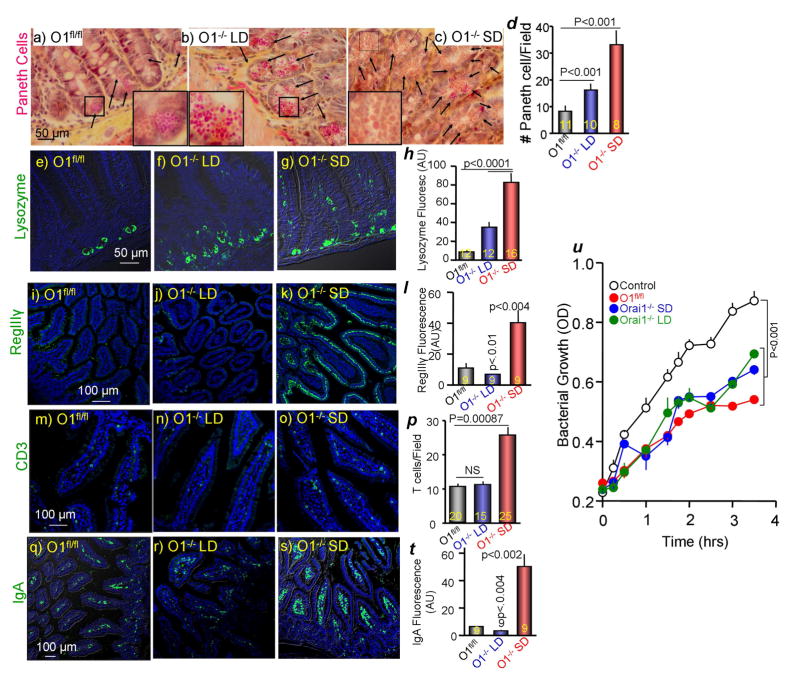
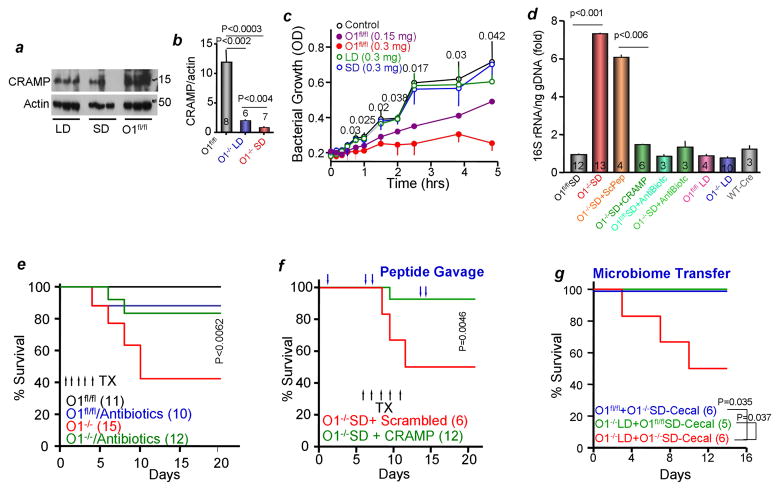
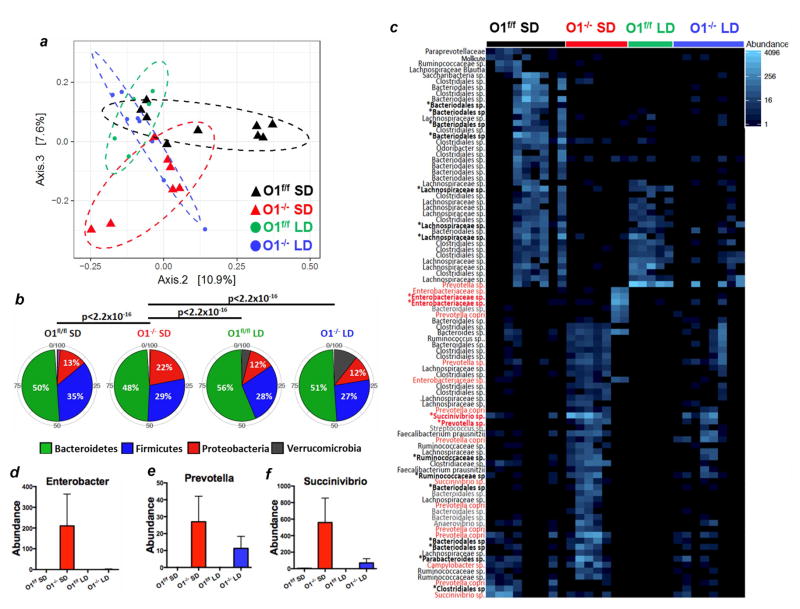
The gut microbiome participates in numerous physiologic functions and communicates intimately with the host immune system. Antimicrobial peptides are critical components of intestinal innate immunity. We report a prominent role for antimicrobials secreted by pancreatic acini in shaping the gut microbiome that is essential for intestinal innate immunity, barrier function, and survival. Deletion of the Ca2+ channel Orai1 in pancreatic acini of adult mice resulted in 60%-70% mortality within 3 weeks. Despite robust activation of the intestinal innate immune response, mice lacking acinar Orai1 exhibited intestinal bacterial outgrowth and dysbiosis, ultimately causing systemic translocation, inflammation, and death. While digestive enzyme supplementation was ineffective, treatments constraining bacterial outgrowth (purified liquid diet, broad-spectrum antibiotics) rescued survival, feeding, and weight gain. Pancreatic levels of cathelicidin-related antimicrobial peptide (CRAMP) were reduced, and supplement of synthetic CRAMP prevented intestinal disease. These findings reveal a critical role for antimicrobial pancreatic secretion in gut innate immunity.


Figures

Figure 1
Figure 1. Deletion of pancreatic acinar cells Orai1 results in death
In all experiments, the number of mice in each experiment and condition are given in brackets and p values are listed next to the points. (a) Mice carrying the pancreatic Cre, Orai1fl/fl and Orai1−/− mice were maintained on solid or liquid diets and survival determined. TX, tamoxifen (b) Orai1−/− mice maintained on solid (SD) or liquid (LD) diets were supplemented with digestive enzymes in the SD (red) or drinking water (purple). (c) Consumption of solid food by Orai1fl/fl and Orai1−/− mice. (d) Consumption of liquid food by Orai1fl/fl and Orai1−/− mice. * denotes p<0.05 or better. (e) Body weight of Orai1fl/fl and of surviving Orai1−/− mice maintained on solid diet. (f) Body weight of Orai1fl/fl and Orai1−/− mice maintained on liquid diet. * denotes p<0.05 or better.
Figure 2
Figure 2. Effect of deletion of Orai1 on Ca2+ signaling, enzymes content and exocytosis
All experiments are with Orai1fl/fl mice maintained on solid diet (controls) and Orai1−/− mice maintained on liquid diet for 10 days after last gavage with Tamoxifen, except in (m). (a) Ca2+ signaling evoked by carbachol stimulation in Orai1fl/fl (black trace) and Orai1−/− (red trace) acinar cells in Ca2+ containing medium. Where indicated the cells were exposed to 0 and 5 mM external Ca2+ to assay Ca2+ influx. (b, c) Acinar cells in Ca2+-free solution were stimulated with 100 μM carbachol (b) or 25 μM CPA (c) to assay Ca2+ release from stores and then exposed to 5 mM external Ca2+ to determine store-operated Ca2+ influx. Traces in (a–c) are mean±s.e.m of the number of acini obtained from 4 mice of each line. Each acinus comprised of 5–10 cells. (d, e) Orai1fl/fl (d) and Orai1−/− acinar cells (e) were stimulated with 2 pM CCK8 to evaluate receptor-stimulated Ca2+ oscillations. (f) Summary of Ca2+ release and influx. Here and in (g, i, k) the p values are listed in the columns. (g) Summary of Ca2+ oscillation frequency recorded in 64 Orai1fl/fl and 80 Orai1−/− acinar cells. (h) Protein levels of the granule markers syntaxin 3 and VAMP8, and of actin. The columns show the average staining intensity relative to actin and is plotted as mean±s.e.m. (i–k) Activity of total lipase (i, 6 mice), amylase (j, 9 mice) and trypsin (k, 3 mice) in Orai1fl/fl (black) and Orai1−/− acinar cells (red). (l) Time course of exocytosis stimulated by 100 pM CCK8 in acini obtained from age-matched Orai1fl/fl and Orai1−/− mice 10 (blue, circles), 30 (red, triangles) and 112 (green, squares) days after deletion of Orai1. (m) Chymotrypsin in feces of Orai1fl/fl mice (black) and Orai1−/− mice maintained on solid (red) and liquid diets (blue) for 10 days after final Tamoxifen gavage.
Figure 3
Figure 3. Inflammatory mediators and inflammatory in Orai1fl/fl and Orai1−/− mice the pancreas
(a) MPO was measured in extracts prepared from the pancreas of Orai1fl/fl (black) and Orai1−/− mice (red). (b–g) Serum from Orai1fl/fl (black), Orai1−/− mice maintained on solid (red) and liquid diets (blue) was used to measure MPO (b), TNFα (c), IL2 (d), IL4 (e), IL6 (f), and IL12 (g). The number of mice is indicated in the column and the p values relative to the level in Orai1fl/fl are listed above the columns. (h–k) Fecal SCFAs were analyzed in Orai1fl/fl maintained on solid (black) or liquid diet (green) and Orai1−/− mice maintained on liquid diet. Shown are the total level of SCFAs (h) and the levels of acetate (i), propionate (j) and butyrate (k).
Figure 4
Figure 4. Bacterial burden and intestinal inflammation in Orai1−/− mice
(a) Cecal bacterial 16S rRNA was measured in Orai1fl/fl mice and Orai1−/− mice maintained on liquid (LD) or solid diets (SD). (b–d) Duodenal (b), Jejunal (c) and colonic (d) sections obtained from Orai1−/− mice maintained on liquid (upper images) or solid diets (lower images) were stained for adherent gram negative (blue) and positive (red) bacteria. Averages are given in Figure S5a. (e–h) Example images of H&E stained duodenal section from Orai1fl/fl (e) and Orai1−/− mice maintained on LD (f) or SD diets (g). Inflammatory foci are marked by black arrows and collapsed villi are marked with turquoise arrows. (h) Shows the summary of inflammatory score for the three conditions. (i–k) Bacterial infection of the spleen (i), liver (j) and pancreas (k). (l) Intestinal permeability of the indicated mice.
Figure 5
Figure 5. Analysis of intestinal innate immunity in Orai1fl/fl and Orai1−/− mice
(a–d) Phloxine B/tartrazine staining of intestinal sections obtained from Orai1fl/fl (a) and Orai1−/− mice maintained on liquid (b) or solid diet (c). (d) Shows the average number of Paneth cells/field analyzed in the indicated number of fields obtained from 3 mice in each line. (e–h) Intestinal sections from 3 Orai1fl/fl, 3 Orai1−/− mice on liquid diet and 4 Orai1−/− mice on solid diet were stained for lysozyme (green) and counterstained for DAPI (blue). (h) Shows the average lysozyme fluorescence in the indicated number of fields. (i–l) Intestinal section from the indicated mice as in (e–h) were stained for RegIIIγ (green) and counterstained for DAPI (blue). (l) Shows the average RegIIIγ fluorescence. (m–p) Intestinal section from the indicated mice as in (e–h) were stained for CD3 T cells (green) and counterstained for DAPI (blue). (p) Shows the average number of T cells/field analyzed in the indicated number of fields. (q–t) Intestinal section from the indicated mice as in (e–h) were stained for IgA (green) and counterstained for DAPI (blue). (t) Shows the average IgA fluorescence in the indicated number of fields. (u) Secreted duodenal antibacterial killing activity of Orai1fl/fl (red) and Orai1−/− mice maintained on liquid (green) or solid diet (blue). Results are mean±s.e.m of extracts obtained from 3 mice in each line. Deletion of pancreatic acinar Orai1 did not inhibit intestinal antibacterial secretion and killing.
Figure 6
Figure 6. Pancreatic bacterial killing role in the gut microbiome
(a, b) Pancreatic extracts from Orai1fl/fl and Orai1−/− mice maintained on liquid or solid diets were analyzed for total CRAMP. Shown are sample blots and the average from the indicated number of mice is given in the columns. (c) Secreted antibacterial killing activity by Orai1fl/fl and Orai1−/− acinar cells stimulated with 100 pM CCK8 is tested as inhibition of E. coli growth. The results are mean±s.e.m of extracts obtained from 3 mice in each line. (d) Cecal 16S rRNA extracted from the indicated number of mice that were treated with CRAMP or scrambled peptides or antibiotics and maintained on LD or SD was measured by qPCR. Results are expressed as mean±s.e.m. (e) Survival of mice untreated or treated with wide-spectrum antibiotics for one week before and during the experiment provided in drinking water. TX, tamoxifen (f) Survival of Orai1−/− SD mice after gavage at the time indicated by the blue arrows with 100 μg CRAMP peptide dissolved in 200 μl PBS. Control mice were gavaged with scrambled peptide. (g) Microbiome transplant was accomplished by gavaging Orai1fl/fl (blue) and Orai1−/− mice maintained on liquid diet (red) with cecal bacteria from Orai1−/− mice maintained on solid diet. As an additional control, Orai1−/− mice maintained on liquid diet were gavaged with cecal bacteria from Orai1fl/fl mice (green).
Figure 7
Figure 7. Analysis of the microbiome in Orai1fl/fl and Orai1−/− mice
(a) PCoA analysis in Orai1fl/fl mice maintained on solid diet (black), Orai1fl/fl mice maintained on liquid diet (green), Orai1−/− mice maintained on solid diet (red) and Orai1−/− mice maintained on liquid diet (blue). Increased distance between data points represents less similarity between overall taxonomic profiles (b) The 5 most abundant phyla from each group of mice are shown. Proteobacteria are significantly enriched in the Orai1−/− mice on solid diet relative to the other groups. (c) OTUs with differential expression between Orai1−/− mice and Orai1fl/f mice are shown. Asterisks denote OTUs with FDR-corrected p <0.05. Red denotes pathogenic strains. (d–f) Differences in mean count for several pathogenic OTUs with FDR-corrected p<0.05 are shown between the four groups of mice.

Comment in

References

    1. Albenberg LG, Wu GD. Diet and the intestinal microbiome: associations, functions, and implications for health and disease. Gastroenterology. 2014;146:1564–1572. - PMC - PubMed
    1. Biragyn A, Ruffini PA, Leifer CA, Klyushnenkova E, Shakhov A, Chertov O, Shirakawa AK, Farber JM, Segal DM, Oppenheim JJ, et al. Toll-like receptor 4-dependent activation of dendritic cells by beta-defensin 2. Science. 2002;298:1025–1029. - PubMed
    1. Cao X, Choi S, Maleth JJ, Park S, Ahuja M, Muallem S. The ER/PM microdomain, PI(4,5)P(2) and the regulation of STIM1-Orai1 channel function. Cell calcium. 2015;58:342–348. - PMC - PubMed
    1. Clevers HC, Bevins CL. Paneth cells: maestros of the small intestinal crypts. Annual review of physiology. 2013;75:289–311. - PubMed
    1. Davis FM, Janoshazi A, Janardhan KS, Steinckwich N, D’Agostin DM, Petranka JG, Desai PN, Roberts-Thomson SJ, Bird GS, Tucker DK, et al. Essential role of Orai1 store-operated calcium channels in lactation. Proceedings of the National Academy of Sciences of the United States of America. 2015;112:5827–5832. - PMC - PubMed

MeSH terms