. 2017 Mar 8;17(3):1326-1335.
doi: 10.1021/acs.nanolett.6b03329. Epub 2016 Dec 5.

Lipid Nanoparticle Assisted mRNA Delivery for Potent Cancer Immunotherapy

Affiliations

Lipid Nanoparticle Assisted mRNA Delivery for Potent Cancer Immunotherapy

Matthias A Oberli et al. Nano Lett. .

Abstract

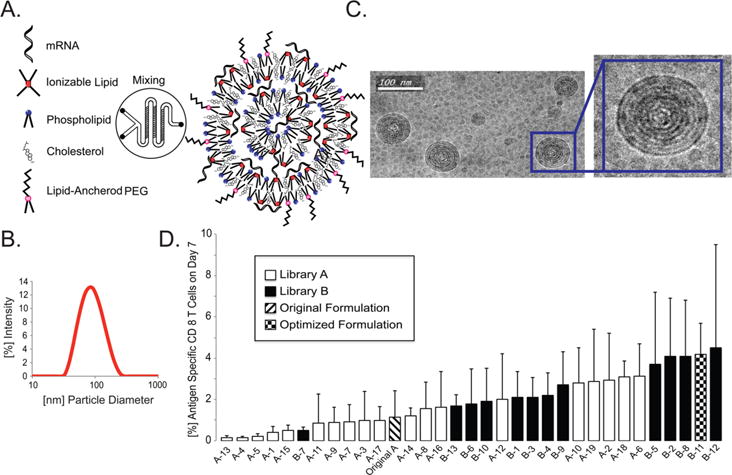
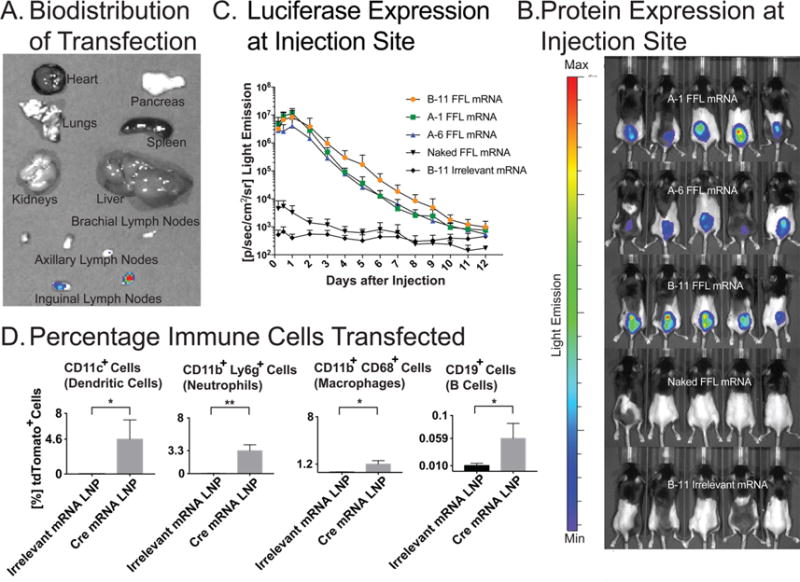
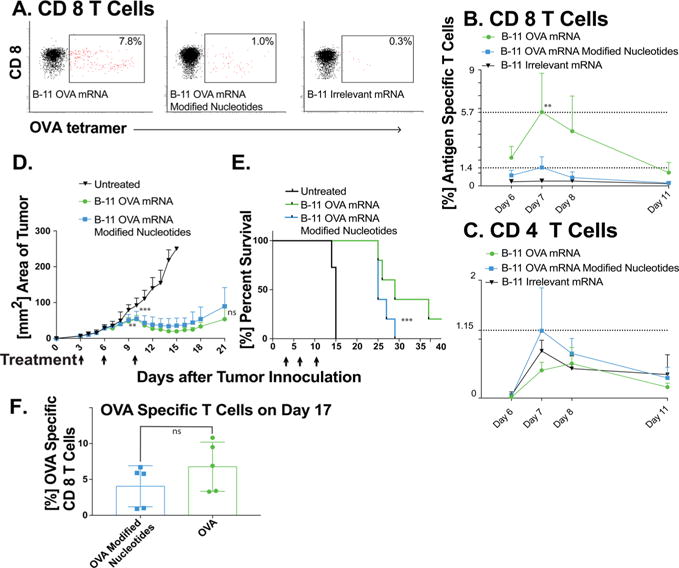
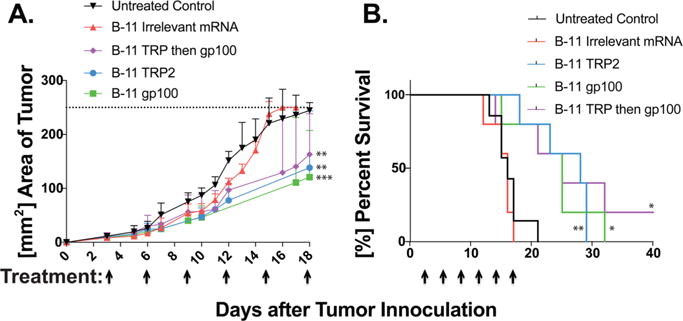
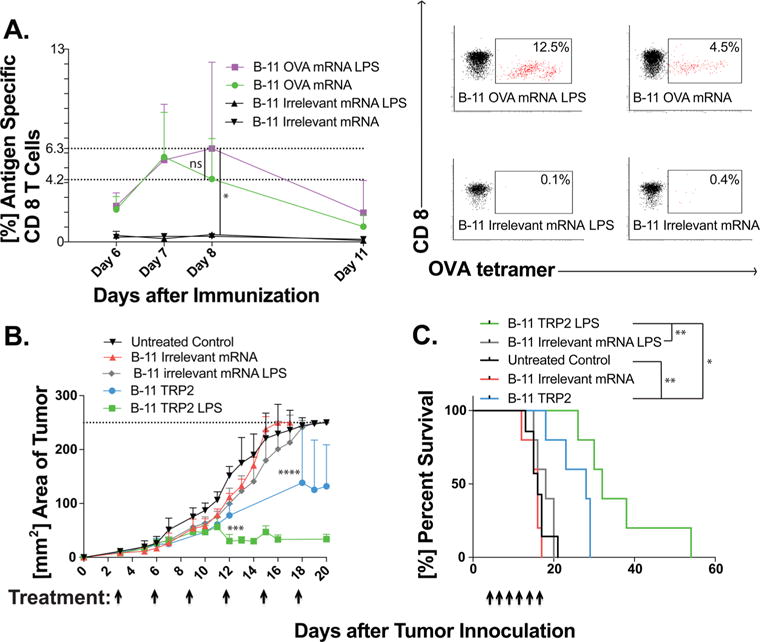
The induction of a strong cytotoxic T cell response is an important prerequisite for successful immunotherapy against many viral diseases and tumors. Nucleotide vaccines, including mRNA vaccines with their intracellular antigen synthesis, have been shown to be potent activators of a cytotoxic immune response. The intracellular delivery of mRNA vaccines to the cytosol of antigen presenting immune cells is still not sufficiently well understood. Here, we report on the development of a lipid nanoparticle formulation for the delivery of mRNA vaccines to induce a cytotoxic CD 8 T cell response. We show transfection of dendritic cells, macrophages, and neutrophils. The efficacy of the vaccine was tested in an aggressive B16F10 melanoma model. We found a strong CD 8 T cell activation after a single immunization. Treatment of B16F10 melanoma tumors with lipid nanoparticles containing mRNA coding for the tumor-associated antigens gp100 and TRP2 resulted in tumor shrinkage and extended the overall survival of the treated mice. The immune response can be further increased by the incorporation of the adjuvant LPS. In conclusion, the lipid nanoparticle formulation presented here is a promising vector for mRNA vaccine delivery, one that is capable of inducing a strong cytotoxic T cell response. Further optimization, including the incorporation of different adjuvants, will likely enhance the potency of the vaccine.

Keywords: cancer immunotherapy; cytotoxic T cells; immune response; lipid nanoparticles; mRNA; vaccines.


Conflict of interest statement

Notes

The authors declare the following competing financial interest(s): Robert Langer is co-founder and member of the board of directors of Moderna Therapeutics. The authors have no other relevant affiliations or financial involvement with any organization or entity with a financial interest in, or financial conflict with, the subject matter or materials discussed in the manuscript apart from those disclosed.

Figures

Figure 1
Figure 1
(A) A formulation of lipid nanoparticles is synthesized by mixing the aqueous phase containing the mRNA and the ethanol phase containing the lipophilic compounds, using a microfluidic device. The ionizable lipid complexes with the negatively charged mRNA at low pH and can both facilitate endocytosis and endosomal escape. Phospholipid provides structural integrity to the bilayers and can assist with endosomal escape of the mRNA to the cytosol. Cholesterol helps stabilize the LNPs and promotes membrane fusion. The lipid-anchored polyethylene glycol prevents LNP aggregation and reduces nonspecific interactions. (B) Size analysis of formulation B-11. Diameter distribution of the LNPs comprising the vaccine solution formulated with OVA mRNA, as determined using dynamic light scattering (DLS). (C) Cryogenic transmission electron microscopy image of the LNP solution suggests that the LNPs have a spherical shape and consist of a multilamellar structure. (D) In the first phase of the optimization (Library A; empty columns), different components were investigated, each at a constant molar composition. Percentages of OVA specific CD 8 T cells 7 days after the injection of 10 μg of total mRNA per mouse are plotted for each formulation, including the original formulation (hatched column). The data are presented as mean + SD, n = 5. The three components, C14-PEG2000 (A-12), cKK-E12 (A-2), and SLS (A-18) in Library A were identified for further investigation in Library B (black columns). Combinations of C14-PEG2000, cKK-E12, and SLS in different concentrations were tested to afford the optimized formulation B-11 (patterned column).
Figure 2
Figure 2
(A) Representative image of the biodistribution of luciferase expression using the B-11 formulation 24 h after subcutaneous injection. The inguinal and axillary lymph nodes emit light 24 h after injection. Importantly, no FFL expression is detected in the liver, kidney, spleen, colon, or lung. A sample set of mouse organs are analyzed 15 min after the injection of D-lucifein. (B) FFL encoding mRNA, formulated in different LNP formulations, unformulated (FFL) mRNA, and formulated irrelevant mRNA, were injected subcutaneously in the lower backs of mice. The FFL expression was visualized 24 h after injection by optical imaging. (C) Quantitative expression of FFL during 12 days. The formulation of mRNA in LNPs increases the FFL expression up to 3 orders of magnitude compared to unformulated mRNA. The FFL expression remains elevated for 10 days. Interestingly, the formulation yielding the highest CD8 T cell levels at day 7 does not exhibit a higher peak FFL expression but exhibits a slower decrease over time. The corresponding antigen specific CD8 T cell levels at day 7 post injection using mRNA coding for ovalbumin (OVA, 10 μg per mouse, n = 5 per group) are 1.1 ± 1.3% for Formulation A-1, 3.1 ± 1.6% for Formulation A-6, and 4.2 ± 1.5% for Formulation B-11. (D) Quantification of the percentage of transfected cells of the indicated type 2 days after the injection of LNPs containing mRNA coding for Cre-recombinase in Ai14D reporter mice, as determined by FACS analysis (n = 3 for control, and n = 4 for Cre LNP). *P < 0.05, **P < 0.01; unpaired student t test. The irrelevant control mRNA used in the figure corresponds to mRNA coding for OVA.
Figure 3
Figure 3
C57Bl/6 mice (n = 7) were immunized with mRNA LNPs (10 μg mRNA per mouse in 100 μL of PBS; the mRNA is either unmodified or completely substituted with 5-methylcytidine (5meC) and pseudouridine (ψ)), and subsequently, mice were bled at specific time points. The red blood cells were lysed, and the monocytes were stained with tetramer, live–dead stain, and CD4 and CD8 antibody conjugates. (A) Representative FACS profiles of mice treated with the indicated conditions. The CD8 T cell response in peripheral blood is much stronger from unmodified mRNA LNP vaccines. (B) The percentage of OVA specific CD8 T cells peaks at day 7 after subcutaneous injection. Compared to unmodified mRNA, the substitution with 5meC and ψ induces an immune response only slightly higher that in the group treated with irrelevant control mRNA LNPs. mRNA coding for β-galactosidase was used as the irrelevant control (** P < 0.01 by the ordinary one-way ANOVA Bonferroni’s multiple comparisons test). (C) No significant increase in circulating antigen specific CD 4 T cells could be detected. (D) mRNA LNP formulation B-11 induces potent in vivo antitumor immunity. Mice (C57BL/6J, n = 10 for the control group and n = 5 for the treated mice) were injected subcutaneously in the upper back with 1 × 10⁵ B16-OVA melanoma cells on day 0. Treatment began when tumors were clearly visible in all mice (day 3) with LNP formulation B-11 containing OVA mRNA either modified or unmodified (days 3, 6, and 10, 10 μg of total mRNA per mouse and injection). Both treatment groups slow down tumor growth after the second treatment and shrink the tumor after the third treatment. Mice that reached the maximal allowed tumor area of 250 mm2, or that developed ulceration, were euthanized and recorded as having tumor areas of 250 mm2 (**P < 0.01, ***P < 0.001, as compared with the untreated control group, two-way ANOVA with Bonferroni posthoc). (E) Overall survival is increased for both treatment groups. Statistical analysis was done using a log rank analysis (***P < 0.001, as compared with the untreated control group, Mantel Cox test. The two mRNA treated groups are not significantly different). (F) The percentage of SIINFEKL specific CD 8 T cells that were analyzed on day 17; the difference in CD 8 T cells was not statistically significant.
Figure 4
Figure 4
mRNA LNPs coding for tumor self-antigens, gp100 and TRP2, slow down tumor growth and extend overall survival. Mice (C57BL/6J, n = 7 for untreated control and n = 5 per other groups) were inoculated with 105 of B16F10 melanoma cells and treated began when tumors were visible in all mice on day 3. Treatment consisted of a subcutaneous injection of LNP formulation B-11 encapsulation the indicated mRNA (10 μg of total mRNA per mouse in 0.1 mL of sterile PBS). All of the treated mice receive six injections with 3-day intervals starting on day 3 after the tumor inoculation. The groups included six treatments with gp100, TRP2, irrelevant control mRNA, three treatments with TRP2 followed by three treatments with gp100, and an untreated control group. (A) Tumor areas were measured with a caliper lengths × width. Mice that reached the maximal allowed tumor area of 250 mm2, or that developed ulceration, were euthanized and recorded as having tumor areas of 250 mm2. All three treatment groups showed slower tumor growths (**P < 0.01, ***P < 0.001, as compared with either control group, two-way ANOVA with Bonferroni posthoc). (B) All three treated groups survived significantly longer the either the untreated control group or mice treated with irrelevant mRNA. One mouse in the group treated three times with TRP2 mRNA containing LNPs, followed by three treatments of gp100 mRNA containing LNPs, survived 60 days (the end of the study) without visible tumors. (*P < 0.05, **P < 0.01, as compared with the untreated control group, Mantel Cox test). LNPs containing mRNA coding for OVA were used as irrelevant controls to generate the figure.
Figure 5
Figure 5
Incorporating LPS in the LNPs increases both the CD 8 T cell levels and antitumor activity. LNPs were formulated at the same lipid ratio as formulation B-11, but 1 mol percent of PEG was replaced with 1 mol percent of LPS. (A) Left: LNPs containing 1.0 μg of LPS per dose, formulated with OVA mRNA, increase the CD8 T cell levels 8 days after the immunization. Right: Representative FACS profiles day 8 (*P < 0.05 by ordinary one-way ANOVA Bonferroni’s multiple comparisons test). (B) In the B16 F10 tumor model, LPS containing LNPs, formulated with TRP2 mRNA, induce tumor shrinkage as compared to the slower tumor growth by TRP2 mRNA formulated in the B-11 formulation (***P < 0.001, ****P < 0.0001, as compared with the B-11 irrelevant mRNA LPS group, two-way ANOVA with Bonferroni posthoc). (C) The LPS containing LNPs lead to longer overall survival (* P < 0.05, ** P < 0.01, as compared with the untreated control group, Mantel Cox test). β-Galactosidase mRNA was used as the irrelevant control for the studies reported in the figure.

References

    1. Dunn GP, Old LJ, Schreiber RD. Annu Rev Immunol. 2004;22:329–360. - PubMed
    1. Sharma P, Allison JR. Science. 2015;348:56–61. - PubMed
    1. Rosenberg SA, Restifo NP. Science. 2015;348:62–68. - PMC - PubMed
    1. Palucka AK, Coussens LM. Cell. 2016;164:1233–1247. - PMC - PubMed
    1. Butterfield LH. BMJ. 2015;350:h988. - PMC - PubMed

Publication types

MeSH terms