. 2018 Feb;38(2):347-359.
doi: 10.1177/0271678X17695291. Epub 2017 Feb 24.

Neurochemical responses to chromatic and achromatic stimuli in the human visual cortex

Affiliations

Neurochemical responses to chromatic and achromatic stimuli in the human visual cortex

Petr Bednařík et al. J Cereb Blood Flow Metab. 2018 Feb.

Abstract

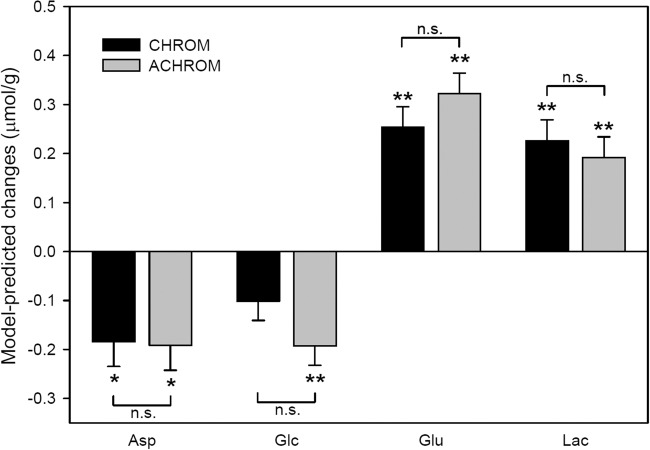
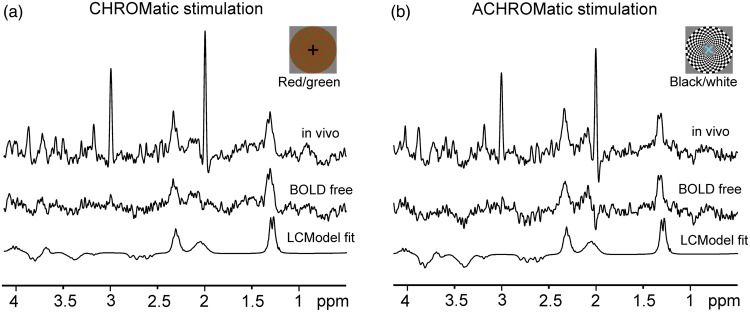
In the present study, we aimed at determining the metabolic responses of the human visual cortex during the presentation of chromatic and achromatic stimuli, known to preferentially activate two separate clusters of neuronal populations (called "blobs" and "interblobs") with distinct sensitivity to color or luminance features. Since blobs and interblobs have different cytochrome-oxidase (COX) content and micro-vascularization level (i.e., different capacities for glucose oxidation), different functional metabolic responses during chromatic vs. achromatic stimuli may be expected. The stimuli were optimized to evoke a similar load of neuronal activation as measured by the bold oxygenation level dependent (BOLD) contrast. Metabolic responses were assessed using functional 1H MRS at 7 T in 12 subjects. During both chromatic and achromatic stimuli, we observed the typical increases in glutamate and lactate concentration, and decreases in aspartate and glucose concentration, that are indicative of increased glucose oxidation. However, within the detection sensitivity limits, we did not observe any difference between metabolic responses elicited by chromatic and achromatic stimuli. We conclude that the higher energy demands of activated blobs and interblobs are supported by similar increases in oxidative metabolism despite the different capacities of these neuronal populations.

Keywords: MR spectroscopy; energy metabolism; functional MRI; glutamate; lactate.


Figures

Figure 1.
Figure 1.
Schematic diagram of the fMRS visual stimulation paradigm. Each subject participated in two sessions with an opposite order of chromatic (CHROM) and achromatic (ACHROM) stimuli. To assess differences between the steady-state metabolite concentrations, only fMRS data acquired during the second halves of the stimulation and rest periods were used (TR = 5 s, number of scans = 32). Concentration differences were assessed between the stimulation (CHROM or ACHROM) and the subsequent REST period.
Figure 2.
Figure 2.
Comparison of BOLD-fMRI signals evoked by chromatic (CHROM) and achromatic (ACHROM) stimulations. The between-session (within subject) averages of BOLD-fMRI amplitude (a) and BOLD-fMRI fraction of activated voxels (b) were averaged across the volume selected for fMRS. Pearson’s correlation coefficient R and corresponding p-values are reported, the dashed lines indicate lines of identity.
Figure 3.
Figure 3.
Representative 1H MR spectra acquired in one fMRS session during four periods, CHROM and subsequent REST (a), ACHROM and subsequent REST (b) (see Figure 1). These 1H MR spectra illustrate the spectral quality routinely achieved in this study (semi-LASER, TE = 26 ms, TR = 5 s, number of scans = 32, VOI = 2 × 2 × 2 cm3). Top traces show the difference spectra (STIM – REST). The residual peaks at 2 and 3 ppm originate from the linewidth difference between STIM and REST spectra. Small concentration changes of lactate (1.3 ppm) and glutamate (∼2.4 ppm) are also discernible in the difference spectra. Gaussian apodization was used for display purposes (σ = 0.17 s) Insets: MPRAGE images with overlaid fMRI maps show the position of the VOI selected for fMRS.
Figure 4.
Figure 4.
Model-predicted effect of stimulations at steady state, quantified from the visual cortex for four different conditions of the visual stimulation paradigm. Error bars indicate SEM. Significance levels for changes from rest (FDR-corrected p-values from the linear mixed models, n = 12 for all metabolites except for Glc where n = 10) were *p < 0.006, **p < 0.0006. No significant difference was observed between changes induced by CHROM and ACHROM stimulations.
Figure 5.
Figure 5.
LCModel analysis of the difference spectra for chromatic (a) and achromatic (b) stimulations. The difference spectra were generated by summing all corresponding fMRS data from 12 subjects and both sessions. The differences between spectra acquired during STIM (CHROM or ACHROM) and subsequent REST condition (see Figure 1) are shown in upper traces. The narrow peaks at 2 and 3 ppm originate from linewidth difference between STIM and REST spectra. BOLD free difference spectra (middle traces) were generated by subtracting REST from STIM spectra after linewidth matching. Bottom traces represent the LCModel fits of the BOLD free difference spectra. Gaussian multiplication (σ = 0.1) was applied on “in vivo” and “BOLD free” spectra only for a display purpose.

References

    1. Horton JC, Hedley-Whyte ET. Mapping of cytochrome oxidase patches and ocular dominance columns in human visual cortex. Philos Trans R Soc Lond B Biol Sci 1984; 304: 255–272. - PubMed
    1. Wong-Riley MT. Cytochrome oxidase: An endogenous metabolic marker for neuronal activity. Trends Neurosci 1989; 12: 94–101. - PubMed
    1. Zheng D, LaMantia AS, Purves D. Specialized vascularization of the primate visual cortex. J Neurosci 1991; 11: 2622–2629. - PMC - PubMed
    1. Keller AL, Schuz A, Logothetis NK, et al. Vascularization of cytochrome oxidase-rich blobs in the primary visual cortex of squirrel and macaque monkeys. J Neurosci 2011; 31: 1246–1253. - PMC - PubMed
    1. Borowsky IW, Collins RC. Metabolic anatomy of brain: A comparison of regional capillary density, glucose metabolism, and enzyme activities. J Comp Neurol 1989; 288: 401–413. - PubMed

Publication types

LinkOut - more resources