. 2017 Jun;37(6):2237-2248.
doi: 10.1177/0271678X17694187. Epub 2017 Jan 1.

A theoretical framework for determining cerebral vascular function and heterogeneity from dynamic susceptibility contrast MRI

Affiliations

A theoretical framework for determining cerebral vascular function and heterogeneity from dynamic susceptibility contrast MRI

Ingrid Digernes et al. J Cereb Blood Flow Metab. 2017 Jun.

Abstract

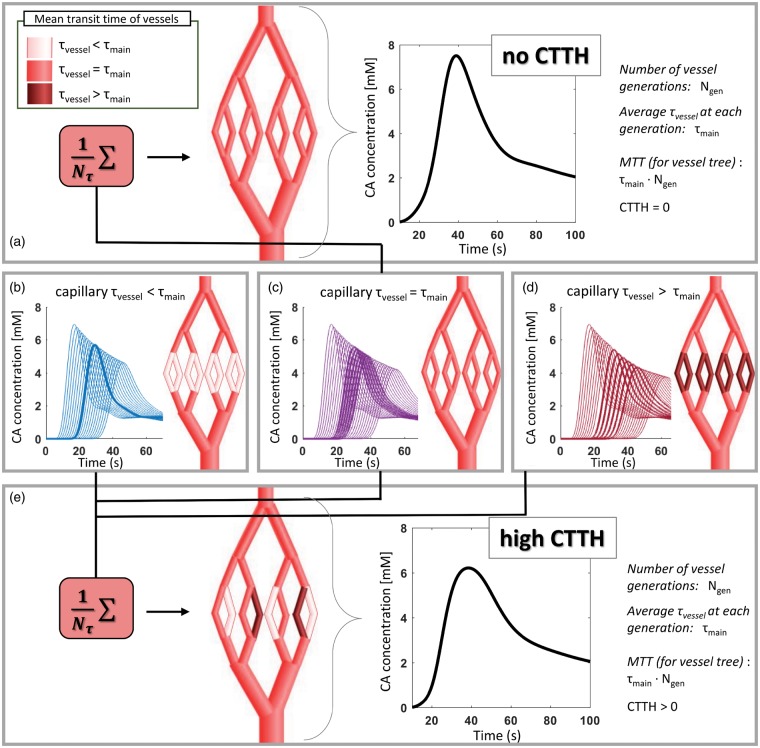
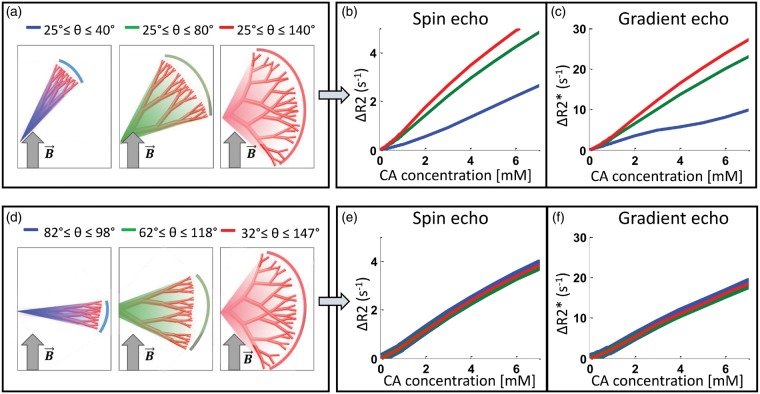
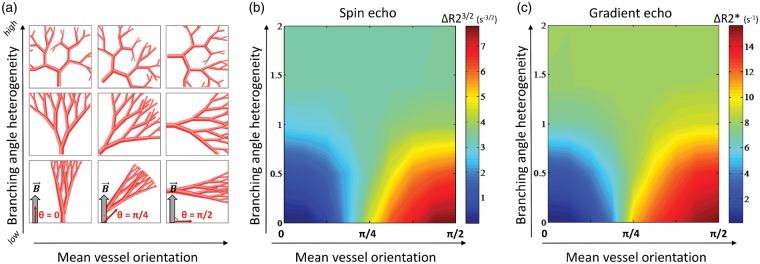
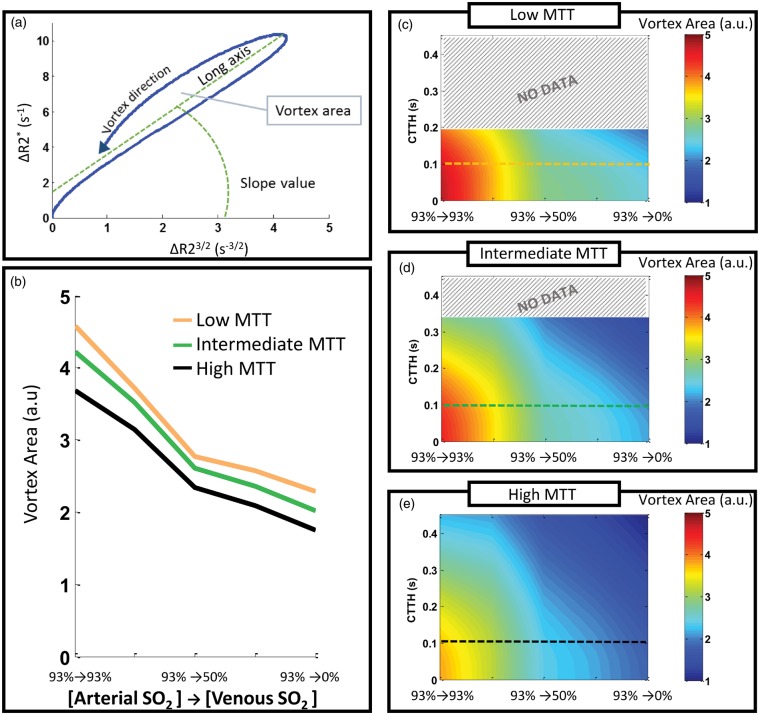
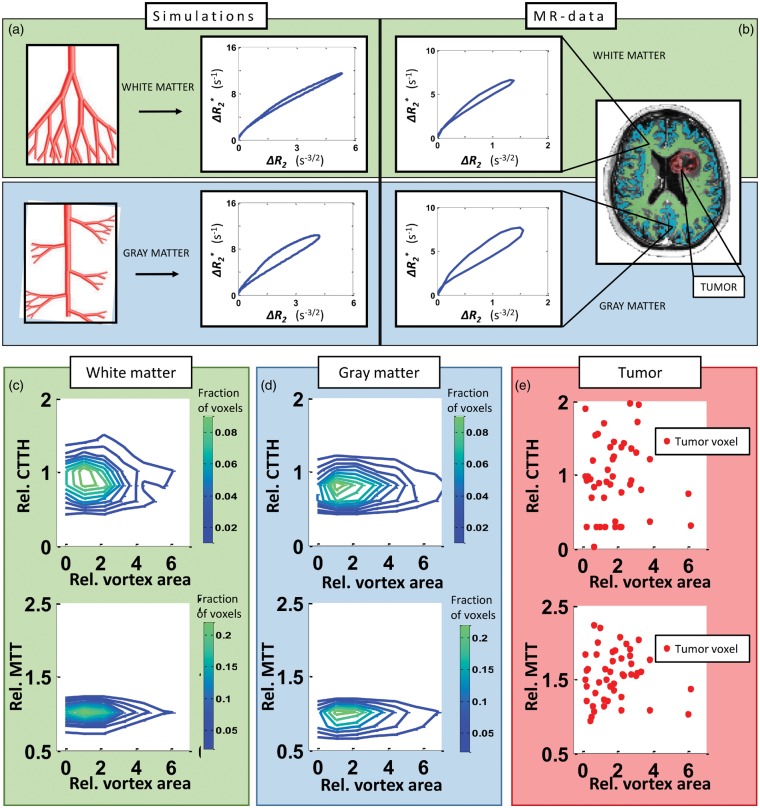
Mapping the complex heterogeneity of vascular tissue in the brain is important for understanding cerebrovascular disease. In this translational study, we build on previous work using vessel architectural imaging (VAI) and present a theoretical framework for determining cerebral vascular function and heterogeneity from dynamic susceptibility contrast magnetic resonance imaging (MRI). Our tissue model covers realistic structural architectures for vessel branching and orientations, as well as a range of hemodynamic scenarios for blood flow, capillary transit times and oxygenation. In a typical image voxel, our findings show that the apparent MRI relaxation rates are independent of the mean vessel orientation and that the vortex area, a VAI-based parameter, is determined by the relative oxygen saturation level and the vessel branching of the tissue. Finally, in both simulated and patient data, we show that the relative distributions of the vortex area parameter as a function of capillary transit times show unique characteristics in normal-appearing white and gray matter tissue, whereas tumour-voxels in comparison display a heterogeneous distribution. Collectively, our study presents a comprehensive framework that may serve as a roadmap for in vivo and per-voxel determination of vascular status and heterogeneity in cerebral tissue.

Keywords: DSC-MRI; glioma; tumour heterogeneity; vascular modelling; vessel architectural imaging.


Figures

Figure 1.
Figure 1.
Schematic representation of implementation of CTTH into the vascular model. To obtain a simulated vessel network with CTTH = 0 (top panel (a)), all vessels in the vessel tree have the same mean transit time (τvessel=τmain), indicated by the same shade of red in the illustrated vessel tree. The resulting concentration time curve for the whole vessel tree is shown in the graph. To obtain CTTH > 0, several vessel trees are generated where τvessel in arteries and veins remain constant at τmain, whereas τvessel on the capillary levels becomes shorter (shown in light red in (b)) or longer (shown in dark red in (d)) compared to τmain. The corresponding concentration time curves for each vessel generation are shown in (b) to (d), where the curves from capillary generations are highlighted with thicker lines. Note that the graphs in (b) to (d) display concentration time curves from vessel trees with Ngen=26 vessel generations, whereas the illustrated vessel trees contain only Ngen = 8. The vessel trees are then combined with equal weight (=1/Nτ, where Nτ is number of vessel trees with different capillary τvessel, here shown for Nτ = 3), as shown in bottom panel (e). The concentration time curve for the resulting vessel tree with high CTTH is shown in the graph (bottom right), where the peak of the curve is wider and lower compared to that of the concentration time curve with no CTTH. Note that the concentration time-curves in (a) and (e) is for illustration only and not used in the simulation as such, as the signal response for each vessel generation is calculated before they are combined.
Figure 2.
Figure 2.
The effects of vessel orientation distribution on the concentration dependence of the relaxation rates. When vessel orientations are randomly chosen within an interval with minimum angle set to 25° (a) both ΔR2 and ΔR2* increases with branching angle heterogeneity (b,c). However, if the mean vessel orientation is set perpendicular to the main magnetic field (d), the relaxation rates become independent of branching angle heterogeneity (e,f).
Figure 3.
Figure 3.
The effects of vessel orientation distributions on the relaxation rates. Illustrations of white matter-like vessel trees (a) with increasing mean vessel orientation relative to the main magnetic field (left to right) and increasing branching angle heterogeneity (bottom to top). The resulting relaxation rates from spin echo (b) and gradient echo (c) are independent of mean vessel orientation when branching angle heterogeneity is high (σ > 1). With lower branching angle heterogeneity (σ < 1), the relaxation rates increase when mean vessel orientation approaches π/2.
Figure 4.
Figure 4.
Vortex area for varying CTTH, MTT and ΔSO2-levels. A parametric plot of the gradient echo and spin echo relaxation rate curves forms a vessel vortex curve and is characterized by the vortex direction, long axis, slope value and the vortex area (a). The vortex area decreases as the ΔSO2 increases (b) and can thus indicate the oxygenation status of the tissue. However, the vortex area is modified by the MTT and CTTH in the vessel system. The combined effects of CTTH and ΔSO2 on vortex area are shown for low MTT (c), intermediate MTT (d) and high MTT (e). Coloured lines in (c–e) correspond to the coloured lines in (b). Low CTTH and low MTT produces higher vortex area values than high CTTH and long MTT, and must be accounted for to obtain an accurate estimation of the SO2-level. No data for upper values of CTTH in (c) and (d), as maximum CTTH is dependent on MTT.
Figure 5.
Figure 5.
Vortex area-distribution in tissue types. (a) Simulations of vessel branching associated with white matter produces vortices with a relative small area (top row), compared to vessel branching mimicking gray matter, which gives vortices with a larger area (bottom row). The same GM to WM ratio of the vortex area is found in patient data. (b) A typical vortex from a white matter-voxel (top row) and from a gray matter-voxel (bottom row) is shown. WM- and GM-voxels are identified from maps as shown in MR-image (right) generated from Look-Locker acquisitions. Distribution of relative CTTH-values (top row) and relative MTT-values (bottom row) across relative vortex area in white matter (c), gray matter (d) and tumour (e) in voxels with relative CBV-values from 1.6 to 2.0, in a glioblastoma patient. Green (blue) contour lines denote higher (lower) fraction of voxels. Red dots correspond to single voxels in tumour region identified from contrast enhanced T1-weighted MRI.
None

References

    1. Viallon M, Cuvinciuc V, Delattre B, et al. State-of-the-art MRI techniques in neuroradiology: principles, pitfalls, and clinical applications. Neuroradiology 2015; 57: 441–467. - PubMed
    1. Covarrubias DJ, Rosen BR, Lev MH. Dynamic magnetic resonance perfusion imaging of brain tumors. Oncologist 2004; 9: 528–537. - PubMed
    1. Weisskoff RM, Zuo CS, Boxerman JL, et al. Microscopic susceptibility variation and transverse relaxation: theory and experiment. Magn Reson Med 1994; 31: 601–610. - PubMed
    1. Tropres I, Grimault S, Vaeth A, et al. Vessel size imaging. Magn Reson Med 2001; 45: 397–408. - PubMed
    1. Kiselev VG, Strecker R, Ziyeh S, et al. Vessel size imaging in humans. Magn Reson Med 2005; 53: 553–563. - PubMed