. 2017 Dec;37(12):3683-3694.
doi: 10.1177/0271678X17697340. Epub 2017 Mar 1.

Region-specific permeability of the blood-brain barrier upon pericyte loss

Affiliations

Region-specific permeability of the blood-brain barrier upon pericyte loss

Roberto Villaseñor et al. J Cereb Blood Flow Metab. 2017 Dec.

Abstract

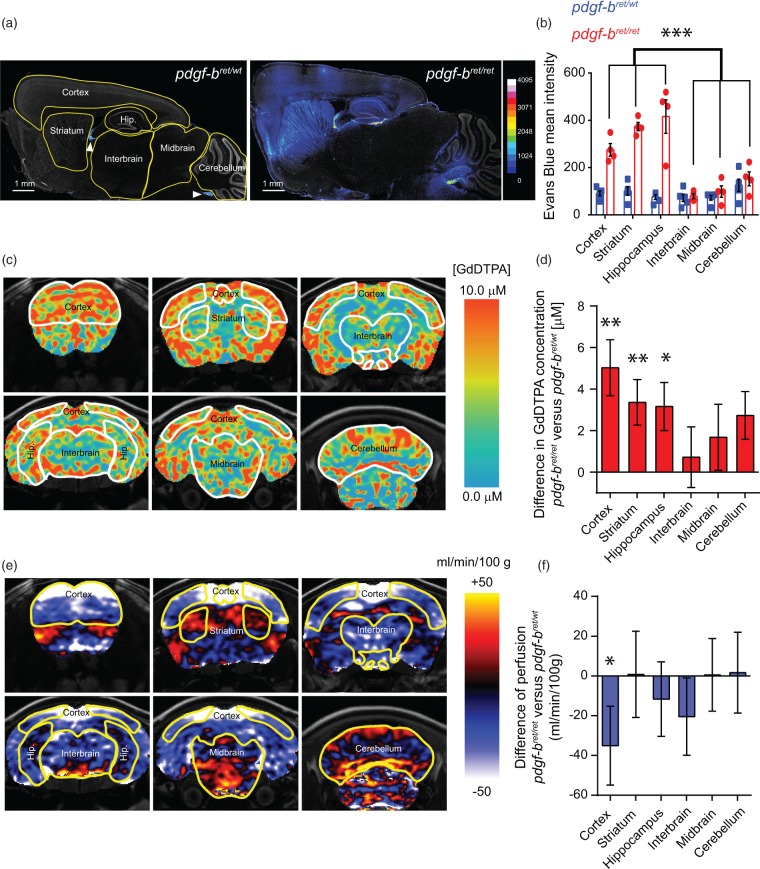
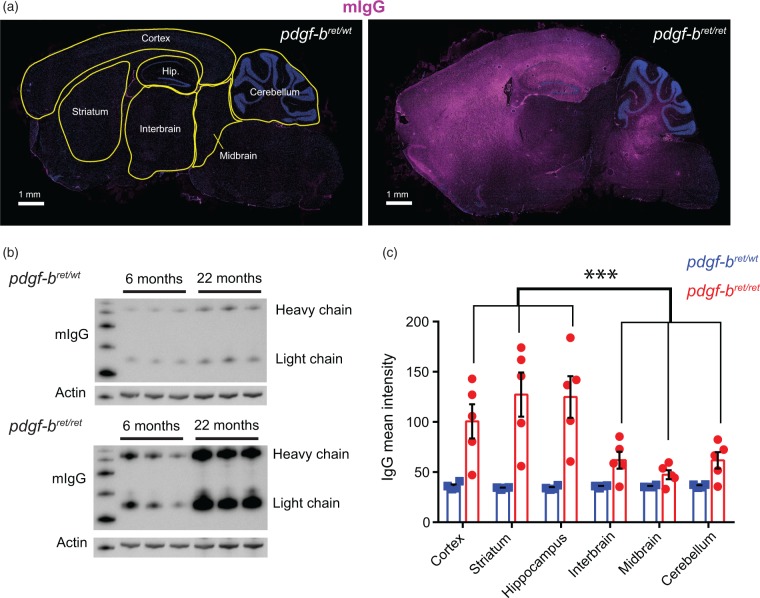
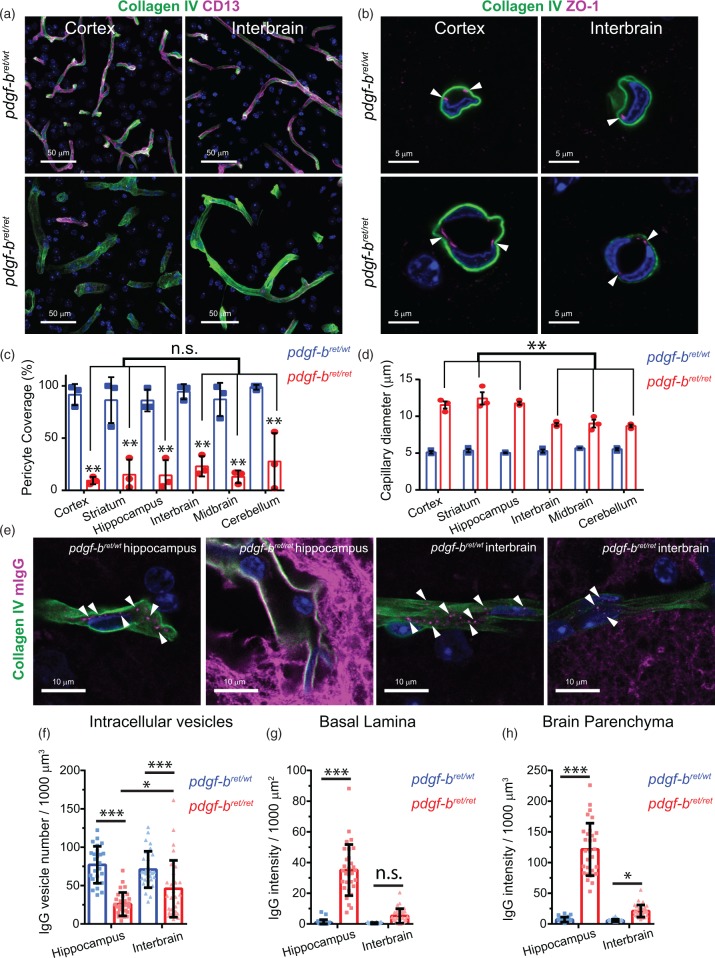
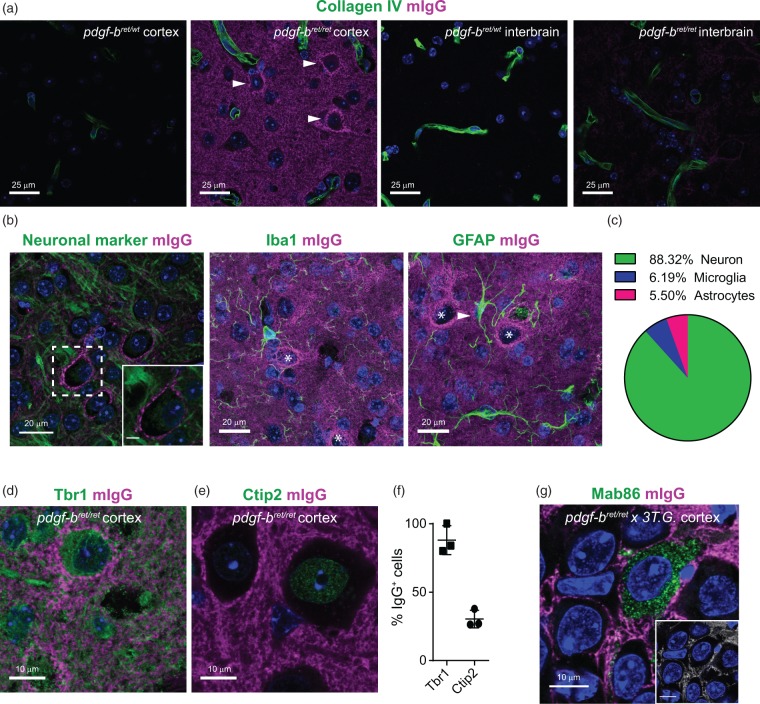
The blood-brain barrier (BBB) regulates differing needs of the various brain regions by controlling transport of blood-borne components from the neurovascular circulation into the brain parenchyma. The mechanisms underlying region-specific transport across the BBB are not completely understood. Previous work showed that pericytes are key regulators of BBB function. Here we investigated whether pericytes influence BBB permeability in a region-specific manner by analysing the regional permeability of the BBB in the pdgf-b ret/ret mouse model of pericyte depletion. We show that BBB permeability is heterogeneous in pdgf-b ret/ret mice, being significantly higher in the cortex, striatum and hippocampus compared to the interbrain and midbrain. However, we show that this regional heterogeneity in BBB permeability is not explained by local differences in pericyte coverage. Region-specific differences in permeability were not associated with disruption of tight junctions but may result from changes in transcytosis across brain endothelial cells. Our data show that certain brain regions are able to maintain low BBB permeability despite substantial pericyte loss and suggest that additional, locally-acting mechanisms may contribute to control of transport.

Keywords: Blood–brain barrier; extravasation; neurovascular unit; pericytes; permeability.


Figures

Figure 1.
Figure 1.
Regional heterogeneity of blood–brain barrier permeability upon pericyte depletion. (a) Representative mosaic images of increased Evans Blue accumulation in pdgf-bret/wt and pdgf-bret/ret mice. The segmentation of brain regions used for subsequent quantification is shown in yellow. Evans Blue fluorescent signal is displayed with a 16-color scheme using the full dynamic range of the 12-bit images. DAPI-stained nuclei are shown in grey. Arrowheads point to the choroid plexus and meninges. (b) Quantification of Evans Blue mean intensity from whole-brain sections of pdgf-bret/wt (blue) or pdgf-bret/ret (red) mice as shown in (a). Points show individual sections from 5 pdgf-bret/wt and 4 pdgf-bret/ret mice, bars show the mean and error bars show S.E.M. ***, p < 0.0001 by repeated measures two-way ANOVA and pair-wise comparisons between different brain regions of pdgf-bret/ret mice with Fisher's LSD test. (c) MRI group images of selected coronal sections displaying the mean difference of Gd-DTPA accumulation in the brains of pdgf-bret/ret mice versus pdgf-bret/wt mice as a proxy for BBB extravasation. Gd-DTPA accumulation was evaluated in vivo based on changes in tissue relaxivity as measured by non-invasive MRI and is color-coded according to the scale shown to the right. (d) Quantification of the mean difference of Gd-DTPA accumulation in selected brain regions of pdgf-bret/ret mice versus pdgf-bret/wt mice. Bars show the mean value estimated from 14 pdgf-bret/ret mice and 17 pdgf-bret/wt mice. Error bars show SEM. **p < 0.009, *p < 0.05 from ANOVA and Welch's t-test. (e) Selected coronal sections displaying the mean difference in cerebral blood perfusion between 12 month old pdgf-bret/ret mice and pdgf-bret/wt mice. The values were estimated from perfusion MRI and are displayed using the color scheme shown to the right. (f) Quantification of the mean difference in cerebral blood perfusion in pdgf-bret/ret versus pdgf-bret/wt in the same brain regions measured in (c). Bars show the mean value estimated from 8 pdgf-bret/ret mice and 8 pdgf-bret/wt mice. Error bars show SEM. *p = 0.05 from ANOVA (corrected for a FDR = 0.15) and Welch's t-test.
Figure 2.
Figure 2.
Regional differences in the accumulation of endogenous mouse immunoglobulins upon pericyte depletion. (a) Representative mosaic images of whole-brain sections of 12 month old pdgf-bret/wt or pdgf-bret/ret mice. The segmentation of brain regions used for subsequent quantification is shown in yellow. Endogenous mIgG is shown in magenta, DAPI-stained nuclei are shown in blue. Scale bar, 1 mm. (b) Western Blot against mouse IgG of whole-brain lysates from pdgf-bret/wt (upper panel) or pdgf-bret/ret (lower panel) mice at 6 or 22 months of age. Actin is shown as a loading control. (c) Quantification of IgG mean intensity from whole-brain sections of 12 month old pdgf-bret/wt (blue) or pdgf-bret/ret (red) mice as shown in (a). Points show individual sections from 5 mice, bars show the mean and error bars show S.E.M. ***, p < 0.0001 by repeated measures two-way ANOVA and pairwise comparisons between different brain regions of pdgf-bret/ret mice using Fisher's LSD test.
Figure 3.
Figure 3.
Changes to the neurovascular unit upon pericyte loss. (a) Representative images of capillaries (marked by CollagenIV, green) covered by pericytes (marked by CD13, magenta) in the cortex and interbrain of 19 months old pdgf-bret/wt (upper panels) or pdgf-bret/ret (lower panels) mice. The images show a 3D reconstruction of the imaged tissue volume after background subtraction using a Collagen IV intensity mask. Scale bar, 50 µm. (b) Representative cross-sections of capillaries marked by Collagen IV (green) and the tight junctional marker ZO-1 (magenta) in the cortex and interbrain of 19 months old pdgf-bret/wt (upper panels) or pdgf-bret/ret (lower panels) mice. Arrowheads point to the localization of tight junctions in these capillaries. Scale bar = 5 µm. (c) Estimation of pericyte coverage in different brain regions quantified as the percentage of the total CollagenIV area covered by CD13. Points show mean coverage values for individual mice, bars show the mean and error bars show S.E.M. for three mice. **p < 0.0001 by repeated measures two-way ANOVA and pairwise comparison between the same brain region in pdgf-bret/wt or pdgf-bret/ret mice using Fisher's LSD test. (d) Measurement of capillary cross-section diameter in different brain regions. Points show mean capillary diameter values for individual mice, bars show the mean and error bars show S.E.M. for three mice. **p < 0.0001 by repeated measures two-way ANOVA and pairwise comparison between different brain regions of pdgf-bret/ret mice using Fisher's LSD test. (e) Representative high-resolution single optical sections of the hippocampus and interbrain of pdgf-bret/wt and pdgf-bret/ret mice showing a single capillary marked with collagenIV (green) and the distribution of mIgG (magenta) within intracellular vesicles, the basal lamina or the brain parenchyma. Arrowheads point to individual intracellular vesicles within capillaries. Scale bar = 10 µm. In all images, nuclei are labelled with DAPI (blue). (f–h) Quantification of the number of mIgG-positive intracellular vesicles (f) and the total mIgG intensity in the basal lamina (g) and the brain parenchyma (h). Points represent individual capillaries. Bars show the mean and error bars the S.D. of 30 individual capillaries from three different mice. *p < 0.05; **p < 0.001; ***p < 0.0001 by Fisher's LSD test.
Figure 4.
Figure 4.
Accumulation of endogenous mouse immunoglobulins in a specific subpopulation of cortical neurons. (a) Representative images of the cortex or interbrain of 19 months old pdgf-bret/wt or pdgf-bret/ret mice. Capillaries are marked by CollagenIV in green and mIgG in magenta. Arrowheads point to the distinct accumulation of mIgG signal in the periphery of a subpopulation of cells in the cortex of pdgf-bret/ret mice. The signal in the interbrain of pdgf-bret/ret mice was below our detection limit with these imaging settings. Scale bar = 25 µm. (b) Representative images of mIgG distribution in the brain parenchyma and in the periphery of a cell positive for a general pan-neuronal marker (Neuro-chrom, green) but not in the periphery of microglia (Iba1, green) or astrocytes (GFAP, green). Scale bar = 20 µm. The inset is a zoom-in to the cell body to highlight the distribution of mIgG at the membrane. Stars indicate cells accumulating mIgG, arrowhead indicates accumulation of mIgG on an astrocytic process. Scale bar = 5 µm. (c) Pie-chart displaying the fractions of cell-types accumulating mIgG on their membranes. (d–e) Representative images of mIgG accumulation in the periphery of Tbr1+ (d) but not in Ctip2+ (e) neurons in the cortex of pdgf-bret/ret mice. In both panels, neuronal markers are shown in green. (f) Quantification of the fraction of cells accumulating mIgG in the periphery which are also positive for Tbr1 or Ctip2. Individual points show the average fraction of 10 areas in individual slices from 3 mice. Error bars show the S.E.M. In all images, DAPI-stained nuclei are shown in blue. (g) Representative image of parenchymal localization of mIgG (magenta) and intracellular localization of the monoclonal antibody Mab86 (green) in the hippocampus of pdgf-bret/ret crossed with the 3TG mouse model of Alzheimer's disease. The inset shows the colocalized pixels between the Mab86 and mIgG channels and highlights the lack of mIgG intracellular localization. Scale bar = 10 µm.

Comment in

References

    1. Chow BW, Gu C. The molecular constituents of the blood-brain barrier. Trends Neurosci 2015; 38: 598–608. - PMC - PubMed
    1. Zhao Z, Nelson AR, Betsholtz C, et al. Establishment and dysfunction of the blood-brain barrier. Cell 2015; 163: 1064–1078. - PMC - PubMed
    1. De Bock M, Van Haver V, Vandenbroucke RE, et al. Into rather unexplored terrain-transcellular transport across the blood-brain barrier. Glia 2016; 64: 1097–1123. - PubMed
    1. Preston JE, Joan Abbott N, Begley DJ. Transcytosis of macromolecules at the blood-brain barrier. Adv Pharmacol [Review] 2014; 71: 147–163. - PubMed
    1. Banks W, Kastin AJ, Jaspan JB. Regional variation in transport of pancreatic polypeptide across the blood-brain barrier of mice. Pharmacol BiochemBehav 1995; 51: 139–147. - PubMed

Substances

LinkOut - more resources