. 2017 Mar 9;18(1):160.
doi: 10.1186/s12859-017-1565-4.

Sparse Proteomics Analysis - a compressed sensing-based approach for feature selection and classification of high-dimensional proteomics mass spectrometry data

Affiliations

Sparse Proteomics Analysis - a compressed sensing-based approach for feature selection and classification of high-dimensional proteomics mass spectrometry data

Tim O F Conrad et al. BMC Bioinformatics. .

Abstract

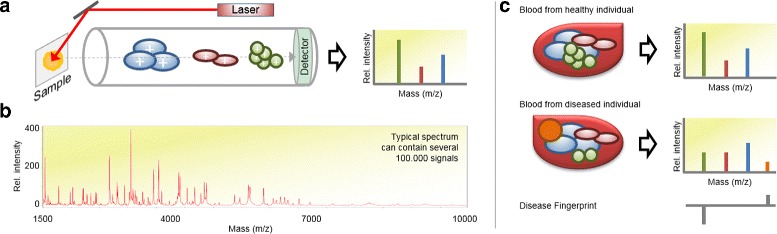
Background: High-throughput proteomics techniques, such as mass spectrometry (MS)-based approaches, produce very high-dimensional data-sets. In a clinical setting one is often interested in how mass spectra differ between patients of different classes, for example spectra from healthy patients vs. spectra from patients having a particular disease. Machine learning algorithms are needed to (a) identify these discriminating features and (b) classify unknown spectra based on this feature set. Since the acquired data is usually noisy, the algorithms should be robust against noise and outliers, while the identified feature set should be as small as possible.

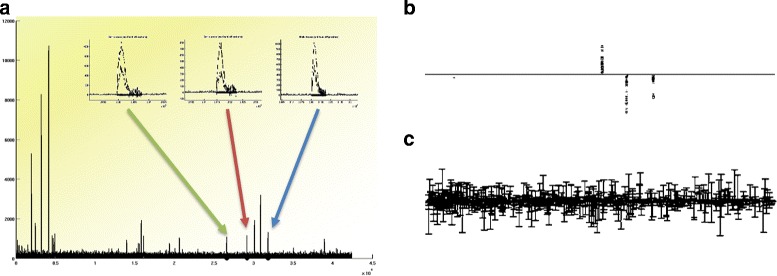
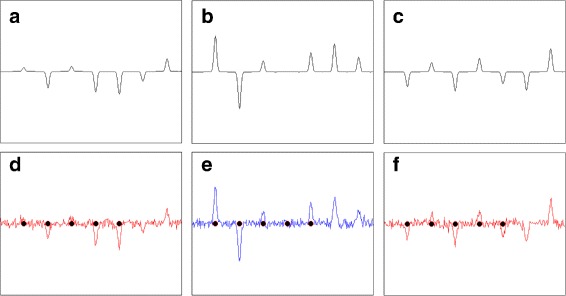
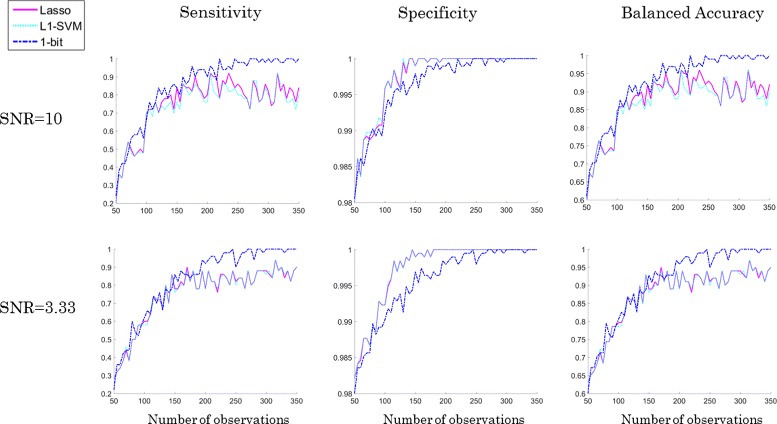
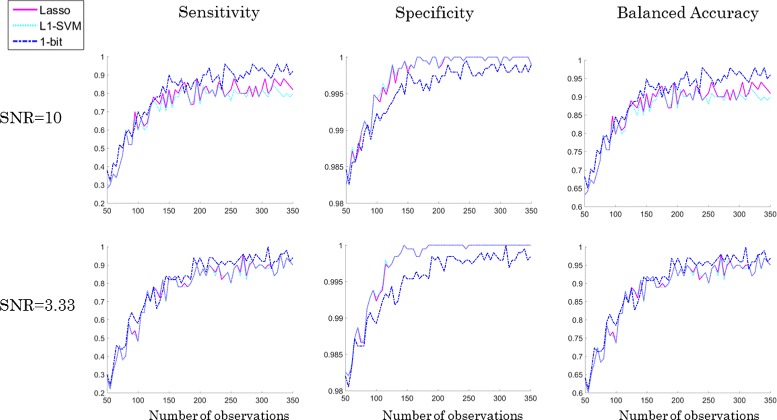
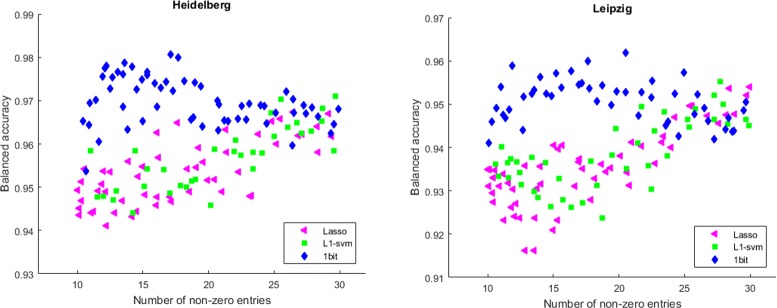
Results: We present a new algorithm, Sparse Proteomics Analysis (SPA), based on the theory of compressed sensing that allows us to identify a minimal discriminating set of features from mass spectrometry data-sets. We show (1) how our method performs on artificial and real-world data-sets, (2) that its performance is competitive with standard (and widely used) algorithms for analyzing proteomics data, and (3) that it is robust against random and systematic noise. We further demonstrate the applicability of our algorithm to two previously published clinical data-sets.

Keywords: Biomarker; Classification; Clinical data; Compressed sensing; Feature selection; Machine learning; Mass spectrometry; Proteomics; Sparsity.


Figures

Fig. 1
Fig. 1
a Schematic outline of a linear matrix-assisted laser desorption ionization (MALDI)–time-of-flight (TOF) mass spectrometer (MS). During the measurement process, the molecules of the examined sample are ionized, vaporized and finally analyzed by their respective time-of-flight through an electric field. This process generates a plot (mass spectrum) having mass-to-charge ratio (m/z) on the x-axis and intensity (ion count) on the y-axis. b Typical mass spectrum for a mass range of 1500–10.000 Dalton. c Example of a disease fingerprint, created by comparing mass spectra from a healthy and a diseased individual
Fig. 2
Fig. 2
a Overlaid spectra from two different groups. The three peaks marked by the arrows (magnified in the inlays) represent the underlying differences between the two groups. b Sparse ω found by a 1-regularized method ( 1-SVM). c ω found by 2-regularized method (classical SVM)
Fig. 3
Fig. 3
The red stripe indicates the support of ω^. Relevant features usually occur as intervals and not as isolated points
Fig. 4
Fig. 4
Illustration of the generated data instances. ac: First seven equidistant Gaussian peaks that are located in fixed positions in each of the three data instances; df: Visualization of the data instances from (a)–(c) with additive noise with standard deviation σ=0.1, where the positions of the five condition positive peaks are highlighted by black dots. The blue and red colors indicate the different classes which are determined by the observation process of (11)
Fig. 5
Fig. 5
Comparison of numerical results for SPA (=1-bit CS), Lasso, and 1-SVM on the data-set DS1 with SNR = 10, and 3.33, showed in the respective row. Note that the data consist of 5 condition positive and 195 condition negative peaks which are equidistantly located in the spectra
Fig. 6
Fig. 6
Comparison of numerical results for SPA (=1-bit CS), Lasso, and 1-SVM on the data-set DS2 with SNR = 10 and 3.33 showed in the respective row
Fig. 7
Fig. 7
The height of true signals (6 spiked in peaks) comparing to the height of noise and height of the corresponding values in the pure data-set. Signal-to-noise ratio, which was calculated as the ratio of median of spiked-in signals and the estimated level of noise is shown above the corresponding peaks
Fig. 8
Fig. 8
Accuracies of sparse classifiers from SPA, Lasso, and 1-SVM on the real pancreatic cancer data-sets. While Lasso and 1-SVM achieve better classification accuracy with increasing number of features, SPA is particularly well suited for the “very-sparse regime” where only few features (<20) are used for classification

References

    1. Aebersold R, Mann M. Mass spectrometry-based proteomics. Nature. 2003;422(6928):198–207. doi: 10.1038/nature01511. - DOI - PubMed
    1. Petricoin EF, Belluco C, Araujo RP, Liotta LA. The blood peptidome: a higher dimension of information content for cancer biomarker discovery. Nat Rev Cancer. 2006;6(12):961–7. doi: 10.1038/nrc2011. - DOI - PubMed
    1. Rai AJ, Chan DW. Cancer proteomics: serum diagnostics for tumor marker discovery. Ann N Y Acad Sci. 2004;1022:286–94. doi: 10.1196/annals.1318.044. - DOI - PubMed
    1. Coombes KR, Morris JS, Hu J, Edmonson SR, Baggerly KA. Serum proteomics profiling–a young technology begins to mature. Nat Biotechnol. 2005;23(3):291–2. doi: 10.1038/nbt0305-291. - DOI - PubMed
    1. Liotta LA. Clinical proteomics: written in blood. Nature. 2003;425(6961):905. doi: 10.1038/425905a. - DOI - PubMed