. 2018 Jan 1:164:121-130.
doi: 10.1016/j.neuroimage.2017.03.005. Epub 2017 Mar 6.

Investigating the spatiotemporal characteristics of the deoxyhemoglobin-related and deoxyhemoglobin-unrelated functional hemodynamic response across cortical layers in awake marmosets

Affiliations

Investigating the spatiotemporal characteristics of the deoxyhemoglobin-related and deoxyhemoglobin-unrelated functional hemodynamic response across cortical layers in awake marmosets

Cecil Chern-Chyi Yen et al. Neuroimage. .

Abstract

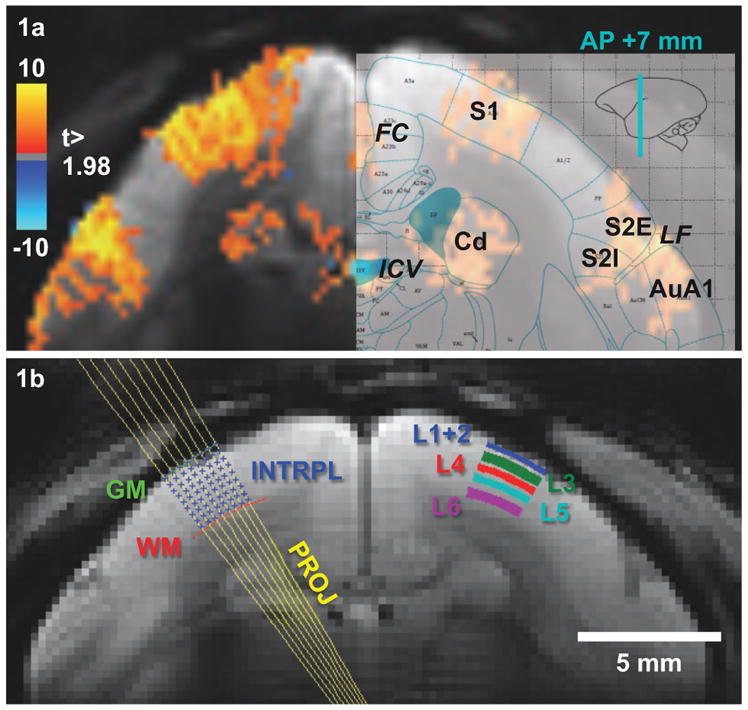
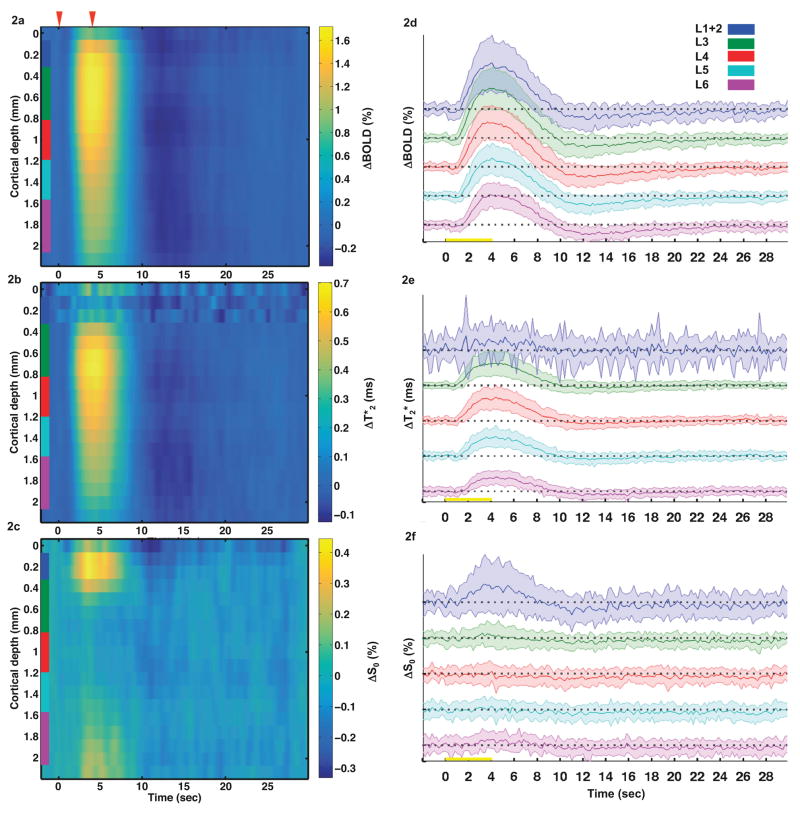
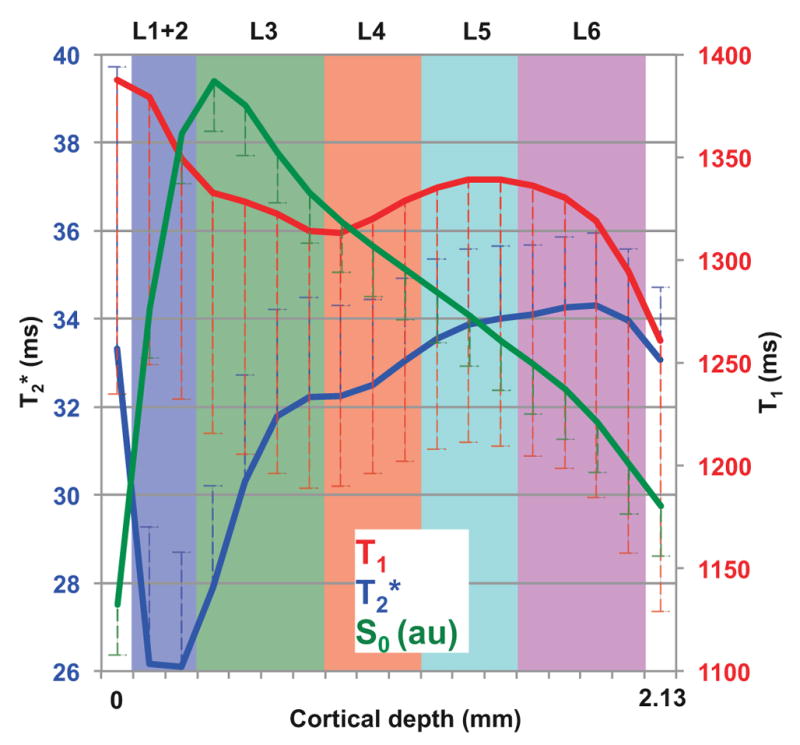
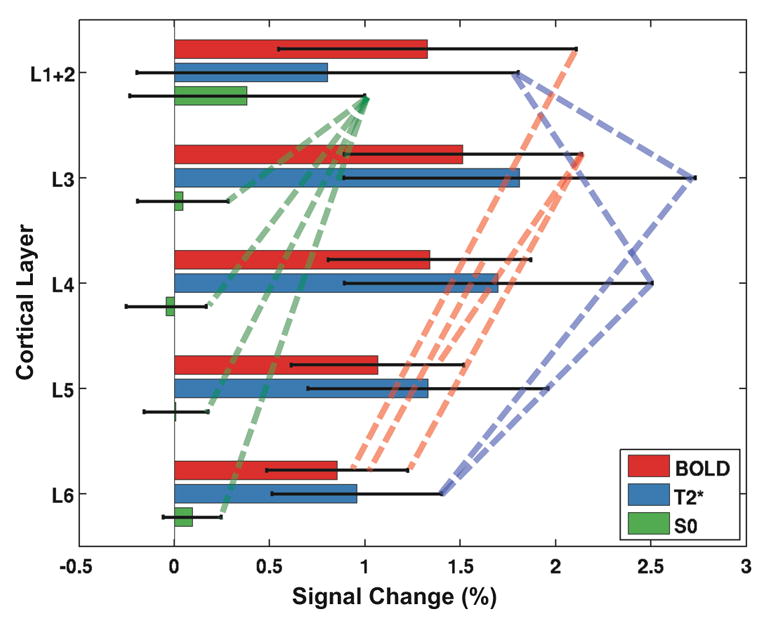
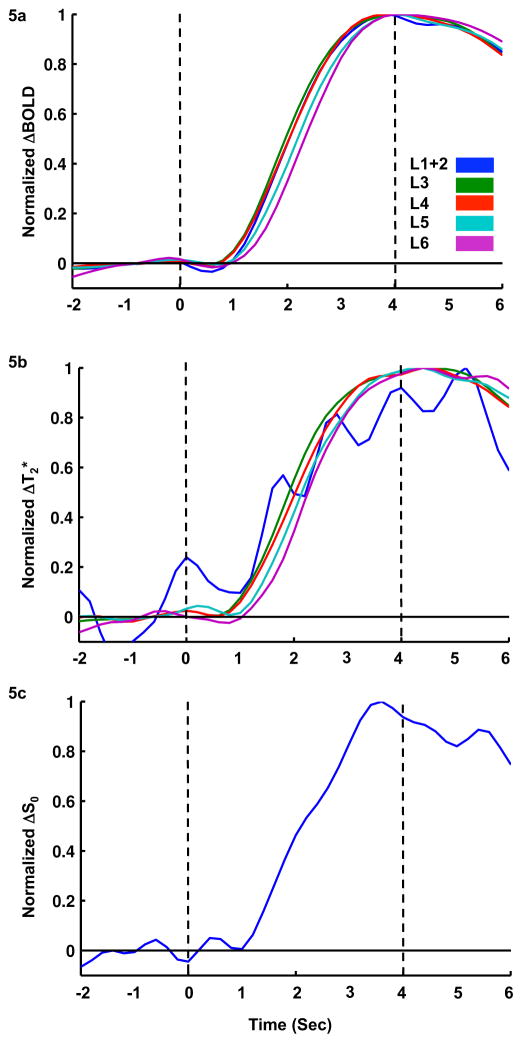
Blood oxygenation level dependent (BOLD) functional magnetic resonance imaging (fMRI) has become a major tool to map neural activity. However, the spatiotemporal characteristics of the BOLD functional hemodynamic response across the cortical layers remain poorly understood. While human fMRI studies suffer from low spatiotemporal resolution, the use of anesthesia in animal models introduces confounding factors. Additionally, inflow contributions to the fMRI signal become non-negligible when short repetition times (TRs) are used. In the present work, we mapped the BOLD fMRI response to somatosensory stimulation in awake marmosets. To address the above technical concerns, we used a dual-echo gradient-recalled echo planar imaging (GR-EPI) sequence to separate the deoxyhemoglobin-related response (absolute T2* differences) from the deoxyhemoglobin-unrelated response (relative S0 changes). We employed a spatial saturation pulse to saturate incoming arterial spins and reduce inflow effects. Functional GR-EPI images were obtained from a single coronal slice with two different echo times (13.5 and 40.5ms) and TR=0.2s. BOLD, T2*, and S0 images were calculated and their functional responses were detected in both hemispheres of primary somatosensory cortex, from which five laminar regions (L1+2, L3, L4, L5, and L6) were derived. The spatiotemporal distribution of the BOLD response across the cortical layers was heterogeneous, with the middle layers having the highest BOLD amplitudes and shortest onset times. ΔT2* also showed a similar trend. However, functional S0 changes were detected only in L1+2, with a fast onset time. Because inflow effects were minimized, the source of S0 functional changes in L1+2 could be attributed to a reduction of cerebrospinal fluid volume fraction due to the functional increase in cerebral blood volume and to unmodeled T2* changes in the extra- and intra-venous compartments. Caution should be exercised when interpreting laminar BOLD fMRI changes in superficial layers as surrogates of underlying neural activity.

Keywords: BOLD; Brain; Marmosets; Non-human primates; Onset times; Somatosensory cortex.


Figures

Fig. 1
Fig. 1
BOLD responses overlaid on the averaged EPI (TE = 27 ms) (a) and laminar segmentation (b) overlaid on the averaged EPI (TE = 13.5 ms) of one animal. (a) Robust BOLD responses were observed in S1, S2, and caudate of all animals. In addition, BOLD signals were seen in draining veins near FC and ICV as well as in AuA1. The slice position was determined from previous fMRI sessions and is located in AP +7 mm. (b) Gray and white matter boundaries were determined by second order polynomial fitting of manually defined white and gray matter edge points. Projection lines of each gray mater edge point were perpendicular to the gray matter boundary and bi-linear interpolated into 18 points (8 points shown here). Excluding 2 boundary points, 5 cortical layers were grouped from 16 interpolation points according to the histological layer definition. FC: falx cerebri, ICV: internal cerebral vein, Cd: caudate, LF: lateral fissure, S1: primary somatosensory cortex, S2E: external part of secondary somatosensory, S2I: internal part of secondary somatosensory, AuA1: primary auditory cortex, GM: gray matter boundary, WM: white matter boundary, INTRPL: interpolation points, PROJ: projection lines, L1 to L6: cortical layers 1 to 6.
Fig. 2
Fig. 2
Laminar profiles and time-courses of relative BOLD changes (a, d), T2* differences (b, e), and relative S0 changes (c, f) over a single 32 s-long epoch. The magnitude and the onset time of the BOLD change were highest and fastest in L3-L4. A similar trend was observed in the ΔT2* profile. On the other hand, S0 changes were only observed in L1+2. Red arrows or yellow bars indicate the stimulus onset at t = 0 s and stimulus offset at t = 4 s. Color scales represent minimum to maximum intensity for each laminar profile. Laminar segmentation: L1+2 = blue, L3 = green, L4 = red, L5 = cyan, L6 = purple. Shaded curves represent one standard deviation away from the averaged time-courses. The scale of the y-axis is percentage for ΔBOLD and ΔS0 and millisecond for ΔT2*, respectively.
Fig. 3
Fig. 3
Baseline laminar profiles for T2* (blue), T1app (red), and S0 (green). T2* was lowest in L1+2 and showed a small dent around upper L4. T1 was higher on superficial layers and showed a small dent at the same location as T2*. S0 increased sharply in the most superficial layers, peaked in the middle of L3, and decayed monotonically with the coil sensitivity profile along the cortical depth. The axis of S0 is not shown in the plot since S0 has arbitrary units. Error bars represent one standard deviation. Laminar segmentation: L1+2 = blue, L3 = green, L4 = red, L5 = cyan, L6 = purple.
Fig. 4
Fig. 4
Averaged BOLD (red), T2* (blue), and S0 (green) percentage signal changes across the five laminar regions of S1. Significant (t < 0.05) BOLD and T2* changes were detected in all five regions, whereas S0 was only significantly different from baseline in L1+2. Additionally, BOLD changes were significantly different for some non-contiguous layer pairs as shown by red dot lines. For T2*, significant differences were observed in L1+2 compared to its adjacent layers (L3 and L4), which were also distinct from L6. Error bars represent one standard deviation. Significantly different pairs (p < 0.05) are connected with dashed lines.
Fig. 5
Fig. 5
Peak-normalized laminar BOLD, T2*, and S0 time-courses. For laminar BOLD time-courses, the fastest onset times appeared in L3–L4, followed by L1+2, L5, and L6. For laminar T2* time-courses, the ranking from BOLD was somewhat preserved besides L1+2, which was highly fluctuated. At L1+2, the onset time became obvious only when unfiltered time-courses were fitted with HRF of three gamma density functions. For laminar S0 time-courses, only L1+2 was shown and analysis for onset time, because S0 changes were only significant at L1+2.

References

    1. Ahissar E, Staiger J. S1 laminar specialization. Scholarpedia. 2010;5:7457.
    1. Beissner F, Baudrexel S, Volz S, Deichmann R. Dual-echo EPI for non-equilibrium fMRI - implications of different echo combinations and masking procedures. Neuroimage. 2010;52:524–531. - PubMed
    1. Belcher AM, Yen CC, Stepp H, Gu H, Lu H, Yang Y, Silva AC, Stein EA. Large-scale brain networks in the awake, truly resting marmoset monkey. J Neurosci. 2013;33:16796–16804. - PMC - PubMed
    1. Bock NA, Kocharyan A, Liu JV, Silva AC. Visualizing the entire cortical myelination pattern in marmosets with magnetic resonance imaging. J Neurosci Methods. 2009;185:15–22. - PMC - PubMed
    1. Chen G, Wang F, Gore JC, Roe AW. Identification of cortical lamination in awake monkeys by high resolution magnetic resonance imaging. Neuroimage. 2012;59:3441–3449. - PMC - PubMed

Publication types