. 2017 Feb 15;31(4):383-398.
doi: 10.1101/gad.290379.116. Epub 2017 Mar 8.

Pancreatic α- and β-cellular clocks have distinct molecular properties and impact on islet hormone secretion and gene expression

Affiliations

Pancreatic α- and β-cellular clocks have distinct molecular properties and impact on islet hormone secretion and gene expression

Volodymyr Petrenko et al. Genes Dev. .

Abstract

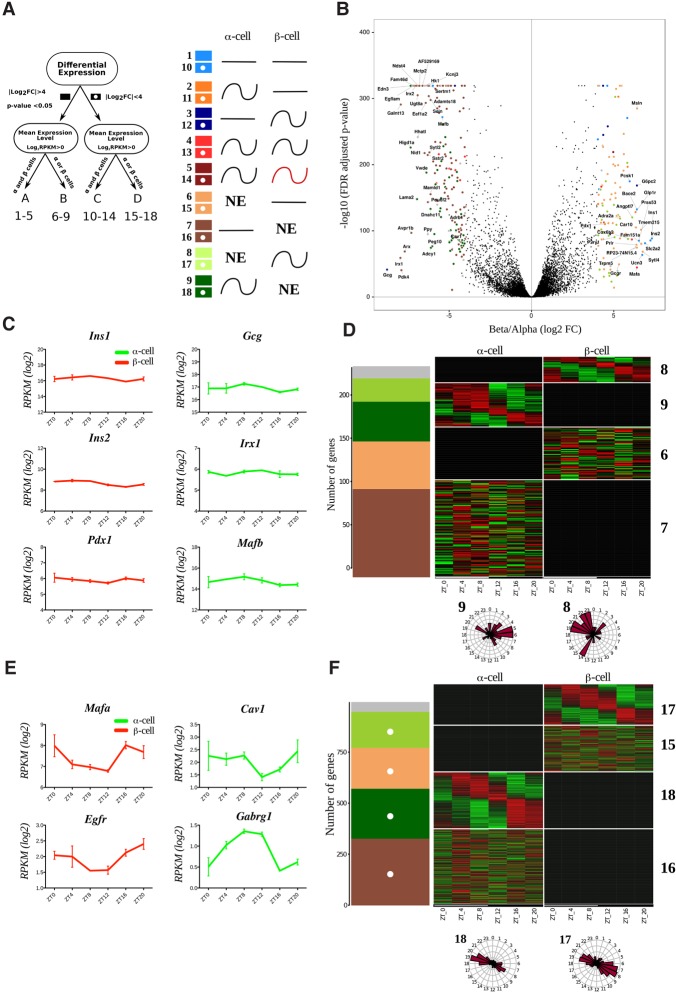
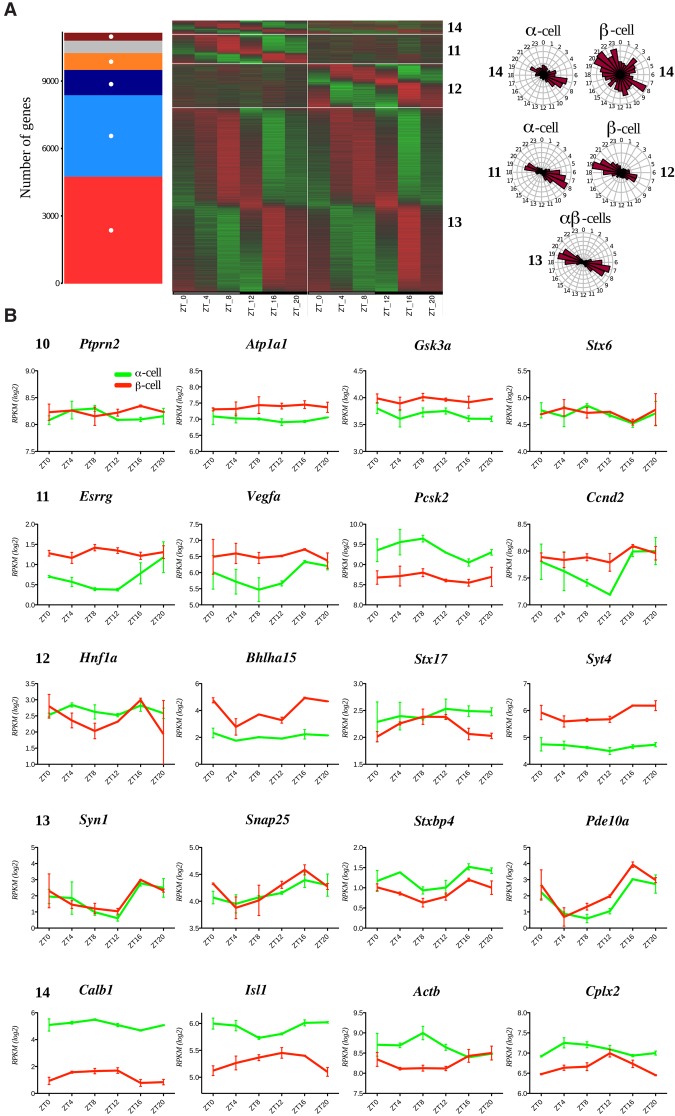
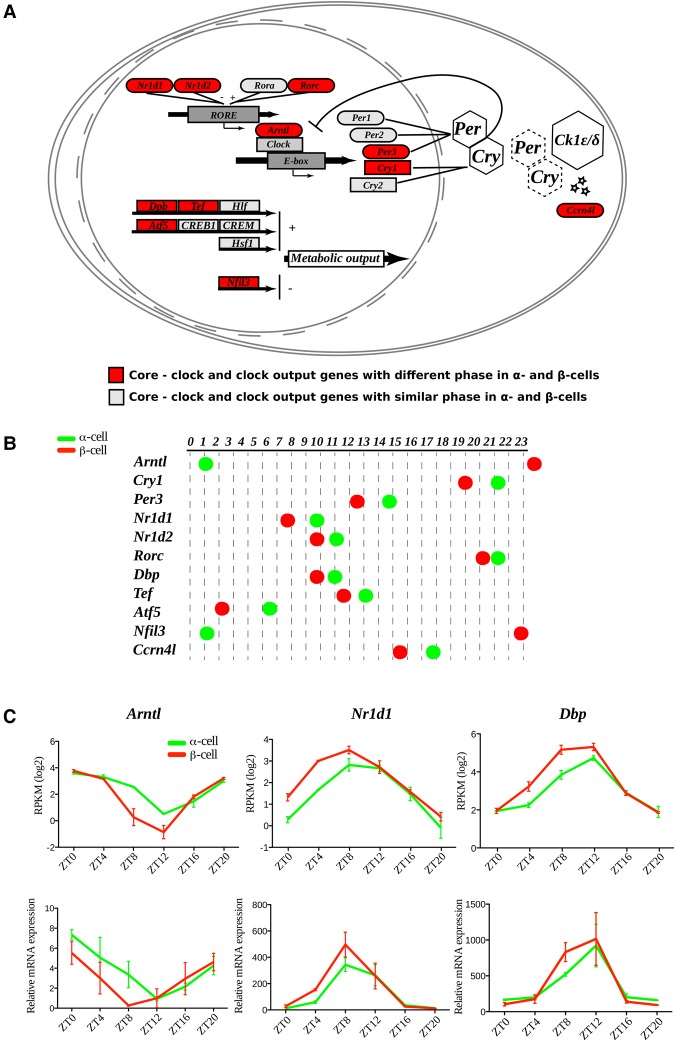
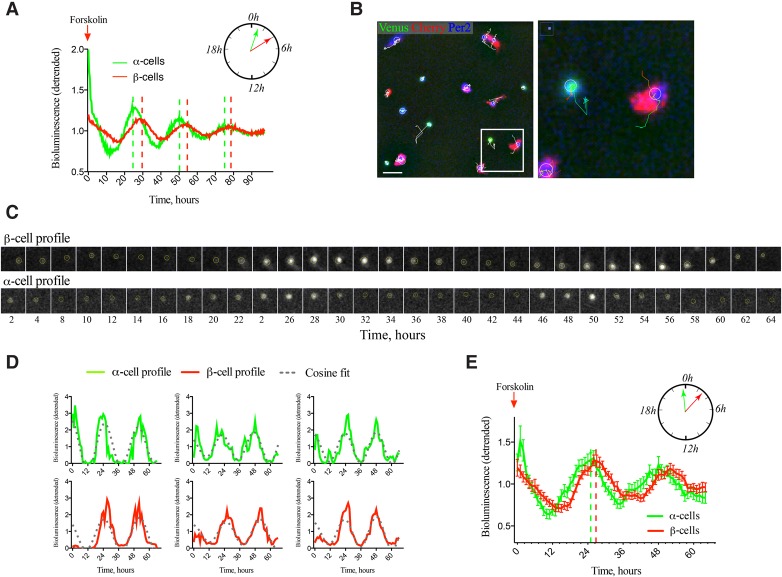
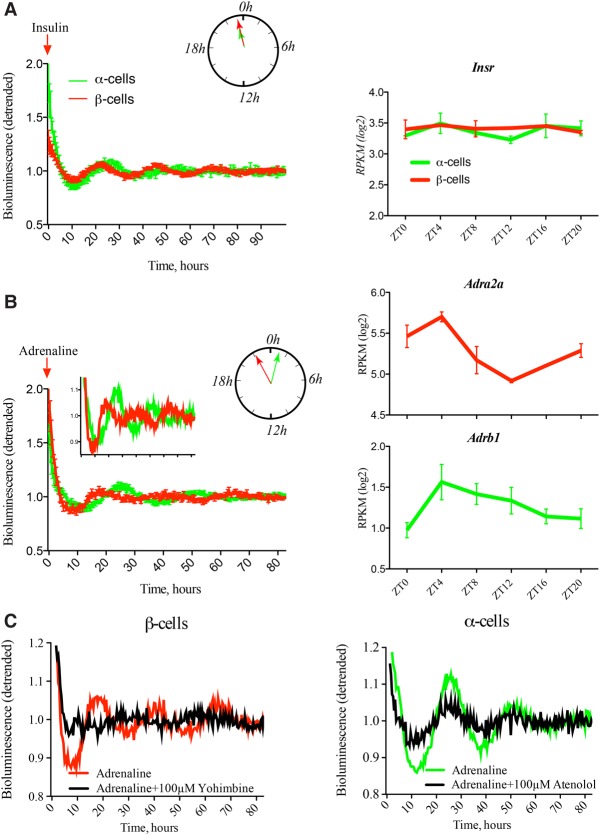
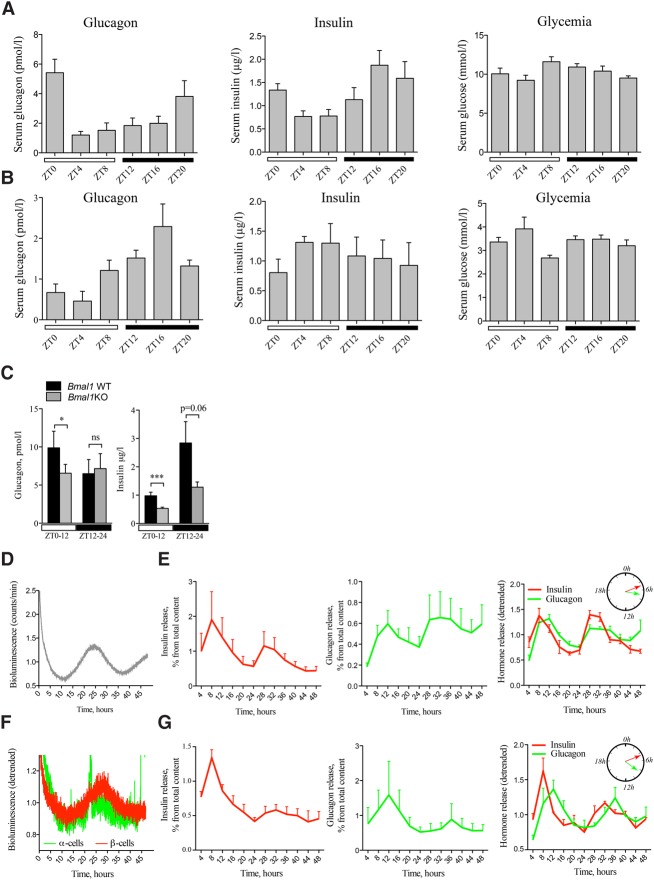
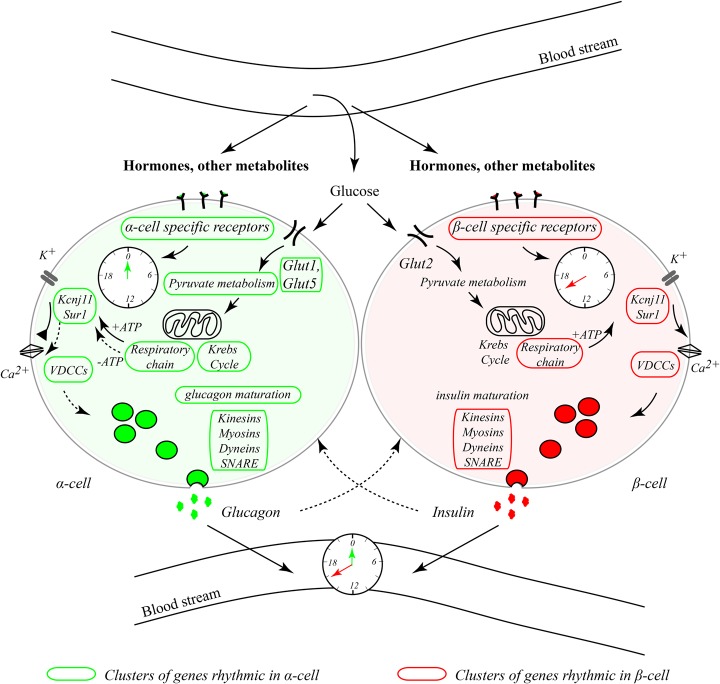
A critical role of circadian oscillators in orchestrating insulin secretion and islet gene transcription has been demonstrated recently. However, these studies focused on whole islets and did not explore the interplay between α-cell and β-cell clocks. We performed a parallel analysis of the molecular properties of α-cell and β-cell oscillators using a mouse model expressing three reporter genes: one labeling α cells, one specific for β cells, and a third monitoring circadian gene expression. Thus, phase entrainment properties, gene expression, and functional outputs of the α-cell and β-cell clockworks could be assessed in vivo and in vitro at the population and single-cell level. These experiments showed that α-cellular and β-cellular clocks are oscillating with distinct phases in vivo and in vitro. Diurnal transcriptome analysis in separated α and β cells revealed that a high number of genes with key roles in islet physiology, including regulators of glucose sensing and hormone secretion, are differentially expressed in these cell types. Moreover, temporal insulin and glucagon secretion exhibited distinct oscillatory profiles both in vivo and in vitro. Altogether, our data indicate that differential entrainment characteristics of circadian α-cell and β-cell clocks are an important feature in the temporal coordination of endocrine function and gene expression.

Keywords: RNA sequencing; circadian clock; insulin/glucagon secretion; mouse α cells and β cells; single-cell bioluminescence–fluorescence time-lapse microscopy.


Figures

Figure 1.
Figure 1.
Temporal pattern of transcripts differentially expressed in α and β cells. (A) Groups and models assigned to transcripts with respect to their differential expression and rhythmic pattern. Transcripts with expression levels of log2 RPKM > 0 in at least one of the cell types were considered as expressed in this cell type and nonexpressed (NE) in the other cell type. Genes with expression differences >16-fold (absolute log2 fold change >4; FDR-adjusted P-value < 0.05) between two cell types were considered as differentially expressed (groups A and B; solid-colored squares), while those with expression level differences <16-fold were considered as nondifferentially expressed (groups C and D; squares with white dots). We therefore obtained four independent groups of genes: group A (differentially expressed α-cell- and β-cell-specific transcripts detectable in both cell types), group B (differentially expressed α-cell- and β-cell-specific transcripts expressed in one single cell type), group C (genes expressed in α and β cells with lower fold change), and group D (genes in one single cell type with lower fold change). Based on harmonic regression with a period of 24 h, model selection to assess rhythmicity was applied to these four groups. An arbitrary threshold of 0.4 was set on BIC weight (BICW). Genes were assigned to one of the nine pairs of models: groups A and C: genes defined as nonrhythmic (models 1 and 10), genes defined as rhythmic in α cells (models 2 and 11), genes defined as rhythmic in β cells (models 3 and 12), genes defined as rhythmic in both cell types with similar parameters (models 4 and 13), and genes defined as rhythmic in both cell types with different parameters (models 5 and 14); and groups B and D: genes expressed in β cells only and defined as nonrhythmic (models 6 and 15), genes expressed in α cells only and defined as nonrhythmic (models 7 and 16), genes expressed in β cells only and defined as rhythmic (models 8 and 17), and genes expressed in α cells only and defined as rhythmic (models 9 and 18). (NE) Gene is not expressed. Genes with lower BICWs were considered as undefined (model 0) and are represented as a gray bar in D and F. (B) Volcano plot presenting the transcripts differentially expressed in α cells (log2 fold change less than −4) or β cells (log2 fold change >4). Differentially expressed genes are identified by colored dots corresponding to their respective model. (C,E) Temporal expression profiles for selected nonrhythmic (C) and rhythmic (E) transcripts differentially expressed in β cells (left) and α cells (right). Only the profile on the higher-expression cell type is shown. Data represent the mean of two biological replicates per time point (each replicate is a mix of cells from six mice). Error bars express the SD of two independent experiments. (D,F) Rhythmic expression heat maps for transcripts of groups B and D. The number of genes distributed by models (described in A) is depicted in the left panel. (Right panels) Corresponding heat maps showing relative expression indicated in green (low) and red (high). Phase distribution of rhythmic genes is presented in the adjacent polar histograms.
Figure 2.
Figure 2.
Comparative analysis of temporal expression patterns of the transcripts expressed in α and β cells (group C in Fig. 1A). A total of 11,171 transcripts expressed in both α and β cells (log2 RPKM > 0) and exhibiting the expression level differences absolute log2 fold change <4 between the two cell types were assigned to one of the five models (models 10–14 in Fig. 1A). (A) The number of genes assigned in models and corresponding heat maps showing relative expression indicated in green (low) and red (high). The gray bar represents genes not classified in any models. Phase distribution of rhythmic genes is presented on the adjacent polar histograms for rhythmic genes in (1) one cell type (models 11 and 12), (2) both cell types with the same parameters (model 13), or (3) both cell types with different parameters (model 14). (B) Temporal profiles for selected transcripts expressed in both cell types delineated to one of the rhythmicity models. Data are expressed as mean ± SD of two independent experiments.
Figure 3.
Figure 3.
Core clock transcripts expressed in α and β cells exhibit distinct rhythmic phases in vivo. (A) Mapping of identified α-cell and β-cell molecular clock and clock-controlled transcripts into modified “circadian rhythm” KEGG (Kyoto Encyclopedia of Genes and Genomes) pathways. Transcripts exhibiting distinct rhythmic phases in α and β cells are marked in red, and those with similar phases are marked in gray. (B) Rhythmic phases of core clock and clock-controlled transcripts in α and β cells. (C) Temporal profiles of selected core clock transcripts with distinct rhythmic phases in α and β cells assessed by RNA-seq data (top panels) and qRT–PCR analysis (bottom panels). Data represent the mean of two biological replicates per time point (each replicate is a mix of cells from six mice). Error bars express the SD of two independent experiments.
Figure 4.
Figure 4.
α-Cell and β-cell clocks synchronized in vitro by forskolin exhibit distinct circadian phases at the population (A) and single-cell (BE) levels. (A) Average PER::Luc oscillation profiles of forskolin-synchronized FACS separated α-cell and β-cell populations (50,000 cells per well) in n = 4 and n = 5 experiments (with an average of five animals used per experiment), respectively. Data are presented as detrended values (Pulimeno et al. 2013). Significant phase shift between the two cell types (see Supplemental Table 2) is presented schematically in the polar diagram. (B) Representative full bioluminescence–fluorescence image (512 × 512 pixels) of proGcg-Venus/RIP-Cherry/PER2::Luc-dissociated mouse islet cells subjected to time-lapse bioluminescence–fluorescence microscopy (Supplemental Movies S1–2). α Cells are Venus-positive (green labeling), and β cells are Cherry-positive (red labeling). Bioluminescence signal (blue in the image) was quantified for each cell over the nucleus within the circled area. Representative trajectories are overplayed in white over the image. (Right panel) The cropped image presents two traced cells. Bar, 40 µm. (C) Time-lapse microscopy of circadian PER2::Luc bioluminescence of a representative β cell (top row) and α cell (bottom row). Images were taken every 2 h during 64 h. (D) Analyzed bioluminescence tracks (detrended) for three representative α cells (green) and three β cells (red) with corresponding fitted cosine curves (gray) obtained using the circadian gene expression (CGE) plug-in (Sage et al. 2010). (E) Average PER2::Luc bioluminescence expression profiles (detrended) of n = 49 Venus-positive α cells and n = 55 Cherry-positive β cells after forskolin shock recorded in n = 8 independent time-lapse movies. Note the significant phase shift between two cell types (23.98 h ± 0.65 h in α cells and 26.71 h ± 0.58 h in β cells). P = 0.0023, two-tailed paired t-test. Data are expressed as mean ± SEM.
Figure 5.
Figure 5.
α-Cell and β-cell clocks synchronized in vitro by adrenaline, but not by insulin, exhibit distinct circadian phases. (Left panels) Average detrended PER2::Luc bioluminescence profiles for separated α-cell and β-cell populations synchronized in vitro with a 1-h pulse of 100 nM insulin (A) or 5 µM adrenaline (B). Circadian phases of the PER2::Luc bioluminescence profiles recorded from α-cell and β-cell populations, presented in the polar diagrams, were similar (A) or delayed for α-cell population (B). Mean circadian parameters for these experiments are in Supplemental Table 2. (Right panels) In vivo temporal expression transcript profiles over 24 h obtained by RNA-seq (Supplemental Data Set 1) for insulin receptor (Insr) and adrenergic receptors (Adra2a and Adrb1) in α and β cells. Data are expressed as mean ± SEM for the left panels. (A) n = 5 experiments for α cells; n = 6 experiments for β cells. (B) n = 6 experiments for α cells; n = 3 experiments for β cells. An average of five mice was used per experiment. Mean ± SD for the right panels. n = 2 independent experiments. (C) Average detrended PER2::Luc bioluminescence profiles for separated α-cell and β-cell populations synchronized with adrenaline alone or in the presence of adrenergic receptor antagonists. n = 6 experiments for α cells with adrenaline alone; n = 3 experiments for β cells with adrenaline alone; n = 3 independent experiments with antagonists for each cell type. An average of five mice was used per experiment. Coincubation of α and β cells with antagonists of β1 adrenergic receptor (100 µM atenolol) and α2 adrenergic receptor (100 µM yohimbine), respectively, attenuated the synchronizing effect of adrenaline. Mean circadian parameters for these experiments are in Supplemental Table 3.
Figure 6.
Figure 6.
Secretion of insulin and glucagon in vivo and in vitro exhibits rhythmic profiles altered in circadian mutant mice. In vivo insulin, glucagon, and glucose levels were assessed in the sera collected from night-fed animals (A) or animals fasted for 12 h prior to the experiment and during the entire period of serum collection (B). Obtained profiles were analyzed by CosinorJ and qualified as 24-h rhythmic for χ2 < 0.5 within the period length range of 18–30 h and nonrhythmic if χ2 ≥ 0.5 or outside this period length range. (A) Mouse sera were collected around the clock every 4 h (see Supplemental Fig. S1 for the design). n = 6–15 animals for each time point. Average serum insulin levels were χ2 = 0.0069 for period 22.05 h ± 2.2 h and phase 18.83 h ± 6.45 h (rhythmic), χ2 = 3.39 (nonrhythmic) for glucagon, and χ2 = 0.73 (nonrhythmic) for glucose. (B) Mouse sera were collected as described in A from n = 3–5 mice per time point. CosinorJ analysis results for average serum insulin levels were χ2 = 0.055 for period 20.1 h ± 6.04 h (rhythmic), χ2 = 0.21 for glucagon for period 24.0 h ± 1.59 h (rhythmic), and χ2 = 0.16 for glucose for period 10.5 h ± 2.17 h (nonrhythmic). (C) In vivo insulin and glucagon levels were assessed in mouse serum samples collected during the light phase (ZT0–ZT12; white square) and dark phase (ZT12–ZT24; black square) in night-fed Bmal1 knockout animals and their Bmal1 wild-type littermates. Light-phase insulin was assessed in n = 27 paired samples from Bmal1 knockout and Bmal1 wild-type mice (total of 54 animals). Dark phase insulin was assessed in 12 paired animal samples. Light-phase glucagon was measured in the blood samples from n = 16 pairs of animals (n = 12 pairs for the dark phase). Data are expressed as mean ± SEM. (***) P = 0.0006 for light-phase insulin; (*) P = 0.034 for light-phase glucagon, two-tailed paired t-test. (D,E) Circadian bioluminescence recording (D) with parallel assessment of hormone secretion (E) in perifused mixed islet cell populations after forskolin synchronization. n = 4 independent experiments with an average of four mice used per experiment. The perifusion medium contained 5.5 mM glucose and was collected every 4 h during 48 h. Hormone concentrations in the outflow medium were normalized to the total hormone content in the cell lysate at the end of each experiment and are expressed as the percentage of total content (mean ± SEM) (left and middle panels) or as superimposed detrended values (mean ± SEM) (right panel). CosinorJ analysis results for insulin levels were χ2 = 0.22 for period 19.49 h ± 1.17 h and phase 5.13 h ± 0.37 h (rhythmic) and χ2 = 0.064 for glucagon level for period 25.79 h ± 2.19 h and phase 7.05 h ± 0.75 h (rhythmic). (F,G) Circadian bioluminescence recording (F) with parallel assessment of insulin secretion in a separated β-cell population (G, left panel) and glucagon secretion in a separated α-cell population (G, middle panel). n = 3 independent experiments for α and for β cells, with and average of five mice used per experiment. α-Cell and β-cell populations were separated by FACS, plated, synchronized with forskolin pulse, and continuously perifused with culture medium containing 5.5 mM glucose for 48 h following synchronization. The outflow medium was collected every 4 h. Hormone concentrations in the outflow medium samples were normalized to the total hormone content in the cell lysate at the end of each experiment and are expressed as the percentage of total content (mean ± SEM) (left and middle panels) or as superimposed detrended values (mean ± SEM) (right panel). CosinorJ analysis results were χ2 = 0.19 for insulin level for period 23.17 h ± 0.56 h and phase 4.94 h ± 0.88 h (rhythmic) and χ2 = 0.04 for glucagon level for period 23.03 ± 1.14 h and phase 8.4 h ± 0.93 h (rhythmic).
Figure 7.
Figure 7.
Inputs and outputs of α-cellular and β-cellular clocks. α-Cellular and β-cellular oscillators exhibit different circadian phases in vivo and in vitro in response to physiologically relevant stimuli, such as adrenaline, possibly due to a distinct repertoire of surface receptors and signal transduction molecules specific for each cell type. Key functional genes exhibit similar or distinct temporal patterns in α and β cells, comprising those encoding for glucose transporters, enzymes catalyzing glucose metabolism reactions (glycolysis, pyruvate metabolism, and Krebs cycle), KATP channels, voltage-dependent calcium channels (VDCCs), genes involved in glucagon maturation (but not insulin maturation), and genes responsible for granule trafficking and exocytosis. Clusters of rhythmic genes in β cells are highlighted in red, and those rhythmic in α cells are highlighted in green. We hypothesize that the distinct properties of α-cellular and β-cellular clocks, along with feeding–fasting cycles, might contribute to orchestrating different oscillating secretory patterns of glucagon and insulin stemming from the differential temporal orchestration of the functional gene transcription in α and β cells.

Comment in

  • Clocks stop sugar shock.
    Haspel J. Haspel J. Sci Transl Med. 2017 Apr 5;9(384):eaan2772. doi: 10.1126/scitranslmed.aan2772. Sci Transl Med. 2017. PMID: 28381534

References

    1. Adriaenssens AE, Svendsen B, Lam BY, Yeo GS, Holst JJ, Reimann F, Gribble FM. 2016. Transcriptomic profiling of pancreatic α, β and δ cell populations identifies δ cells as a principal target for ghrelin in mouse islets. Diabetologia 59: 2156–2165. - PMC - PubMed
    1. Asher G, Sassone-Corsi P. 2015. Time for food: the intimate interplay between nutrition, metabolism, and the circadian clock. Cell 161: 84–92. - PubMed
    1. Asher G, Schibler U. 2011. Crosstalk between components of circadian and metabolic cycles in mammals. Cell Metab 13: 125–137. - PubMed
    1. Atger F, Gobet C, Marquis J, Martin E, Wang J, Weger B, Lefebvre G, Descombes P, Naef F, Gachon F. 2015. Circadian and feeding rhythms differentially affect rhythmic mRNA transcription and translation in mouse liver. Proc Natl Acad Sci 112: E6579–E6588. - PMC - PubMed
    1. Balsalobre A, Marcacci L, Schibler U. 2000. Multiple signaling pathways elicit circadian gene expression in cultured Rat-1 fibroblasts. Curr Biol 10: 1291–1294. - PubMed

MeSH terms