

Peroxisome proliferator-activated receptor gamma (PPARγ) is central to the initiation and propagation of human angiomyolipoma, suggesting its potential as a therapeutic target
- PMID: 28275008
- PMCID: PMC5376758
- DOI: 10.15252/emmm.201506111
Peroxisome proliferator-activated receptor gamma (PPARγ) is central to the initiation and propagation of human angiomyolipoma, suggesting its potential as a therapeutic target
Erratum in
-
Peroxisome proliferator-activated receptor gamma (PPARγ) is central to the initiation and propagation of human angiomyolipoma, suggesting its potential as a therapeutic target.EMBO Mol Med. 2017 Dec;9(12):1763. doi: 10.15252/emmm.201708507. EMBO Mol Med. 2017. PMID: 29196313 Free PMC article.
Abstract
Angiomyolipoma (AML), the most common benign renal tumor, can result in severe morbidity from hemorrhage and renal failure. While mTORC1 activation is involved in its growth, mTORC1 inhibitors fail to eradicate AML, highlighting the need for new therapies. Moreover, the identity of the AML cell of origin is obscure. AML research, however, is hampered by the lack of in vivo models. Here, we establish a human AML-xenograft (Xn) model in mice, recapitulating AML at the histological and molecular levels. Microarray analysis demonstrated tumor growth in vivo to involve robust PPARγ-pathway activation. Similarly, immunostaining revealed strong PPARγ expression in human AML specimens. Accordingly, we demonstrate that while PPARγ agonism accelerates AML growth, PPARγ antagonism is inhibitory, strongly suppressing AML proliferation and tumor-initiating capacity, via a TGFB-mediated inhibition of PDGFB and CTGF. Finally, we show striking similarity between AML cell lines and mesenchymal stem cells (MSCs) in terms of antigen and gene expression and differentiation potential. Altogether, we establish the first in vivo human AML model, which provides evidence that AML may originate in a PPARγ-activated renal MSC lineage that is skewed toward adipocytes and smooth muscle and away from osteoblasts, and uncover PPARγ as a regulator of AML growth, which could serve as an attractive therapeutic target.
Keywords: angiomyolipoma; cancer stem cells; mesenchymal stem cells; tuberous sclerosis complex; PPARγ.
© 2017 The Authors. Published under the terms of the CC BY 4.0 license.
Figures
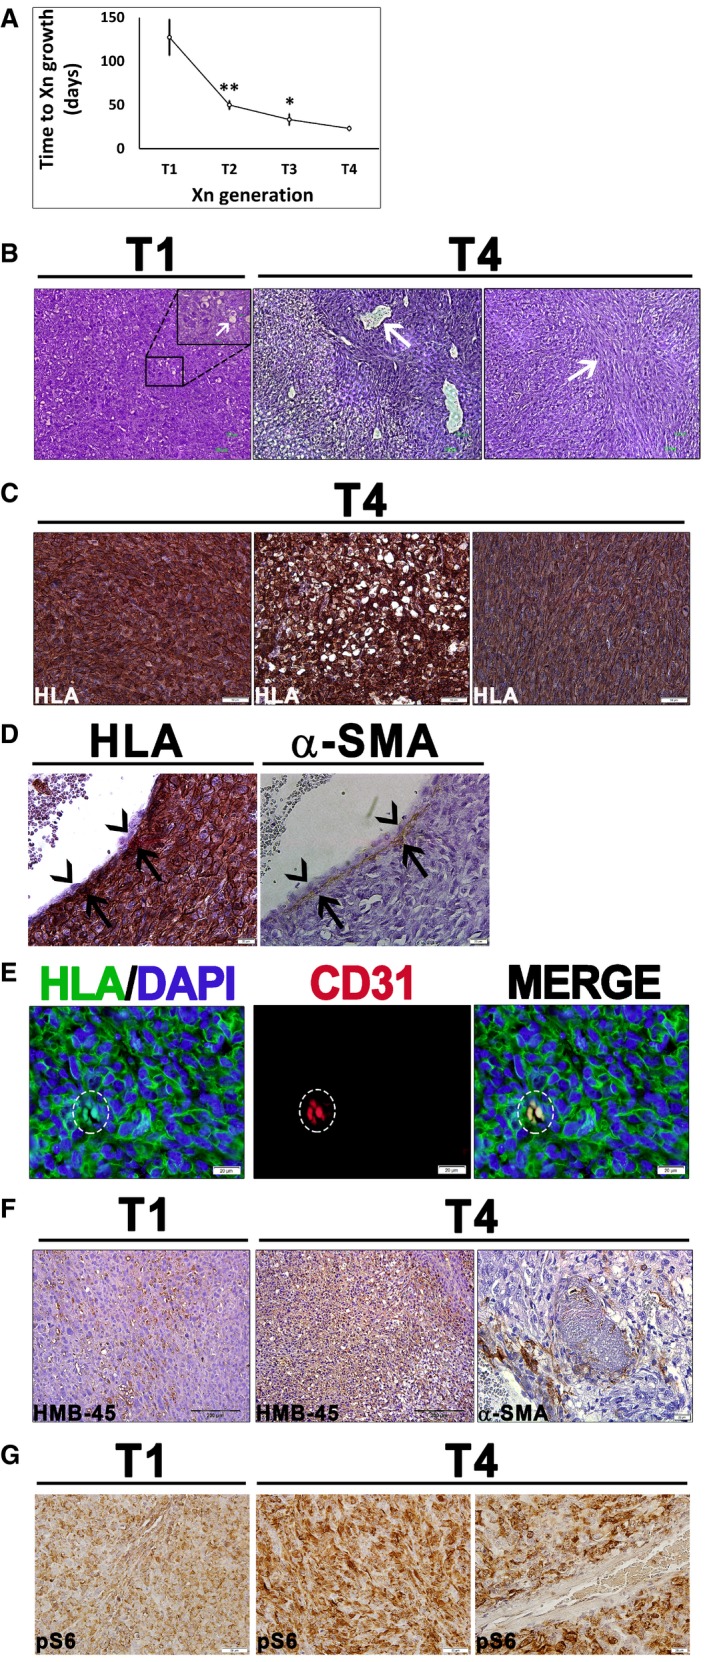
Growth interval between sequential Xn generations from 1st (T1) to 4th (T4), shown as mean ± SD (n ≥ 3); *P < 0.05; **P < 0.01 (one‐way ANOVA with Bonferroni post hoc test). The exact P‐values are specified in Appendix Table S5.
T1‐Xn harbor mainly undifferentiated cells with rare lipid‐distended cells (arrows). In contrast, T4‐Xn show the classic triphasic AML histology, consisting of vessels (left panel, arrow) surrounded by a thick layer of perivascular epithelioid cell (PEC)‐like cells. Peripherally, a lipoid area, composed of lipid‐distended cells, is seen. Furthermore, T4‐Xn harbor “myoid” areas (right panel, arrow), composed of immature myocytes. Scale bar: 100 μm.
Immunohistochemical staining (IHC) of T4‐Xn for HLA, showing positive staining of the undifferentiated, lipoid, and myoid (left, middle, and right panels, respectively) compartments. Scale bar: 50 μm.
IHC of T4‐Xn for HLA (left panel) and pericyte marker α‐SMA (right panel). Shown is a vessel, in which α‐SMA+ pericytes are HLA+ (arrows), whereas endothelial cells are of mouse origin (arrowheads). Scale bar: 100 μm.
Immunofluorescent staining (IF) of T4‐Xn for HLA (green) and CD31 (red), demonstrating formation of human‐derived vessels. Scale bar: 20 μm.
IHC of T1‐ and T4‐Xn for the diagnostic AML markers HMB‐45 and α‐SMA. HMB‐45 is expressed in both T1‐ (left panel) and T4‐Xn (middle panel) and stains both blood vessels and adipocytes. Scale bar: 200 μm. In contrast, only T4‐Xn express α‐SMA (right panel). Scale bar: 20 μm.
IHC of T1‐ and T4‐Xn for pS6, demonstrating expression in both T1‐ (left panel) and, to a greater extent, T4‐Xn (middle panel). Scale bar: 50 μm. Note that within tumor vessels, only perivascular cells express pS6 (right panel). Scale bar: 20 μm.
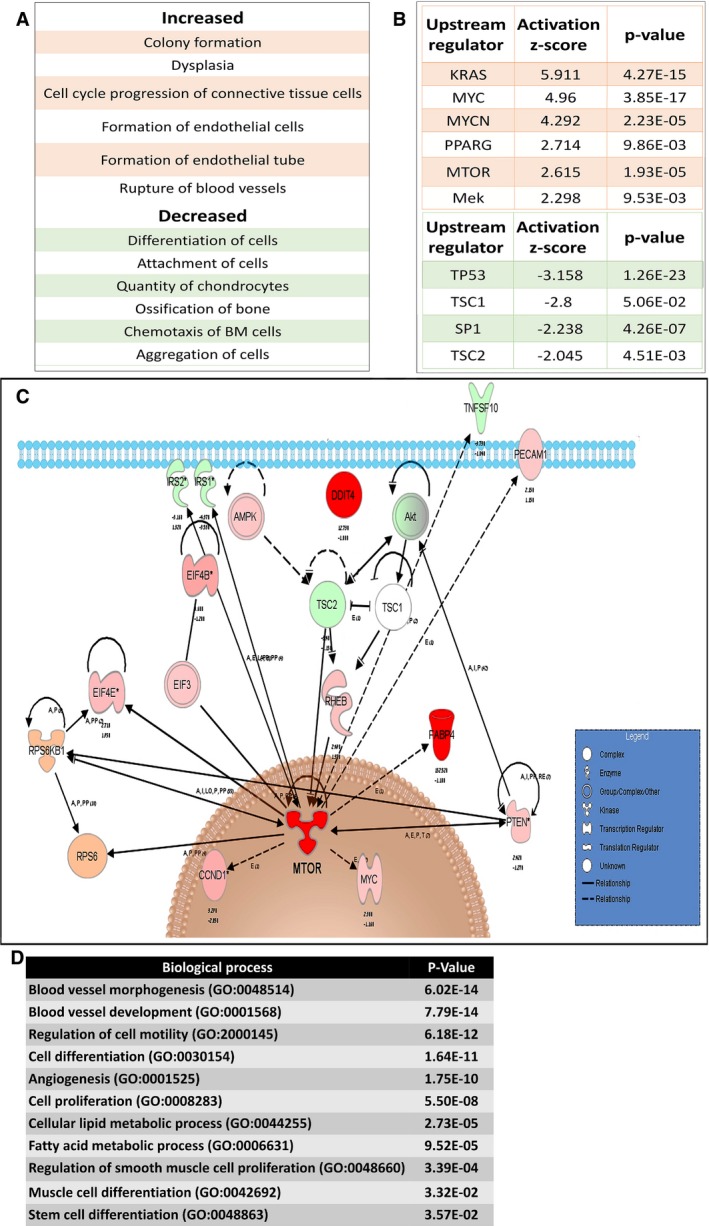
Ingenuity Pathway Analysis (IPA) of increased (upper panel) and decreased (lower panel) functions in T5 (5th generation)‐ versus T1 (1st generation)‐Xn.
Activated (upper panel) and inhibited (lower panel) upstream regulators in T5‐ versus T1‐Xn according to IPA.
IPA of the mTOR pathway according to gene expression changes in T5‐ versus T1‐Xn. Red/pink indicates increased gene expression, and green indicates decreased expression. *MTOR demonstrated activation as an upstream regulator with an activation z‐score of 2.615 and a P‐value of 1.93E‐05.
Enriched Gene Ontology (GO) biological processes according to differentially expressed genes in T5‐Xn compared to normal human kidneys.
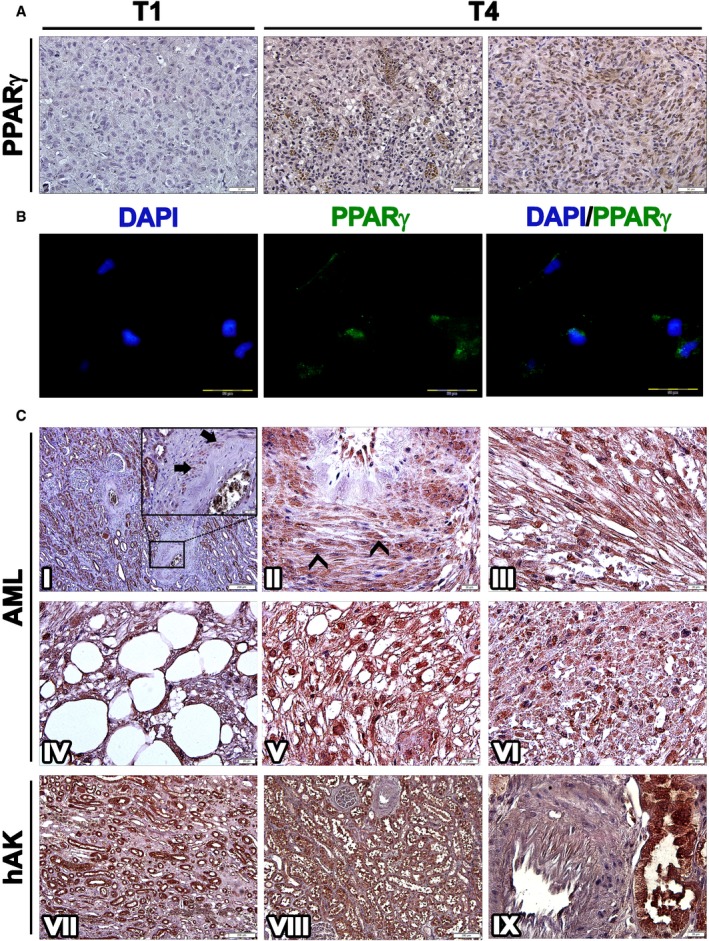
Immunohistochemical staining (IHC) of T1 (1st generation)‐ and T4 (4th generation)‐xenografts (Xn) for PPARG. T1‐Xn (left panel) demonstrate low expression of PPARG. In contrast, T4‐Xn are strongly positive for PPARG. Abundant expression is seen both in adipocytic cells (middle panel) and in the undifferentiated non‐adipocytic compartment of the tumor (right panel), where strong nuclear staining can be noted. Scale bar: 50 μm.
Immunofluorescent staining of T4‐Xn cells for PPARG (green), demonstrating both cytoplasmic and nuclear expression. Scale bar: 100 μm.
IHC of primary AML tumors for PPARG. Normal renal tissue of the patient (I) demonstrates strong PPARG expression in tubules and endothelial cells and lack of expression in glomeruli. In vessel walls (magnified in I), PPARG expression can be noted in a small portion of pericytes (arrows). Within tumor tissue, numerous pericytes strongly expressing PPARG are seen (II), demonstrating both nuclear (arrowheads) and cytoplasmic expression. PPARG is also strongly expressed in the myoid and adipocytic compartments of the tumor (III and IV, respectively). Particularly strong nuclear expression is seen in epithelioid cells (V). Scattered within the tumor are small undifferentiated cells (VI), which are also positive for PPARG. Normal control human adult kidneys (hAK) demonstrate PPARG expression in all tubule segments, including collecting ducts (VII and VIII) but not in glomeruli. In contrast to normal and tumor tissue from AML patients, blood vessels in normal hAK do not harbor PPARG‐expressing pericytes (IX). Scale bars: II–VI, IX: 20 μm; I, VII, VIII: 200 μm.
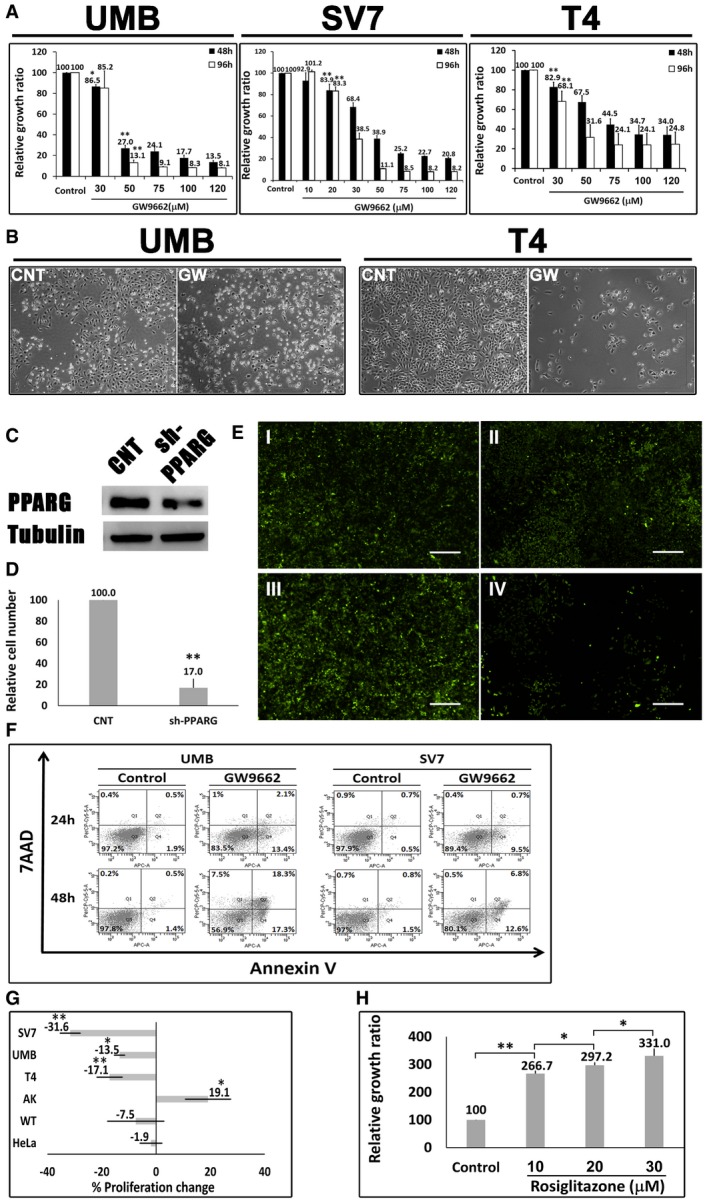
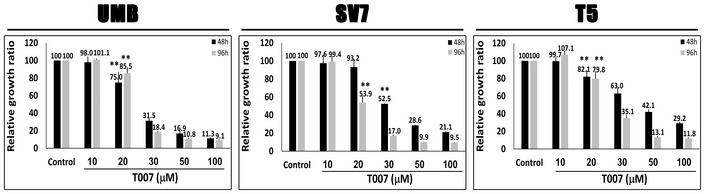
Relative growth ratios of UMB, SV7, and T4 (4th generation)‐xenograft (Xn) cells (left, middle, and right panels, respectively) treated with the PPARG inhibitor GW9662 in varying concentrations, compared to control, vehicle‐treated cells, shown as mean ± SD (n = 3). At each of the two time points, treated cells with a given concentration were compared to control cells. *P < 0.05, **P < 0.01 (one‐way ANOVA with Bonferroni post hoc test).
The effects of 48‐h treatment with GW9662 (GW) or vehicle (CNT) on the morphology of UMB (left panel) and T4‐Xn (right panel) cells. Scale bar: 1,000 μm.
PPARG knockdown (KD) results in growth inhibition of AML cells: UMB and SV7 cells were infected with shRNA targeting PPARG or control‐shRNA, both consisting of a GFP‐expressing cassette. Western blot analysis demonstrated significant reduction in PPARG protein levels following infection with PPARG‐shRNA (sh‐PPARG) compared to control‐shRNA (CNT).
In order to assess the effect of PPARG KD on cell growth, both UMB and SV7 cell lines were seeded in equal amounts and recounted following 1 week. PPARG KD resulted in a significant reduction in cell numbers. Results shown as mean ± SD (n = 3). **P < 0.01 (two‐tailed Student's t‐test).
Representative images of control‐ and PPARG‐shRNA‐infected cells, both marked by GFP, at day 0 and day 7, showing significant growth inhibition in the latter. I & II, control cells at day 0 and 7, respectively; III & IV, PPARG‐shRNA‐infected cells at day 0 and 7, respectively. Scale bars, 500 μm.
Flow cytometric analysis of UMB and SV7 cells treated with GW9662 or vehicle (control). Cells were treated for 24 or 48 h and analyzed for the expression of the early apoptosis marker annexin V and necrosis marker 7AAD.
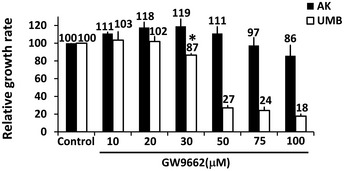
Comparison of the anti‐proliferative effect of GW9662 on UMB, SV7, T4‐Xn, normal human adult kidney (AK), Wilms' tumor (WT), and the cervical cancer cell line HeLa, shown as percent change in proliferation. The cells were treated for 48 h with 30 μM GW9662. Results shown as mean ± SD (n = 3). *P < 0.05, **P < 0.01 (one‐way ANOVA with Bonferroni post hoc test).
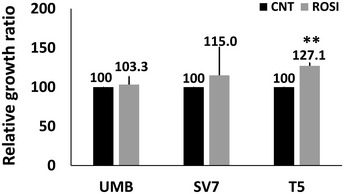
Relative growth ratios of T5‐Xn cells treated with the PPARG agonist rosiglitazone for 96 h in varying concentrations, compared to control cells, shown as mean ± SD (n = 3). *P < 0.05, **P < 0.01 (one‐way ANOVA with Bonferroni post hoc test).
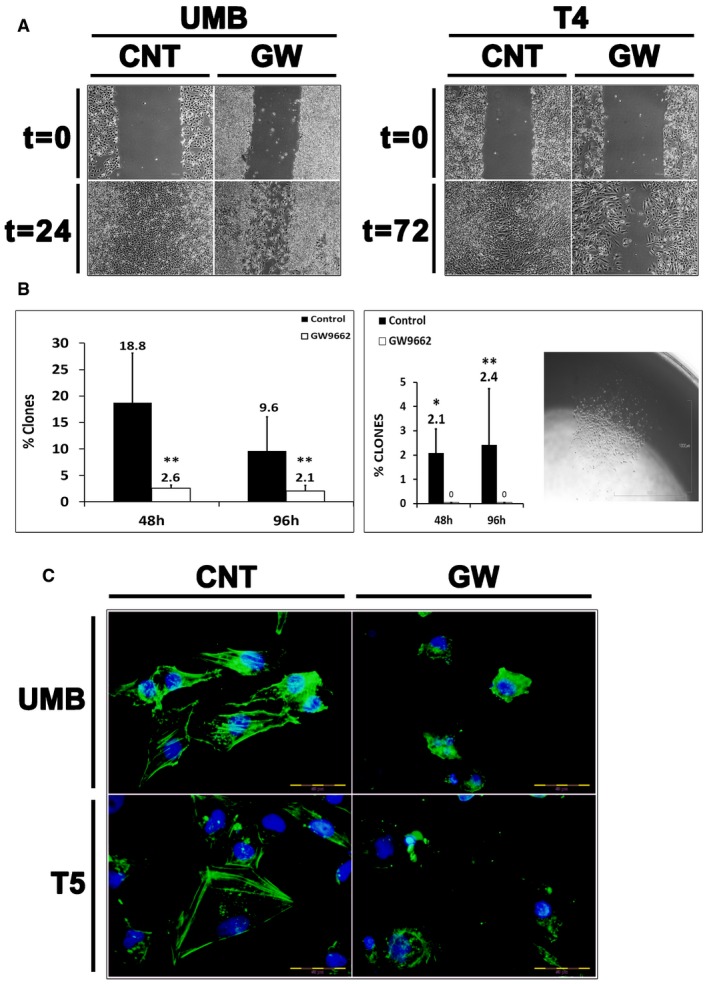
Cell migration assay demonstrating the effects of PPARG inhibition on cell migration. UMB and T4 (4th generation)‐xenograft (Xn) cells were treated with GW9662 (GW) or vehicle (CNT) and assessed for their ability to migrate through a scrape in the cell monolayer. Both UMB (left panel) and T4‐Xn cells (right panel) demonstrated significantly lower migration capacity as a result of the treatment, compared to control cells. Scale bar: 1,000 μm.
Comparison of the single‐cell‐derived colony formation capacity of UMB (left panel) and T4‐Xn cells (right panel) treated with GW9662 or vehicle (control). Shown in the picture is a representative colony derived from a T4‐Xn cell. Results shown as the mean percentage of cells that formed clones ± SD (n = 3). *P < 0.05; **P < 0.01 (chi‐squared test). Scale bar: 1,000 μm. The exact P‐values are specified in Appendix Table S5.
Immunofluorescent staining for β‐actin (green) in UMB (top panel) and T5‐Xn cells (bottom panel) treated with GW9662 (GW) or vehicle (CNT), demonstrating changes in the cytoskeleton as a result of the treatment. Scale bar: 50 μm.
- A
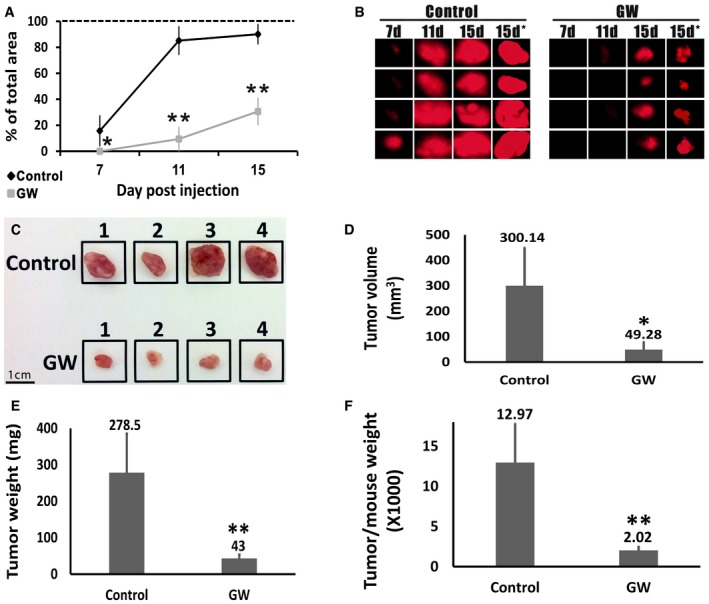
Relative size of tumors derived from control‐ and GW9662‐treated (GW) cells, as assessed by in vivo imaging. Size shown as percentage of the visualization field in the fluorescent binocular occupied by the tumor. Results shown as mean ± SD (n = 4). *P < 0.05; **P < 0.01 (two‐tailed Student's t‐test).
- B
Photographs of the mCherry‐expressing tumors obtained using a fluorescent binocular at 7, 11, and 15 days after injection and immediately after tumor resection (7, 11, 15, and 15 days*, respectively). Photographs taken at 0.7× magnification.
- C
Photographs of the tumors derived from control and GW9662‐treated (GW) cells, immediately following resection. Scale bar: 1 cm.
- D–F
Comparison of the tumors derived from control and GW9662‐treated (GW) cells in terms of tumor volume, tumor weight, and tumor weight to mouse weight. Results shown as mean ± SD (n = 4). *P < 0.05; **P < 0.01 (two‐tailed Student's t‐test).
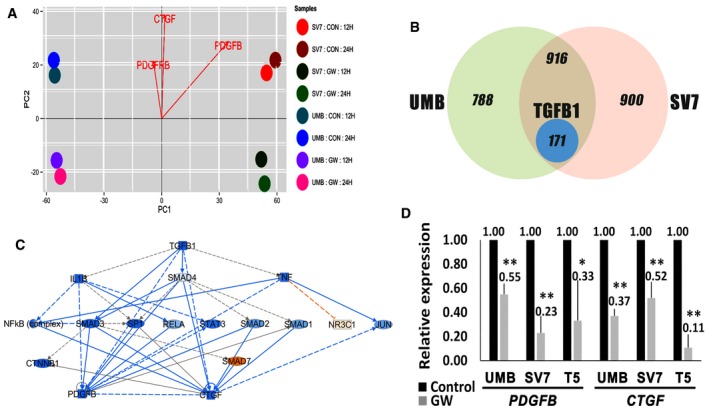
Principal components analysis (PCA) of differentially expressed genes in UMB and SV7 cells treated with GW9662 (GW) for 12 or 24 h compared to control cells (CON). Notably, PDGFB, PDGFRB, and CTGF demonstrate significantly stronger expression in control samples.
Venn diagram demonstrating the effect of PPARG inhibition on global gene expression of UMB and SV7 cells. The left and right circles represent the number of genes exhibiting a fold change of ≥ 2 as a result of PPARG inhibition in UMB and SV7 cells, respectively, while the intersection area represents the common differentially expressed genes. The blue circle represents the TGFB1‐related genes contained within the latter.
IPA of TGFB1‐regulated genes demonstrating a fold change of ≥ 2 as a result of PPARG inhibition. Blue and red circles represent inhibited and activated upstream regulators, respectively.
qPCR analysis of PDGFB and CTGF in UMB, SV7, and T5‐Xn cells treated with GW9662 (GW) compared with control cells. Results shown as mean ± SD (n = 4). *P < 0.05; **P < 0.01 (two‐tailed Student's t‐test). The exact P‐values are specified in Appendix Table S5.
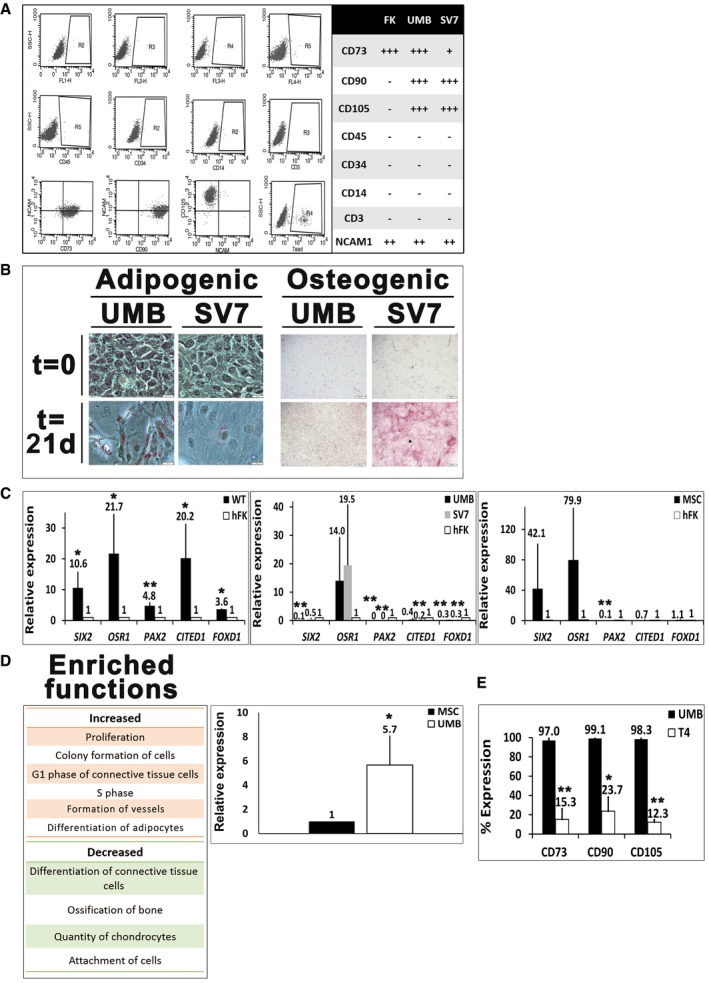
Flow cytometry analysis of human fetal kidney (hFK), UMB, and SV7 cells. Left panel: Representative dot plots of UMB cell expression of CD45, CD34, CD14, CD3, CD105, CD73, CD90, neural cell adhesion molecule 1 (NCAM1), and unstained controls. Right panel: Summary of expression levels. +++, strong; ++, medium; +, low; −, no staining.
Left: Oil Red O staining of UMB and SV7 cells before (t = 0) and after (t = 21 days) induction of adipogenic differentiation, demonstrating formation of lipid vacuoles. Scale bar: 50 μm. Right: Alizarin red staining of UMB and SV7 cells before (t = 0) and after (t = 21 days) induction of osteogenic differentiation, demonstrating formation of calcium deposits. Scale bar: 500 μm.
Left panel: Quantitative PCR (qPCR) analysis, demonstrating significant upregulation of renal progenitor genes in Wilms' tumor (WT) cells compared to hFK cells (hence = 1). Middle panel: qPCR analysis of renal progenitor gene expression, demonstrating higher OSR1 expression in UMB and SV7 cells and comparable SIX2 expression in SV7 compared to hFK (hence = 1). Other renal progenitor genes and the stromal progenitor gene FOXD1 exhibit low expression levels. Right panel: qPCR analysis of renal progenitor gene expression in human MSCs compared to hFK (hence = 1), demonstrating a similar expression pattern to AML cells. Results shown as mean ± SD (n = 3). *P < 0.05; **P < 0.01 (two‐tailed Student's t‐test).
Left panel: Ingenuity Pathway Analysis (IPA) of increased and decreased functions in UMB cells compared to MSCs. Right panel: qPCR analysis of PPARG expression in UMB cells compared with MSCs (hence = 1). Results shown as mean ± SD (n = 3). *P < 0.05 (two‐tailed Student's t‐test).
Comparison of MSC marker expression between UMB and T4 (4th generation)‐xenograft (Xn) cells. A significant decrease in the expression of CD73, CD90, and CD105 is seen. Results shown as mean ± SD (n = 3).*P < 0.05; **P < 0.01 (two‐tailed Student's t‐test).
Similar articles
-
Inhibitory effects of PPARγ ligands on TGF-β1-induced CTGF expression in cat corneal fibroblasts.Exp Eye Res. 2015 Sep;138:52-8. doi: 10.1016/j.exer.2015.06.028. Epub 2015 Jul 2. Exp Eye Res. 2015. PMID: 26142957 Free PMC article.
-
PPARγ and Wnt Signaling in Adipogenic and Osteogenic Differentiation of Mesenchymal Stem Cells.Curr Stem Cell Res Ther. 2016;11(3):216-25. doi: 10.2174/1574888x10666150519093429. Curr Stem Cell Res Ther. 2016. PMID: 25986621 Review.
-
PPARγ suppression inhibits adipogenesis but does not promote osteogenesis of human mesenchymal stem cells.Int J Biochem Cell Biol. 2012 Feb;44(2):377-84. doi: 10.1016/j.biocel.2011.11.013. Epub 2011 Nov 23. Int J Biochem Cell Biol. 2012. PMID: 22120652
-
Erucic acid derived from rosemary regulates differentiation of mesenchymal stem cells into osteoblasts/adipocytes via suppression of peroxisome proliferator-activated receptor γ transcriptional activity.Phytother Res. 2020 Jun;34(6):1358-1366. doi: 10.1002/ptr.6607. Epub 2020 Jan 27. Phytother Res. 2020. PMID: 31989712
-
Renal angiomyolipoma with tuberous sclerosis complex: How it differs from sporadic angiomyolipoma in both management and care.Asian J Surg. 2020 Oct;43(10):967-972. doi: 10.1016/j.asjsur.2019.12.008. Epub 2020 Jan 17. Asian J Surg. 2020. PMID: 31959574 Review.
Cited by
-
HSPA12A is required for adipocyte differentiation and diet-induced obesity through a positive feedback regulation with PPARγ.Cell Death Differ. 2019 Nov;26(11):2253-2267. doi: 10.1038/s41418-019-0300-2. Epub 2019 Feb 11. Cell Death Differ. 2019. PMID: 30742088 Free PMC article.
-
Diablo: A Double-Edged Sword in Cancer?Mol Ther. 2018 Mar 7;26(3):678-679. doi: 10.1016/j.ymthe.2018.02.004. Epub 2018 Feb 20. Mol Ther. 2018. PMID: 29472100 Free PMC article. No abstract available.
-
Bladder drug mirabegron exacerbates atherosclerosis through activation of brown fat-mediated lipolysis.Proc Natl Acad Sci U S A. 2019 May 28;116(22):10937-10942. doi: 10.1073/pnas.1901655116. Epub 2019 May 13. Proc Natl Acad Sci U S A. 2019. PMID: 31085638 Free PMC article.
-
mTORC1 Inhibition Is an Effective Treatment for Sporadic Renal Angiomyolipoma.Kidney Int Rep. 2017 Aug 12;3(1):155-159. doi: 10.1016/j.ekir.2017.07.016. eCollection 2018 Jan. Kidney Int Rep. 2017. PMID: 29340326 Free PMC article.
-
NCAM1/FGF module serves as a putative pleuropulmonary blastoma therapeutic target.Oncogenesis. 2019 Sep 2;8(9):48. doi: 10.1038/s41389-019-0156-9. Oncogenesis. 2019. PMID: 31477684 Free PMC article.
References
-
- Alison MR, Islam S, Wright NA (2010) Stem cells in cancer: instigators and propagators? J Cell Sci 123: 2357–2368 - PubMed
-
- Anders S, McCarthy DJ, Chen Y, Okoniewski M, Smyth GK, Huber W, Robinson MD (2013) Count‐based differential expression analysis of RNA sequencing data using R and Bioconductor. Nat Protoc 8: 1765–1786 - PubMed
-
- Arbiser JL, Yeung R, Weiss SW, Arbiser ZK, Amin MB, Cohen C, Frank D, Mahajan S, Herron GS, Yang J et al (2001) The generation and characterization of a cell line derived from a sporadic renal angiomyolipoma: use of telomerase to obtain stable populations of cells from benign neoplasms. Am J Pathol 159: 483–491 - PMC - PubMed
MeSH terms
Substances
Grants and funding
LinkOut - more resources
Full Text Sources
Other Literature Sources
Molecular Biology Databases
Miscellaneous
