

Characterization of MicroRNA Expression Profiles and Identification of Potential Biomarkers in Leprosy
- PMID: 28275081
- PMCID: PMC5405269
- DOI: 10.1128/JCM.02408-16
Characterization of MicroRNA Expression Profiles and Identification of Potential Biomarkers in Leprosy
Abstract
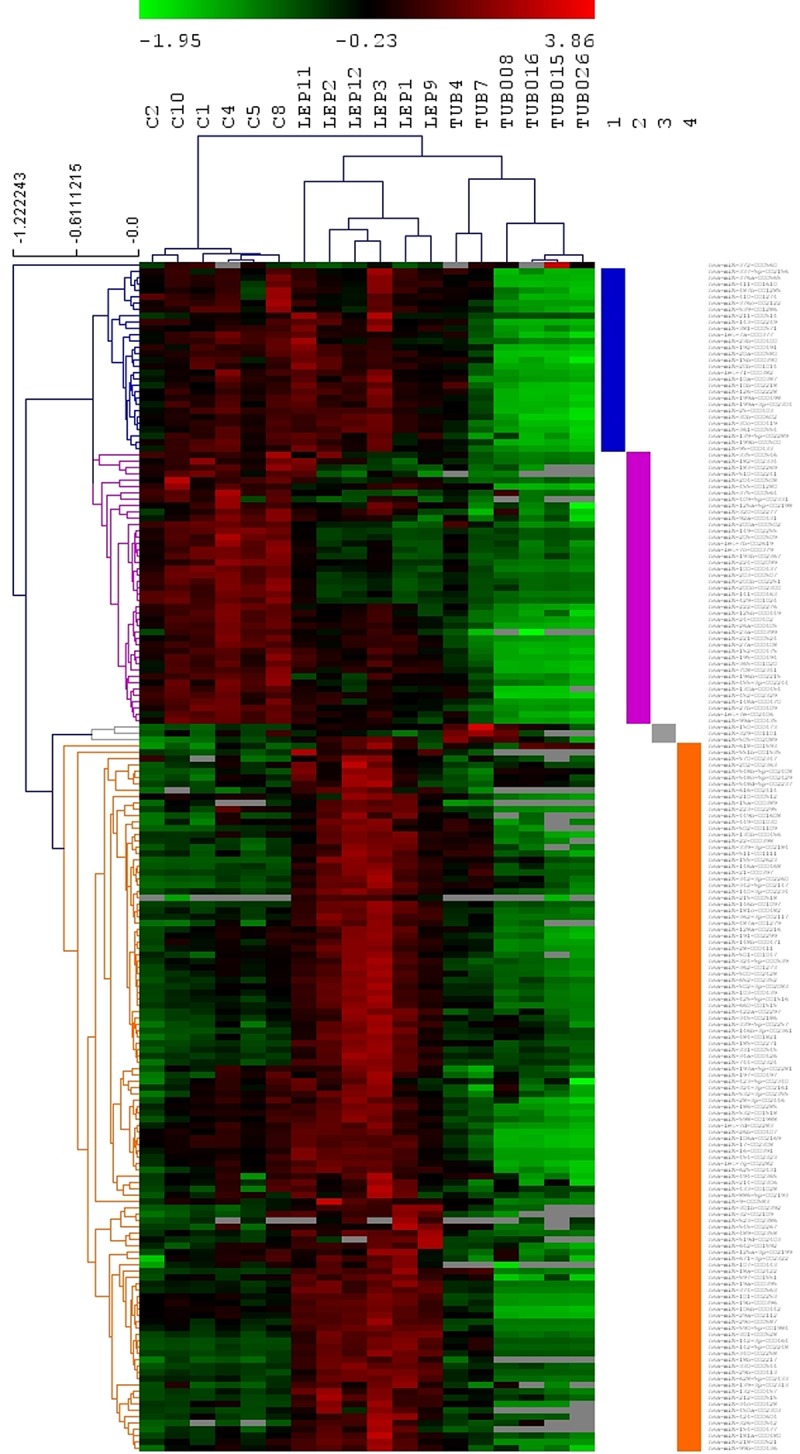
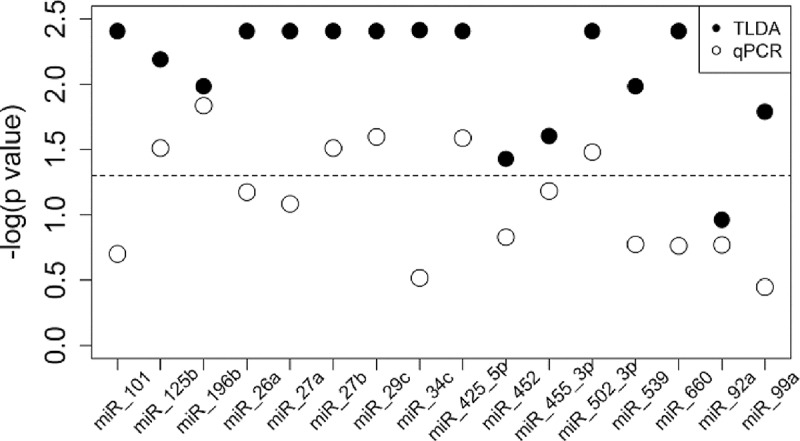
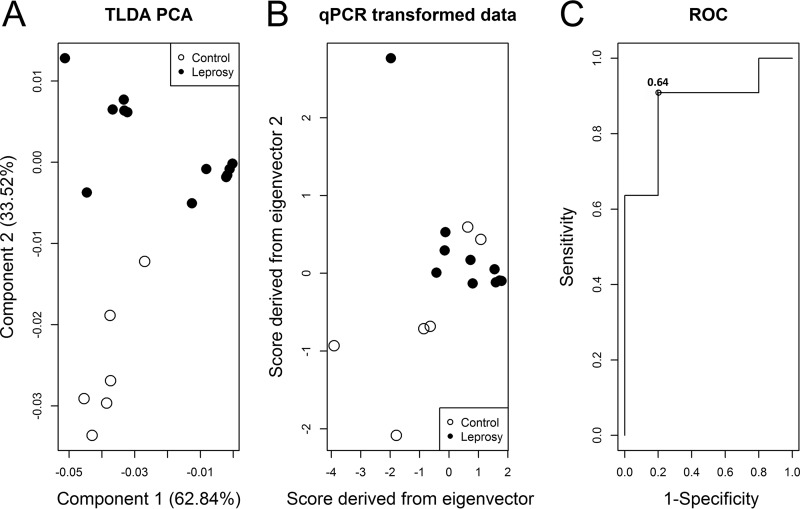
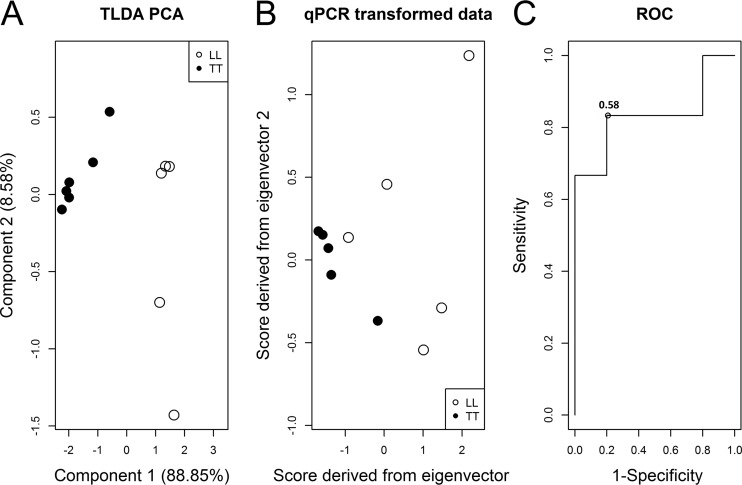
Leprosy is an important cause of disability in the developing world. Early diagnosis is essential to allow for cure and to interrupt transmission of this infection. MicroRNAs (miRNAs) are important factors for host-pathogen interaction and they have been identified as biomarkers for various infectious diseases. The expression profile of 377 microRNAs were analyzed by TaqMan low-density array (TLDA) in skin lesions of tuberculoid and lepromatous leprosy patients as well as skin specimens from healthy controls. In a second step, 16 microRNAs were selected for validation experiments with reverse transcription-quantitative PCR (qRT-PCR) in skin samples from new individuals. Principal-component analysis followed by logistic regression model and receiver operating characteristic (ROC) curve analyses were performed to evaluate the diagnostic potential of selected miRNAs. Four patterns of differential expression were identified in the TLDA experiment, suggesting a diagnostic potential of miRNAs in leprosy. After validation experiments, a combination of four miRNAs (miR-101, miR-196b, miR-27b, and miR-29c) was revealed as able to discriminate between healthy control and leprosy patients with 80% sensitivity and 91% specificity. This set of miRNAs was also able to discriminate between lepromatous and tuberculoid patients with a sensitivity of 83% and 80% specificity. In this work, it was possible to identify a set of miRNAs with good diagnostic potential for leprosy.
Keywords: biomarker; leprosy; miRNA.
Copyright © 2017 American Society for Microbiology.
Figures
References
-
- Hotez PJ, Bottazzi ME, Franco-Paredes C, Ault SK, Periago MR. 2008. The neglected tropical diseases of Latin America and the Caribbean: a review of disease burden and distribution and a roadmap for control and elimination. PLoS Negl Trop Dis 2:e300. doi:10.1371/journal.pntd.0000300. - DOI - PMC - PubMed
-
- World Health Organization. 2016. Leprosy fact sheet (updated February 2017). World Health Organization, Geneva, Switzerland: http://www.who.int/mediacentre/factsheets/fs101/en/.
-
- van Beers SM, Hatta M, Klatser PR. 1999. Patient contact is the major determinant in incident leprosy: implications for future control. Int J Lepr Other Mycobact Dis 67:119–128. - PubMed
Publication types
MeSH terms
Substances
LinkOut - more resources
Full Text Sources
Other Literature Sources
Medical
Molecular Biology Databases
