. 2017 Mar 21;114(12):E2430-E2439.
doi: 10.1073/pnas.1619380114. Epub 2017 Mar 8.

Immune protection against reinfection with nonprimate hepacivirus

Affiliations

Immune protection against reinfection with nonprimate hepacivirus

Stephanie Pfaender et al. Proc Natl Acad Sci U S A. .

Abstract

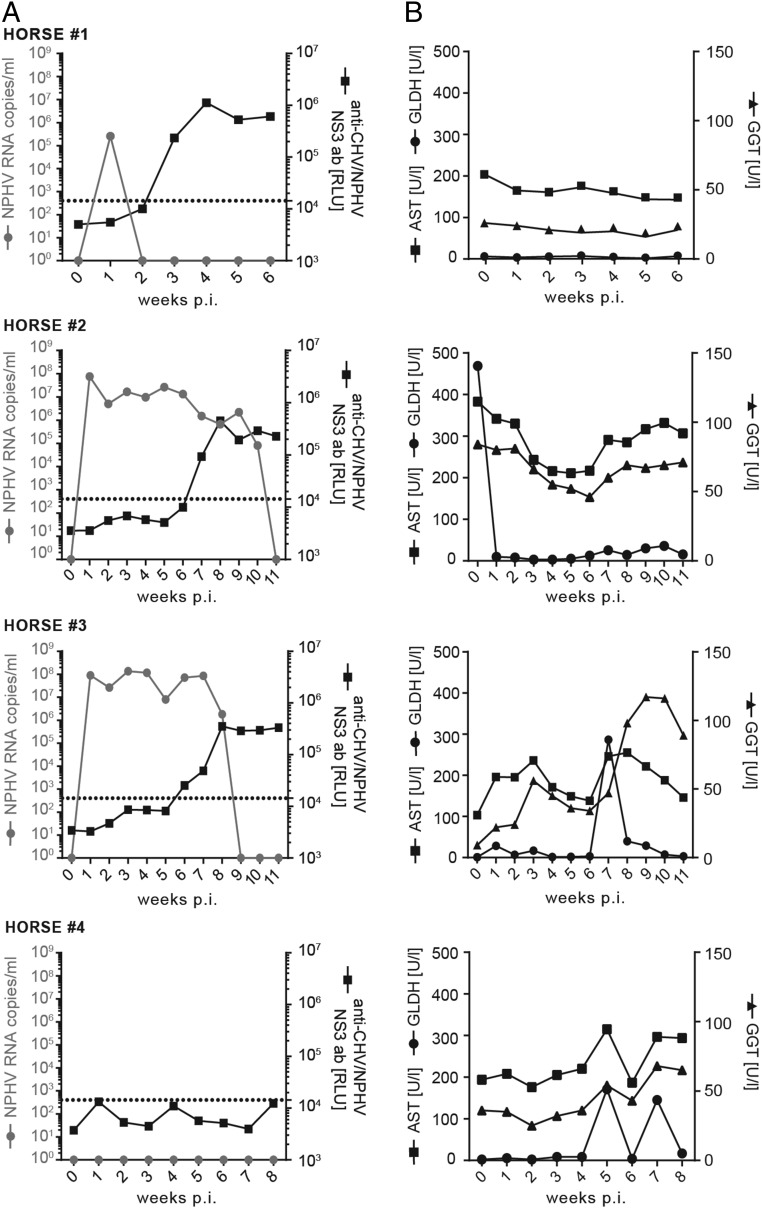
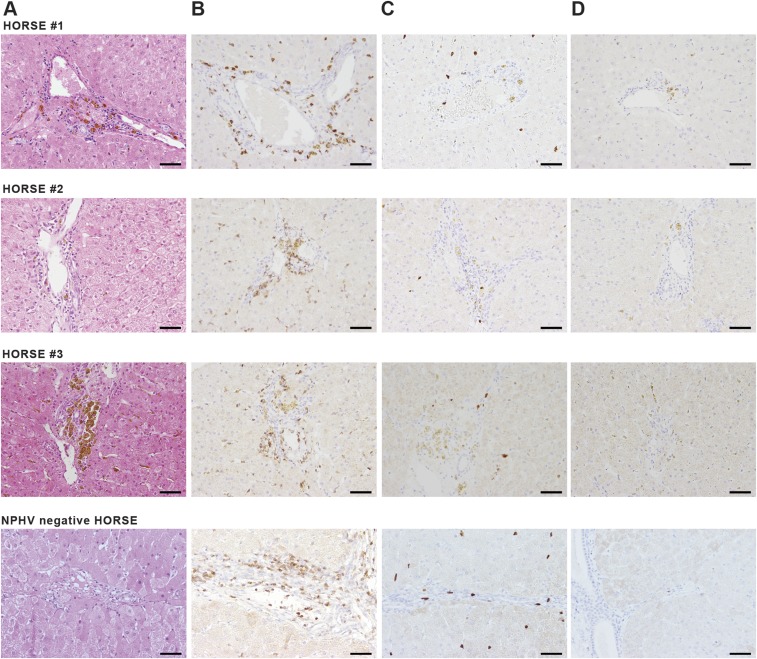
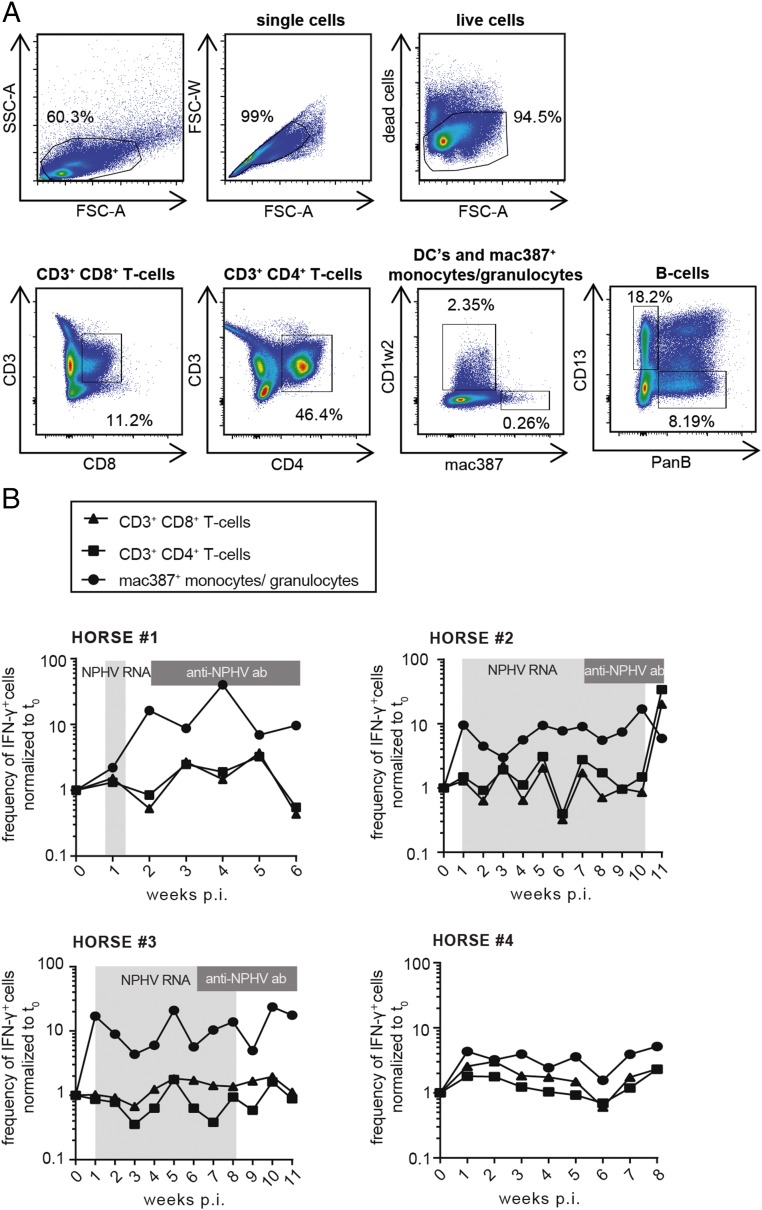
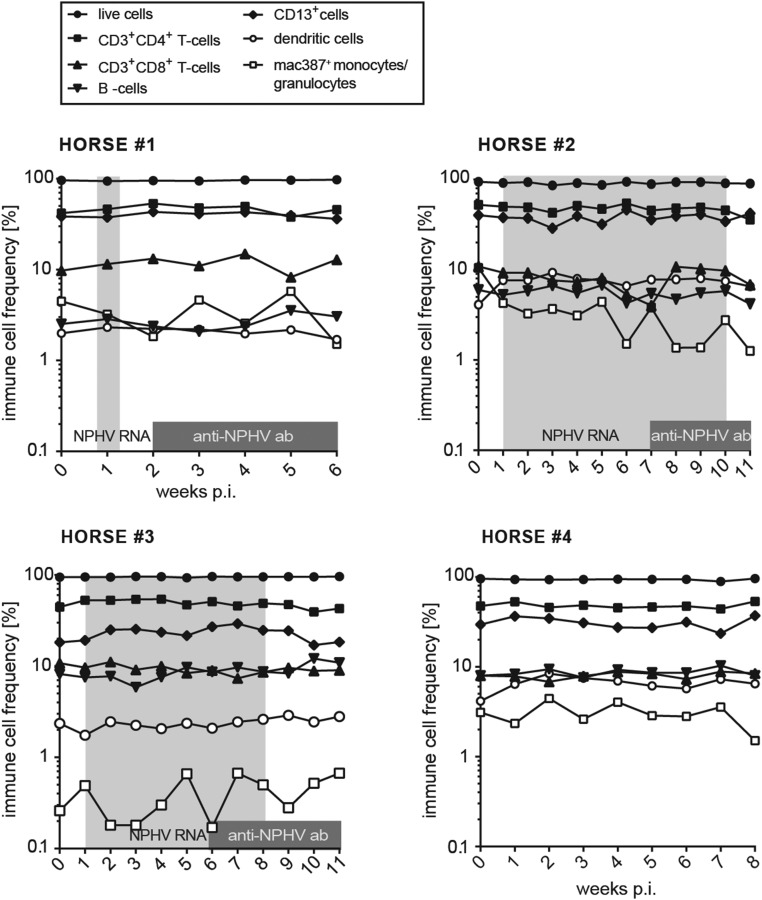
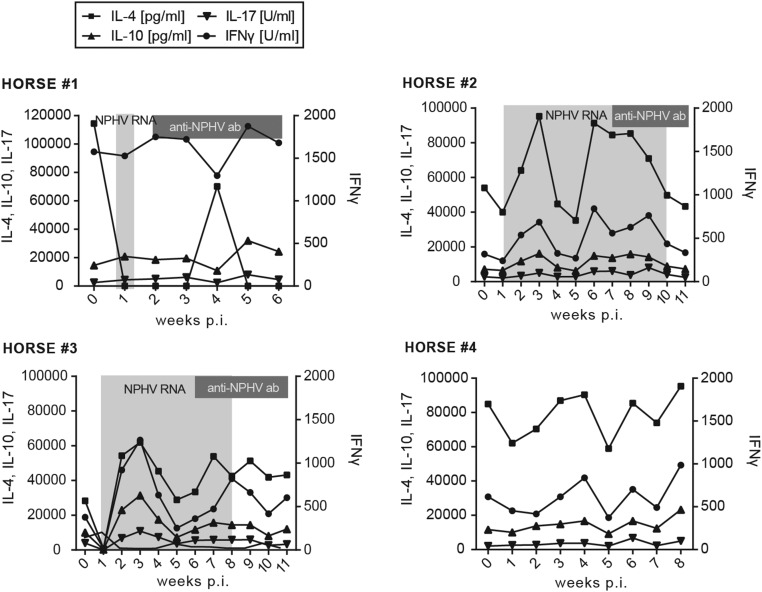
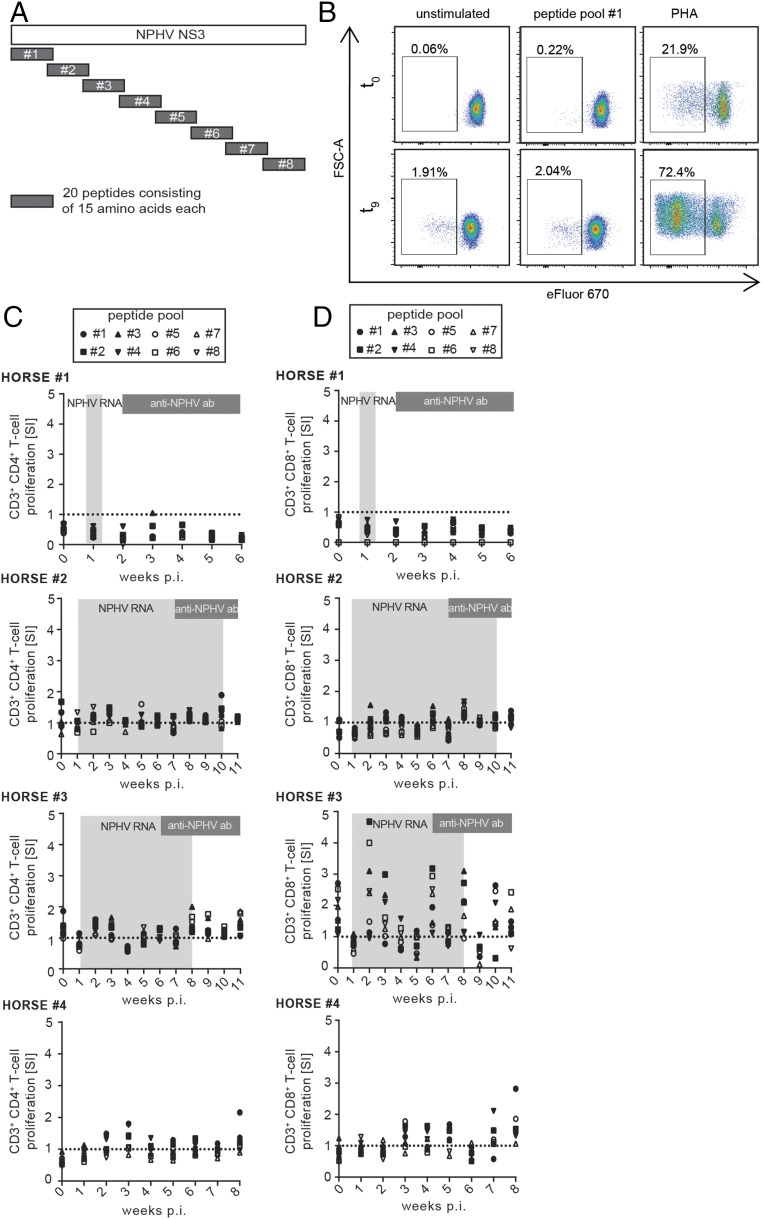
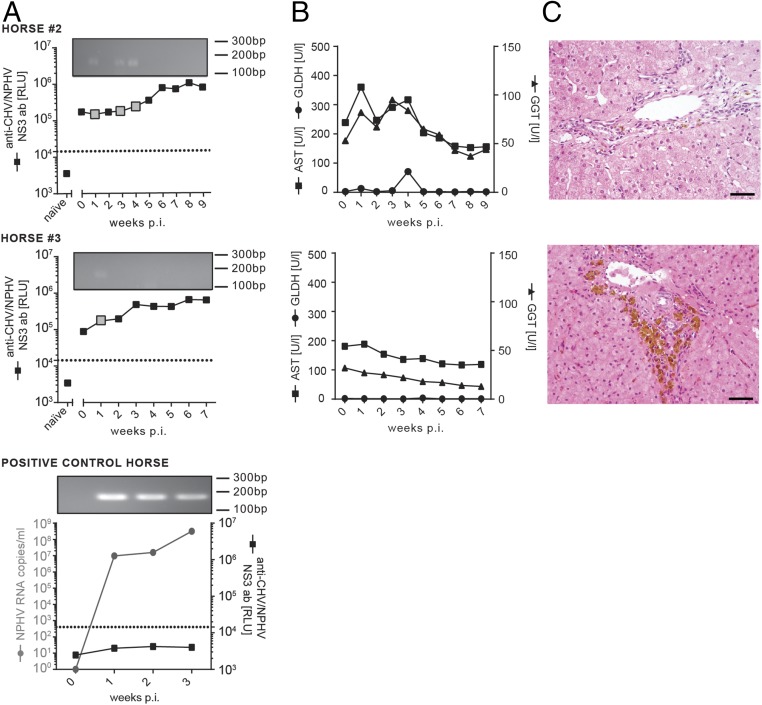
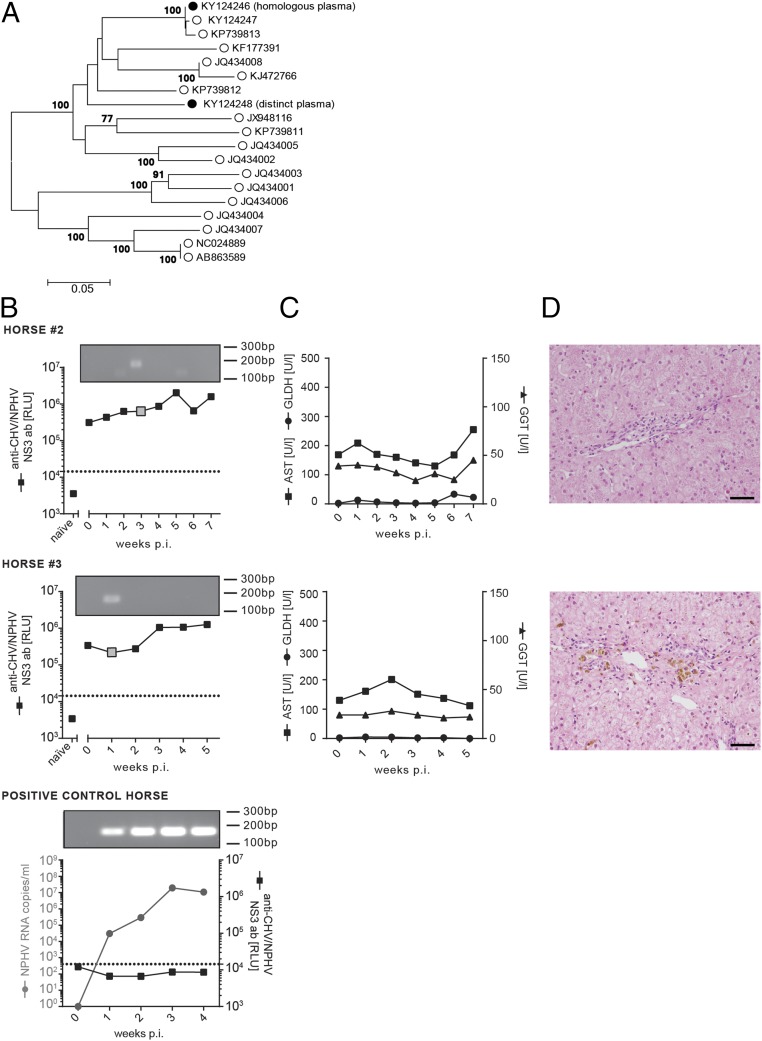
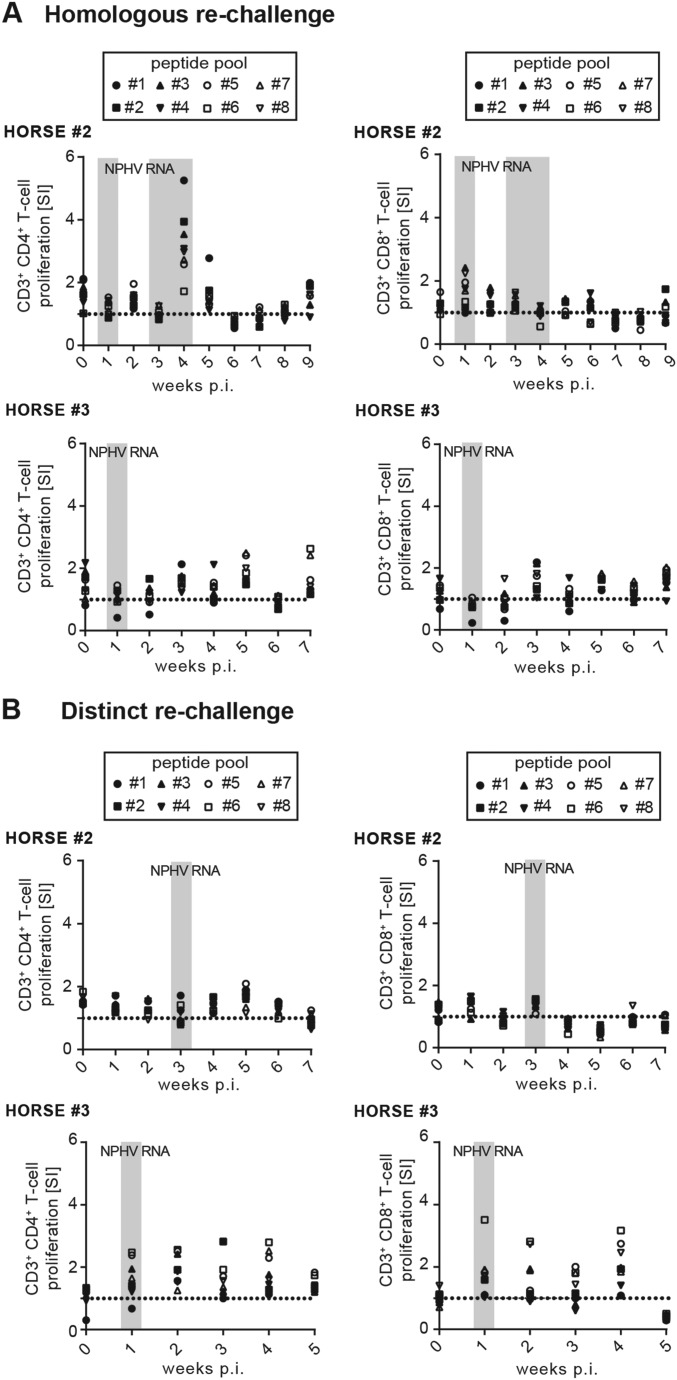
Hepatitis C virus (HCV) displays a restricted host species tropism and only humans and chimpanzees are susceptible to infection. A robust immunocompetent animal model is still lacking, hampering mechanistic analysis of virus pathogenesis, immune control, and prophylactic vaccine development. The closest homolog of HCV is the equine nonprimate hepacivirus (NPHV), which shares similar features with HCV and thus represents an animal model to study hepacivirus infections in their natural hosts. We aimed to dissect equine immune responses after experimental NPHV infection and conducted challenge experiments to investigate immune protection against secondary NPHV infections. Horses were i.v. injected with NPHV containing plasma. Flow cytometric analysis was used to monitor immune cell frequencies and activation status. All infected horses became viremic after 1 or 2 wk and viremia could be detected in two horses for several weeks followed by a delayed seroconversion and viral clearance. Histopathological examinations of liver biopsies revealed mild, periportally accentuated infiltrations of lymphocytes, macrophages, and plasma cells with some horses displaying subclinical signs of hepatitis. Following viral challenge, an activation of equine immune responses was observed. Importantly, after a primary NPHV infection, horses were protected against rechallenge with the homologous as well as a distinct isolate with only minute amounts of circulating virus being detectable.

Keywords: hepatitis C virus; immune protection; infection; nonprimate hepacivirus; rechallenge.


Conflict of interest statement

The authors declare no conflict of interest.

Figures

Fig. 1.
Fig. 1.
Course of infection after experimental inoculation with NPHV+ plasma. Horse 1 was i.v. transfused with 500 mL NPHV containing plasma, whereas horses 2 and 3 were i.v. transfused with 100 mL NPHV containing plasma (GenBank accession no. KY124246, viral load 7.78 × 10⁶ RNA copies per milliliter). Horse 4 was i.v. transfused with 100 mL NPHV plasma. Serum samples were taken on a weekly basis postinoculation (weeks p.i.). (A) The viral load of NPHV RNA was determined by qRT-PCR and is depicted as gray dots (limit of quantification 50 RNA copies per serum sample). Anti-CHV (canine hepacivirus)/NPHV NS3 antibodies were measured by the luciferase immunoprecipitation (LIPS) assay and are depicted in black squares as relative light units (RLUs). A cutoff was calculated by the mean value of samples containing only buffer A, the renilla luciferase-NS3 (Ruc–NS3) fusion protein and A/G beads plus three SDs and is indicated by a dotted line. (B) Liver-specific enzymes in the serum were measured. Reference values are as follows: GLDH < 6 U/L, GGT < 20 U/L, and AST < 170 U/L.
Fig. S1.
Fig. S1.
Immunohistological analysis of liver biopsies. Liver biopsies were taken 6 wk (horse 1), 11 wk (horse 2), and 16 wk (horse 3) p.i. and embedded in paraffin. As control, a liver biopsy embedded in paraffin from a NPHV horse was included. (A) Tissue sections were stained with hematoxylin and eosin. (B) T cells were detected using an anti-CD3 antibody. (C) Immunohistochemistry using an anti-Mac387 antibody was used for visualization of macrophages. (D) Low numbers of B lymphocytes were detected with anti–Pax-5 antibody. (Scale bars, 50 µm.)
Fig. 2.
Fig. 2.
Ultrastructural analysis of horse liver biopsies. Biopsy samples taken from the liver of one NPHV horse as well as from a positive control horse experimentally infected with NPHV (Fig. 6) were immediately fixed with glutaraldehyde. Samples were sectioned in small pieces and, subsequently, processed and analyzed by transmission electron microscopy (TEM) as described in SI Materials and Methods. EM micrographs of (A) a liver biopsy of an experimentally NPHV-infected horse, 7 wk postinfection, and (B) a NPHV horse. An overview of several liver cells is depicted at Top. Higher magnification images of two different areas are shown at Bottom. The white boxed areas highlight the areas that are shown at Bottom as magnified views. (C) Quantification of vesicle sizes (in nanometers) from an experimentally NPHV-infected horse (n = 55) compared with a NPHV horse. Ve, vesicle; LD, lipid droplet; m, mitochondria; rER, rough endoplasmic reticulum; n.d., not detected; nm, nanometer.
Fig. S2.
Fig. S2.
Ultrastructural analysis of horse liver biopsies after natural NPHV infection. (A) Liver biopsy sample of a naturally NPHV-infected horse (20) was taken and immediately fixed with glutaraldehyde. The sample was sectioned in small pieces and, subsequently, processed and analyzed by transmission electron microscopy (TEM) as described in SI Materials and Methods. An overview of several liver cells is depicted on the Left. Higher magnification images of two different areas are shown on the Right. The white boxed areas highlight the areas that are shown as magnified views to the Right. (B) Quantification of vesicle sizes from a naturally NPHV-infected horse (n = 100). Ve, vesicle; LD, lipid droplet; m, mitochondria; ER, endoplasmic reticulum; and nm, nanometer.
Fig. 3.
Fig. 3.
Development of a flow cytometry-based method to measure immune cell frequencies and intracellular IFN-γ expression. PBMCs were isolated on a weekly basis postinoculation by centrifugation on a Ficoll-Hypaque density gradient and stored at −150 °C before flow cytometry staining. PBMCs were stained for the surface markers CD8, CD4, CD3, PanB, CD13, CD1w2, and Mac387 using equine-specific antibodies to detect T lymphocytes (CD3+CD4+ T-helper cells, CD3+CD8+ cytotoxic T cells), B lymphocytes (PanB+), CD13+ cells (expressed on blood neutrophils, basophils, monocytes, but not B or T cells), dendritic cells (CD1w2+), and monocytes/granulocytes (Mac387+), respectively. Additionally, intracellular IFN-γ staining was performed on all cells. Samples were analyzed by flow cytometry. (A) Exemplary depiction of the gating strategy. Dead cells as well as cell duplets were excluded before subsequent gating on the respective immune cell subset. (B) The frequency of IFN-γ–expressing immune cells (CD3+CD4+ T cells, CD3+CD8+ T cells, and mac387+ monocytes/granulocytes) of each time point postinoculation normalized to t0 is depicted for all four horses. Time points that tested positive for NPHV RNA and anti-CHV/NPHV NS3 antibodies are indicated in light- and dark-gray boxes, respectively.
Fig. S3.
Fig. S3.
Immune cell frequencies as determined by flow cytometry. PBMCs were stained with antibodies directed against CD8, CD4, CD3, PanB, CD13, CD1w2, and Mac387 to detect T lymphocytes (CD3+CD4+ and CD3+CD8+), B lymphocytes (PanB+), CD13+ cells (expressed on blood neutrophils, basophils, monocytes, but not B or T cells), dendritic cells (CD1w2+), and monocytes/granulocytes (Mac387+), respectively. All samples were analyzed by flow cytometry. Dead cells as well as cell duplets were excluded before subsequent gating on the respective immune cell subset. Depicted is the frequency of the respective immune cell subtype as percentage of live cells for each time point postinfection (p.i.). Time points that tested positive for NPHV RNA and anti-CHV/NPHV NS3 antibodies are indicated in light- and dark-gray boxes, respectively.
Fig. S4.
Fig. S4.
Sera cytokine levels. Collected serum samples were analyzed by a bead-based multiplex assay for the presence of IL-4, IL-10, IL-17, and IFN-γ. The lower limits of detection are 40 pg/mL for IL-4, 15 pg/mL for IL-10, and 10 units/mL for IL-10 and IFN-γ, respectively. Time points that tested positive for NPHV RNA and anti-CHV/NPHV NS3 antibodies are indicated in light- and dark-gray boxes, respectively.
Fig. 4.
Fig. 4.
Analysis of NPHV-specific T-cell proliferation. (A) Eight distinct but overlapping peptide pools originating from the NS3 region of NPHV were synthesized based on the NS3 reference sequence of NPHV isolate H10 (GenBank accession no. KP640276). Individual peptides were pooled with each pool containing 20 peptides consisting of 10 overlapping amino acids each. Isolated PBMCs were stimulated in duplicates with the peptide pools and incubated for 7 d at 37 °C before flow cytometry analyses. As positive control, PBMCs were stimulated with PHA. (B) Gating strategy after flow cytometry-based analysis of T-cell proliferation. Seven days postinfection, PBMCs were stained for CD3, CD4, and CD8 surface markers to gate on the respective cell population as described above. A decrease in the proliferation dye eFluor 670 indicates proliferation of the respective population. Representative plots of horse 2 at t0 and t9 are shown. The amount of proliferating CD3+CD4+ (C) and CD3+CD8+ (D) T cells was calculated by dividing the stimulated samples by the unstimulated control of each time point depicted as stimulation index (SI). The respective values of each peptide pool are indicated with a single symbol for all of the respective time points measured in duplicates. The dotted line indicates the unstimulated control. Time points that tested positive for NPHV RNA and anti-CHV/NPHV NS3 antibodies are indicated in light- and dark-gray boxes, respectively.
Fig. 5.
Fig. 5.
Homologous NPHV reinfection of horses. Horses 2 and 3 were rechallenged ∼5 mo post initial viral clearance with 100 mL homologous inoculum (GenBank accession no. KY124246, viral load 7.78 × 10⁶ RNA copies per milliliter). Serum and PBMC samples were taken on a weekly basis and stored at −20 °C/−150 °C before analysis. (A) Course of the experimental, homologous reinfection. All serum samples were analyzed for the presence of NPHV RNA and anti-CHV/NPHV NS3 antibodies, respectively. Anti-CHV/NPHV NS3 antibodies were measured by the LIPS assay in duplicates and the mean values are depicted as black squares as relative light units (RLUs). A cutoff was determined as described above and is depicted as dotted line. The value of the naïve sample represents the first serum sample taken before the initial inoculation in the first part. NPHV RNA values of horses 2 and 3 were below the detection limit at all time points (limit of quantification 50 RNA copies per serum sample). To detect trace amounts of NPHV RNA, all qRT-PCR samples were loaded on an agarose gel as shown at the Top of each graph. Positive signals in the agarose gel are highlighted in each graph by a big gray square. As control, one naïve horse was inoculated with 100 mL homologous plasma. (B) Monitoring of liver enzyme values within sera. AST, GLDH, and GGT were determined in all serum samples of horses 2 and 3. Reference values are as follows: GLDH < 6 U/l, GGT < 20 U/l, and AST < 170 U/l. (C) Three weeks postinoculation, liver biopsies were taken and stained with hematoxylin and eosin (H&E). Periportally, biopsies revealed a low number of lymphocytes and macrophages. In addition, a variable degree of coarsely granular, brown pigment within the cytoplasm of hepatocytes and macrophages was present. (Scale bars, 50 µm.)
Fig. 6.
Fig. 6.
Nonhomologous NPHV reinfection of horses. Horses 2 and 3 were rechallenged ∼5 mo after viral clearance of the homologous reinfection (1 y post initial infection) with 100 mL of a distinct inoculum (GenBank accession no. KY124248, viral load 6.0 × 10⁵ RNA copies per milliliter). Serum and PBMC samples were taken on a weekly basis and stored at −20 °C/−150 °C before analysis. (A) Phylogenetic analysis of NPHV isolates. The consensus sequence of inoculum used for the homologous infection (GenBank accession no. KY124246) and the distinct rechallenge (GenBank accession no. KY124248) were sequenced in the near complete E1E2 region and are depicted in relation to reference NPHV isolates. The evolutionary history was inferred by using the maximum likelihood method based on the general time reversible model. Depicted is the tree with the highest log likelihood; bootstrap values are indicated at tree nodes; and scale bar refers to branch lengths measured in the number of substitutions per site. (B) Course of the experimental, nonhomologous reinfection. Anti-CHV/NPHV NS3 antibodies were determined by the LIPS assay and the mean values of the duplicate samples are presented as black squares as relative light units (RLUs). The naïve sample corresponds to the t0 value before the first infection. NPHV RNA values were below the detection limit (limit of quantification 50 RNA copies per serum sample) and qRT-PCR products are visualized by separation on an agarose gel. Positive signals are indicated with a gray big square. A naïve (NPHV seronegative and RNA negative) horse was inoculated with the distinct plasma as positive control. (C) Determination of the AST, GGT, and GLDH level in the serum. Reference values are as follows: GLDH < 6 U/l, GGT < 20 U/l, and AST < 170 U/l. (D) Three weeks postinoculation, liver biopsies were taken and stained with hematoxylin and eosin. Periportally, biopsies revealed a low number of lymphocytes and macrophages. In addition, a variable degree of coarsely granular, brown pigment within the cytoplasm of hepatocytes and macrophages was present. (Scale bars, 50 µm.)
Fig. S5.
Fig. S5.
T-cell proliferation following rechallenge. Eight distinct but overlapping peptide pools originating from the NS3 region of NPHV were synthesized based on the NS3 reference sequence NS3 reference sequence of NPHV isolate H10 (GenBank accession no. KP640276). Individual peptides were pooled, with each pool containing 20 peptides consisting of 10 overlapping amino acids each. Isolated PBMCs were stimulated in duplicates with the peptide pools and incubated for 7 d at 37 °C before flow cytometry analyses. As positive control PBMCs were stimulated with PHA. PBMC were collected after (A) homologous NPHV rechallenge or (B) distinct NPHV rechallenge and T-cell proliferation was analyzed as described before. The amount of proliferating CD3+CD4+ and CD3+CD8+ T cells was calculated by dividing the stimulated samples by the unstimulated control of each time point depicted as stimulation index (SI). The respective values of each peptide pool are indicated with a single symbol for all of the respective time points measured in duplicates. The dotted line indicates the unstimulated control. Time points that tested positive for NPHV RNA are indicated in light-gray boxes.

Similar articles

Cited by

References

    1. WHO 2016 Hepatitis C: Fact Sheet no. 164. Available at www.who.int/mediacentre/factsheets/fs164/en/. Accessed February 28, 2017.
    1. Hajarizadeh B, Grebely J, Dore GJ. Epidemiology and natural history of HCV infection. Nat Rev Gastroenterol Hepatol. 2013;10(9):553–562. - PubMed
    1. Simmonds P. Genetic diversity and evolution of hepatitis C virus: 15 years on. J Gen Virol. 2004;85(Pt 11):3173–3188. - PubMed
    1. Martell M, et al. Hepatitis C virus (HCV) circulates as a population of different but closely related genomes: Quasispecies nature of HCV genome distribution. J Virol. 1992;66(5):3225–3229. - PMC - PubMed
    1. Reddy KR, et al. All-oral direct-acting antiviral therapy in HCV-advanced liver disease is effective in real-world practice: Observations through HCV-TARGET database. Alimentary Pharmacology and Therapeutics. 2017;45(1):115–126. - PubMed

Publication types

Substances

Associated data

LinkOut - more resources