. 2017 Mar 21;114(12):3192-3197.
doi: 10.1073/pnas.1619588114. Epub 2017 Mar 8.

BAP1 inhibits the ER stress gene regulatory network and modulates metabolic stress response

Affiliations

BAP1 inhibits the ER stress gene regulatory network and modulates metabolic stress response

Fangyan Dai et al. Proc Natl Acad Sci U S A. .

Abstract

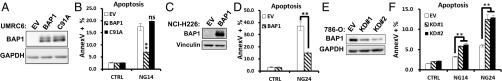
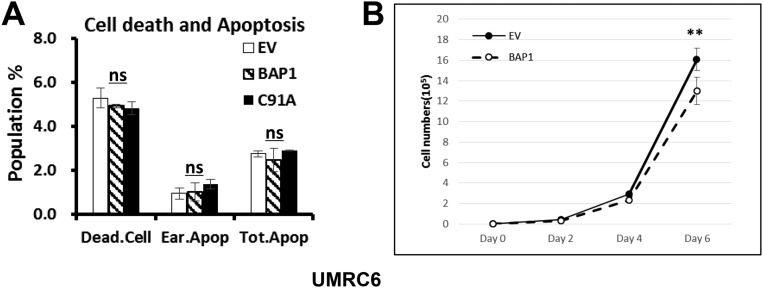
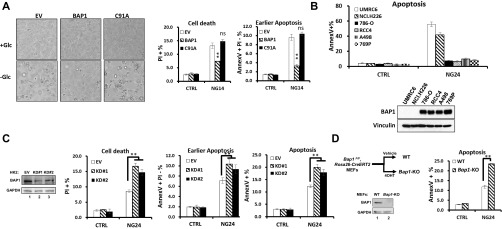
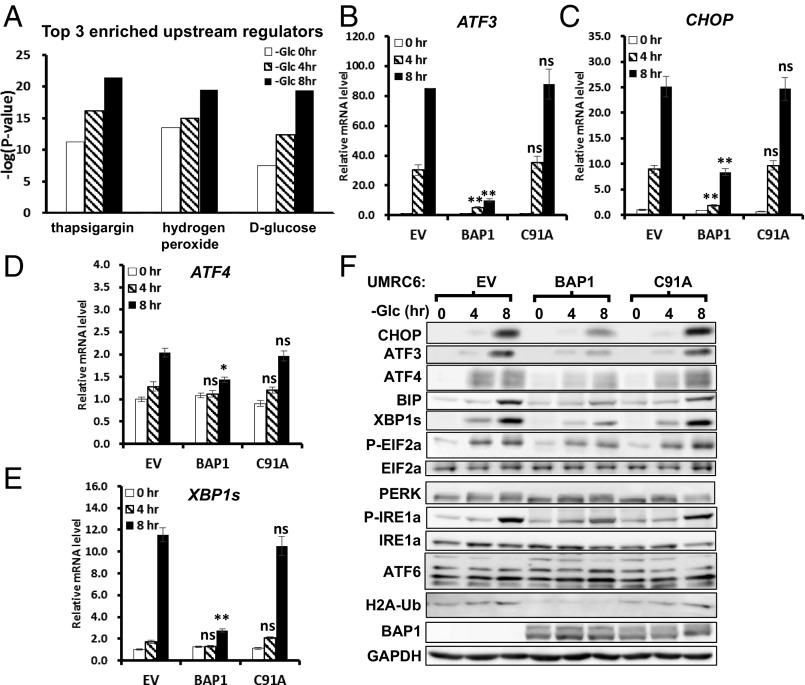
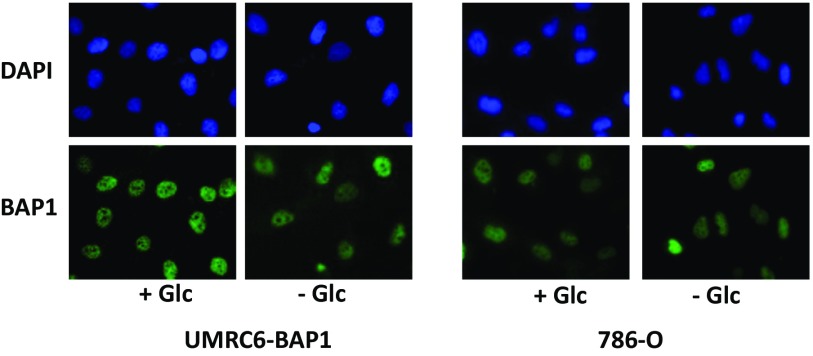
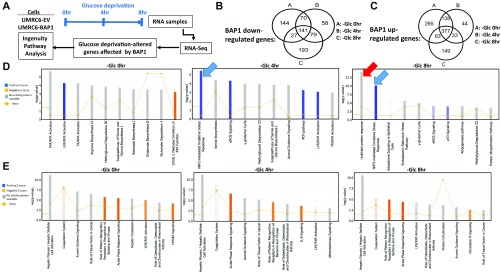
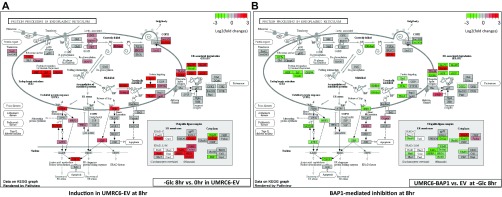
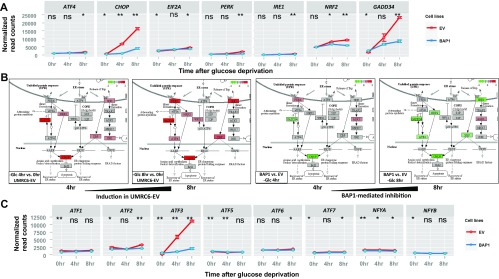
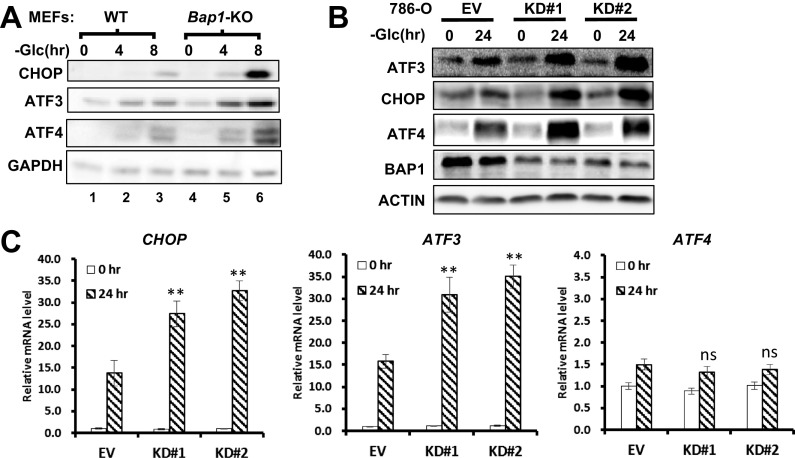
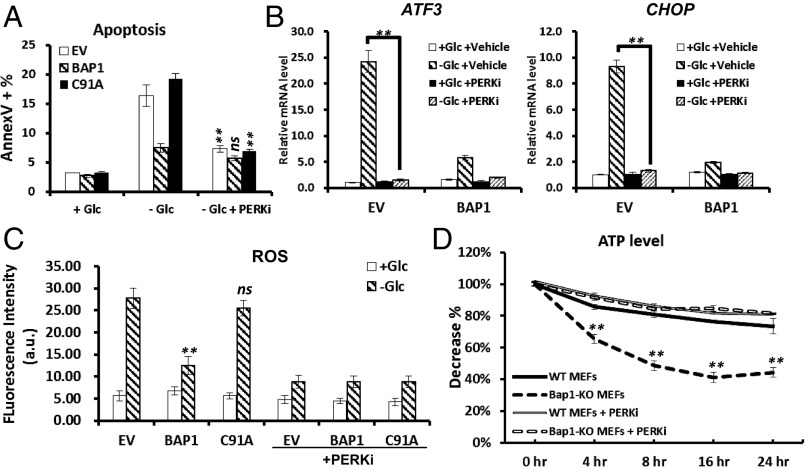
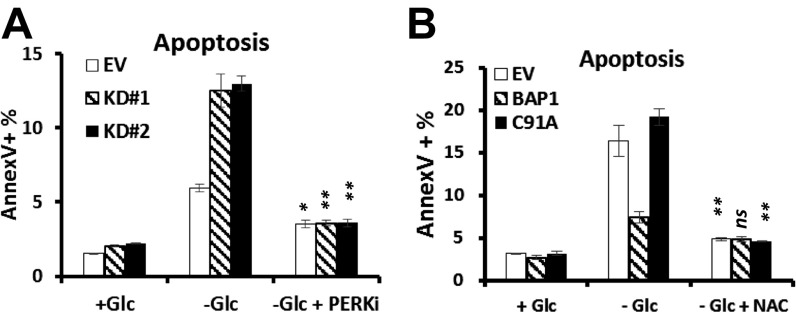
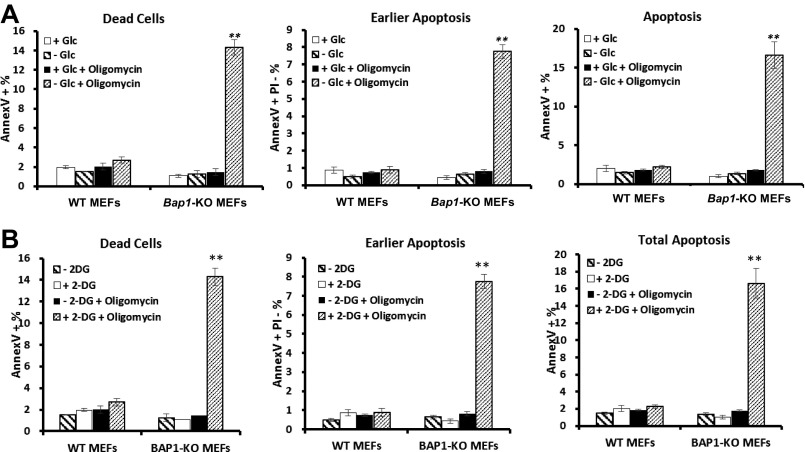
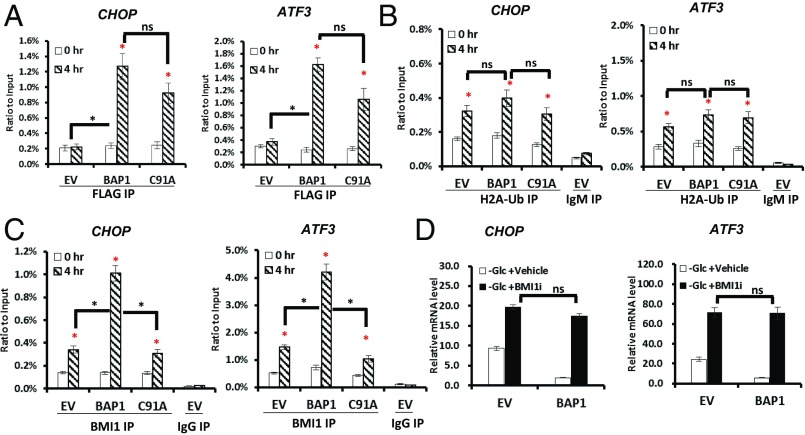
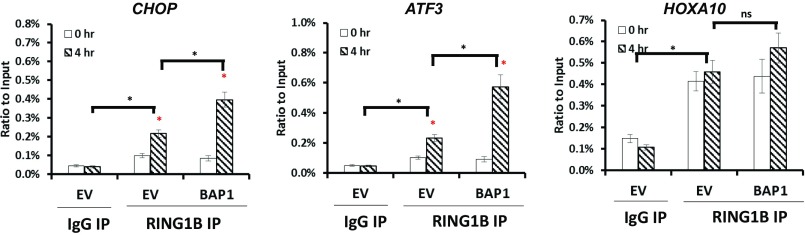
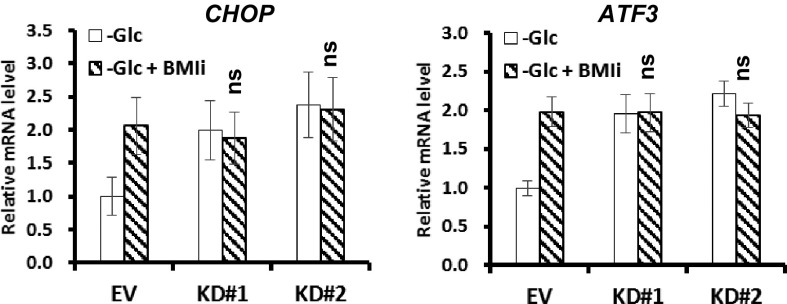
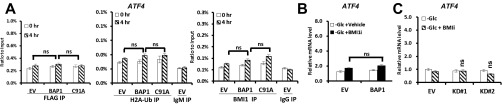
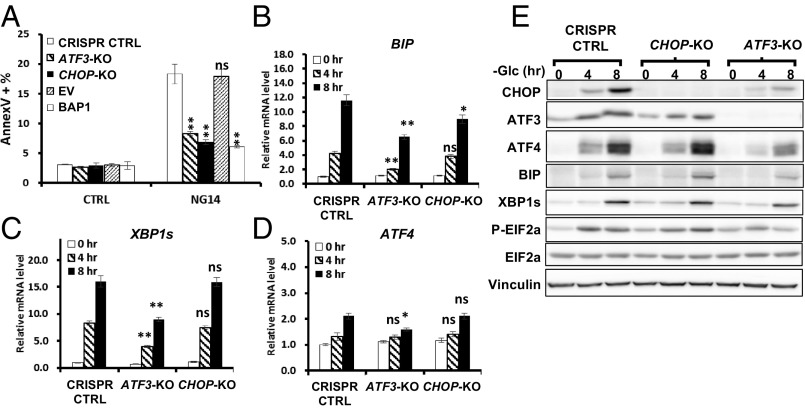
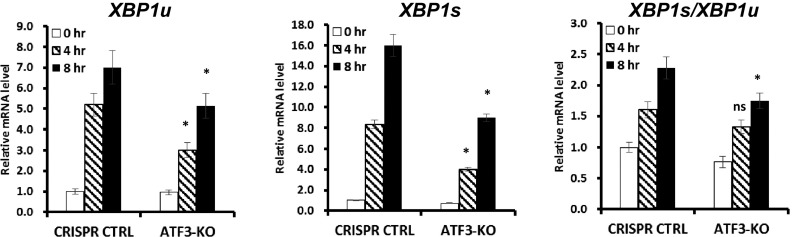
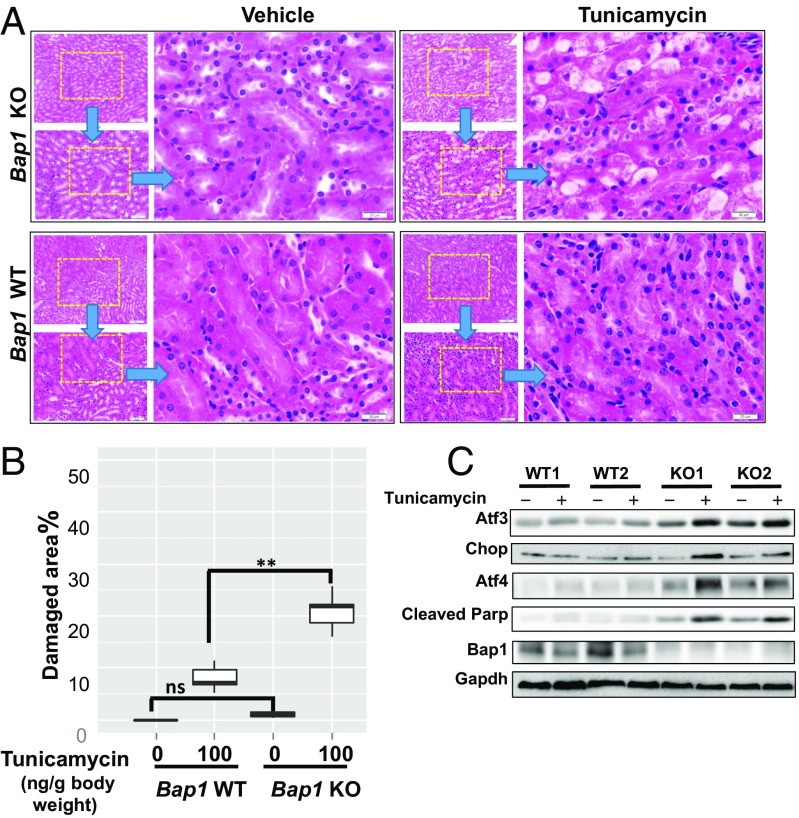
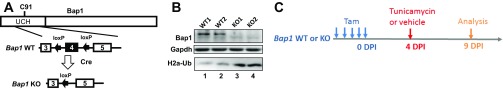
The endoplasmic reticulum (ER) is classically linked to metabolic homeostasis via the activation of unfolded protein response (UPR), which is instructed by multiple transcriptional regulatory cascades. BRCA1 associated protein 1 (BAP1) is a tumor suppressor with de-ubiquitinating enzyme activity and has been implicated in chromatin regulation of gene expression. Here we show that BAP1 inhibits cell death induced by unresolved metabolic stress. This prosurvival role of BAP1 depends on its de-ubiquitinating activity and correlates with its ability to dampen the metabolic stress-induced UPR transcriptional network. BAP1 inhibits glucose deprivation-induced reactive oxygen species and ATP depletion, two cellular events contributing to the ER stress-induced cell death. In line with this, Bap1 KO mice are more sensitive to tunicamycin-induced renal damage. Mechanically, we show that BAP1 represses metabolic stress-induced UPR and cell death through activating transcription factor 3 (ATF3) and C/EBP homologous protein (CHOP), and reveal that BAP1 binds to ATF3 and CHOP promoters and inhibits their transcription. Taken together, our results establish a previously unappreciated role of BAP1 in modulating the cellular adaptability to metabolic stress and uncover a pivotal function of BAP1 in the regulation of the ER stress gene-regulatory network. Our study may also provide new conceptual framework for further understanding BAP1 function in cancer.

Keywords: BAP1; ER stress; energy stress; glucose starvation; unfolded protein response.


Conflict of interest statement

The authors declare no conflict of interest.

Figures

Fig. 1.
Fig. 1.
BAP1 inhibits cell apoptosis induced by glucose deprivation. (A–D) The effects of reexpression of BAP1-WT or BAP1-C91A mutant on glucose deprivation-induced cell death in BAP1-deficient UMRC6 (A and B) or NCI-H226 cells (C and D). (E and F) The effect of BAP1 knockdown on glucose deprivation-induced apoptosis in 786-O cells. **P < 0.01; ns, nonsignificant. CTRL, with glucose; EV, empty vector (AD) or control shRNA (E and F). NG14/NG24, no glucose for 14 or 24 h.
Fig. S1.
Fig. S1.
The effects of reexpression of BAP1 on basal cell viability and cell proliferation in UMRC6 cells. (A) Reexpression of BAP1 and BAP1-C91A mutant did not affect basal cell viability in UMRC6 cells. UMRC6 stable cells were cultured in media containing 25 mM glucose for 48 h, stained with Annexin V-FITC and PI, and analyzed by FACS. Early apoptotic (Ear.Apop): Annexin V+/PI population; total apoptotic population (Tot.Apop): Annexin V+ population; dead cells (Dead.Cell): PI+ population. ns, nonsignificant. (B) Reexpression of BAP1 moderately inhibits the cell growth in UMRC6 cells. UMRC6 stable cells were cultured in media containing 25 mM glucose for up to 6 d, and cell number were analyzed at indicated days. **P < 0.01.
Fig. S2.
Fig. S2.
BAP1 inhibits cell apoptosis induced by glucose deprivation in different cell lines. (A) Reexpression of BAP1-WT and BAP1-C91A mutant on glucose deprivation-induced cell death in UMRC6 cells. UMRC6 stable cells cultured in growth media containing 0 mM glucose (−Glc or NG14) or 25 mM glucose (+Glc or CTRL) for 14 h were examined by microscopy (Left) or analyzed by Annexin V/PI staining followed by FACS (Right). (Magnification: 10×.) (B) The correlation of sensitivity to glucose starvation-induced cell death and BAP1 expression among different cancer cell lines. (Upper) Indicated cancer cells cultured with glucose containing or free medium for 24 h (CTRL or NG24) were analyzed by Annexin V/PI staining followed by FACS. Total apoptotic (Annexin V+) populations were shown. (Lower) BAP1 levels in these cancer cell lines were examined by Western blot. (C) BAP1 knockdown on glucose deprivation-induced apoptosis in HK2 cells. (Left) Cell lysates from HK2 cells stabling expressing control shRNA (EV) or two independent BAP1-targeting shRNAs (KD#1, and KD#2) were examined by Western blot. (Right) HK2 stable cells cultured with glucose containing or free medium for different hours were assayed for cell apoptosis by FACS. (D) The effect of Bap1 deletion on glucose deprivation-induced apoptosis in primary MEFs. (Left) Cell lysates from Bap1F/F, Rosa26-CreERT2 primary MEFs treated with vehicle (WT MEFs) or 4OHT (Bap1 KO MEFs) for 7 d were examined by Western blot. (Right) MEFs cultured with glucose containing or free medium for 24 h (CTRL or NG24) were assayed for cell apoptosis by FACS. **P < 0.01; ns, nonsignificant.
Fig. 2.
Fig. 2.
BAP1 targets the ER stress gene network under glucose deprivation. (A) Top three enriched upstream regulators (as indicated on x axes) from IPA comparison analysis. (B–F) The effect of BAP1 or BAP1-C91A reexpression on glucose deprivation-induced UPR effectors in UMRC6 cells analyzed by real-time qPCR (B–E) and Western blotting (F). *P < 0.05; **P < 0.01; ns, nonsignificant.
Fig. S3.
Fig. S3.
The effect of glucose deprivation on BAP1 subcellular localization. UMRC6-BAP1 stable cells or 786-O cells were cultured in the growth media with (+Glc) or without (−Glc) 25 mM glucose for 4 h; cells were then fixed and assayed by immunofluorescence using anti-BAP1 antibody. DAPI staining indicated the nucleus. (Magnification: 10×.)
Fig. S4.
Fig. S4.
RNA-Seq analysis of the up-/down-regulated genes and Pathways affected by BAP1 upon glucose stress. (A) Schematic diagram of RNA-Seq experiment design and analysis workflow. (B and C) The numbers of significantly altered genes [(B) BAP1 down-reglated genes; (C) BAP1 up-regulated genes (≥twofold difference)] at 0, 4, or 8 h after glucose deprivation in UMRC6 cells are indicated in Venn diagram. (D and E) The cellular pathways enriched upon BAP1 expression at each time point are indicated: (D) enriched pathways among BAP1-downreglated genes; (E) enriched pathways among BAP1 up-regulated genes. Arrows indicate UPR and oxidative stress response-related pathways.
Fig. S5.
Fig. S5.
BAP1 inhibits glucose deprivation-induced UPR gene regulatory network activation. Genes belonging to the Protein processing in ER pathway (KEGG: ko04141; www.genome.jp/dbget-bin/www_bget?pathway+ko04141) were plotted in pseudocolor indicative of its mRNA fold-changes (log2-transformed) on top of the pathway diagrams. Red: 2–8+ fold up-regulation; gray: less than twofold alteration; green: 2–8+ fold down-regulation. (A) Eight-hour glucose deprivation-induced UPR gene changes in UMRC6-EV cells. (B) Upon 8-h glucose deprivation, BAP1-affected UPR gene changes.
Fig. S6.
Fig. S6.
The effect of BAP1 on glucose starvation-induced UPR gene expression. (A) The expression levels of various UPR effectors were plotted using normalized read counts from RNA-Seq dataset. (B) BAP1 inhibits glucose starvation-induced UPR genes implicated in ER-nucleus signal cascades. The diagrams were prepared from the same Pathview analysis as shown Fig. 2C. (C) The expression levels of various secondary UPR TFs were plotted using normalized read counts from RNA-Seq dataset. *P < 0.05; **P < 0.01; ns, nonsignificant.
Fig. S7.
Fig. S7.
The effect of BAP1 deficiency on glucose deprivation-induced UPR effectors. (A) The effects of Bap1 deletion on UPR effector activation induced by glucose deprivation in MEFs were examined by Western blot. (B and C) The effect of BAP1 knockdown on glucose deprivation-induced UPR effectors in 786-O cells at 24 h was assayed by Western blot (B) and real-time qPCR (C). **P < 0.01; ns, nonsignificant.
Fig. 3.
Fig. 3.
BAP1 inhibits UPR-mediated ROS induction and ATP depletion. (A) The effect of PERK inhibitor on glucose deprivation-induced apoptosis in UMRC6 stable cells. (B) The effect of PERK inhibitor on glucose deprivation-induced UPR effectors in UMRC6 stable cells. (C) The effect of reexpression of BAP1 and BAP1-C91A mutant on glucose deprivation-induced ROS in UMRC6 stable cells. (D) The effect of Bap1 deletion on glucose deprivation-induced ATP depletion in MEFs. **P < 0.01; ns, nonsignificant.
Fig. S8.
Fig. S8.
The effects of PERKi and NAC treatment on glucose starvation-induced cell death. (A) The effect of PERK inhibitor on glucose deprivation-induced apoptosis in 786-O stable cells. 786-O stable cells were cultured in glucose-free medium with 5-nM PERK inhibitor (−Glc +PERKi) or vehicle (−Glc) for 24 h, then assayed for cell apoptosis by FACS. (B) The effect of antioxidant NAC on glucose deprivation-induced apoptosis in UMRC6 stable cells. Cells were cultured in glucose-free medium with 5 nM NAC (−Glc +NAC) or vehicle (−Glc) for 14 h, then assayed for cell apoptosis by FACS. *P < 0.05; **P < 0.01; ns: nonsignificant.
Fig. S9.
Fig. S9.
The effect of Bap1 deletion on energy stress-induced apoptosis in MEFs. (A) Bap1 WT and KO MEFs were cultured in 25 mM or 0 mM glucose medium with or without 1 mM oligomycin treatment for 4 h, then assayed for apoptosis by FACS. (B) Bap1 WT and KO MEFs cultured in 25 mM glucose medium were treated with 20 mM 2-DG and 1 mM oligomycin, either alone or in combination, for 4 h, then assayed for apoptosis by FACS. Early apoptotic cells: Annexin V+/PI population; Total apoptotic cells: Annexin V+ population; Dead cells: PI+ population; **P < 0.01; ns, nonsignificant.
Fig. 4.
Fig. 4.
BAP1 directly represses ATF3 and CHOP transcription in a manner dependent on BMI1. (A–C) Glucose deprivation-induced binding of BAP1 (A), H2A-Ub (B), or BMI1 (C) to the promoters of CHOP and ATF3 in UMRC6 cells. (D) The effect of BMI1 inhibitor on glucose deprivation-induced UPR TFs in UMRC6 stable cells. *P < 0.05; ns, nonsignificant. Red asterisks indicate the comparison between glucose deprivation for 0 and 4 h in each cell line.
Fig. S10.
Fig. S10.
RING1B ChIP analysis of CHOP and ATF3 genes. UMRC6 stable cells were cultured in glucose-free medium for 0 or 4 h, then assayed by ChIP using anti-RING1B antibody. The level of enriched promoters was examined by qPCR using primers specific for ATF3 and CHOP. HOXA10, a known BAP1 target gene, was also examined in the parallel RING1B ChIP analysis. *P < 0.05; ns, nonsignificant. Red asterisks indicate the comparison between glucose deprivation for 0 and 4 h under each condition.
Fig. S11.
Fig. S11.
The effect of BMI1 inhibitor on glucose deprivation-induced UPR TFs. 786-O stable cells were cultured in glucose-free medium with vehicle or 5 nM BMI1 inhibitor PTC-209 (BMI1i) for 24 h, gene expression was then analyzed using real-time qPCR. ns, nonsignificant.
Fig. S12.
Fig. S12.
BAP1 does not bind on ATF4 promoter. (A) UMRC6 stables cell were cultured in glucose-free medium for 4 h, then assayed by ChIP using anti-FLAG (for BAP1), anti–H2A-Ub, or anti-BMI1 antibody. The level of enriched promoters was examined by qPCR using primers specific for each promoter. (B and C) The effect of BMI1 inhibitor on the expression of ATF4. UMRC6 (B) or 786-O (C) stable cells were cultured in glucose-free medium with vehicle or 5 nM BMI1 inhibitor PTC-209 (BMI1i) for 4 or 24 h, ATF4 gene expression was then analyzed using real-time qPCR.
Fig. 5.
Fig. 5.
BAP1 modulates metabolic stress-induced UPR and apoptosis through ATF3 and CHOP. (A) The effects of ATF3 KO, CHOP KO and BAP1 reexpression on the glucose deprivation-induced apoptosis in UMRC6 cells. (B–E) The effect of ATF3 KO or CHOP KO on glucose deprivation-induced UPR effectors in UMRC6 cells analyzed by real-time qPCR (B–D) or Western blot (E). *P < 0.05; **P < 0.01; ns, nonsignificant.
Fig. S13.
Fig. S13.
Real-time PCR analysis of the effect of ATF3 depletion on glucose starvation- induced XBP1 transcription and splicing. The effect of ATF3 deletion in UMRC6 cells on glucose deprivation-induced XBP1u (unspliced form) and XBP1s (spliced form), as well as the ratio XBP1s/XBP1u, was assayed by real-time qPCR. *P < 0.05; ns, nonsignificant.
Fig. 6.
Fig. 6.
Bap1 KO mice are more sensitive to tunicamycin treatment. (A) Histology analysis of kidneys from Bap1 WT and KO mice with or without tunicamycin treatment. (Scale bars: Upper Insets, 200 μm; Lower Insets, 50 μm; Right, 20 μm.) (B) Box plot of relative quantification of tunicamycin-induced kidney damages in Bap1 WT and KO mice. **P < 0.01; ns, nonsignificant. (C) Western blot analysis of kidneys from Bap1 WT and KO mice with or without tunicamycin treatment.
Fig. S14.
Fig. S14.
Generation and analysis of Bap1-deficient mice. (A) Schematic diagram of the generation of Bap1 KO alleles. Positions of Bap1 coding exons 3–5 as well as loxP recombination sites in Bap1 WT or Bap1 KO allele after Cre-mediated loxP recombination are indicated. (B) Tamoxifen-induced Bap1 deficiency in mice kidneys; 21 d after tamoxifen (Tam) injection, protein lysates were prepared from two pairs of representative Bap1 WT and KO mouse kidneys, and examined by Western blot. (C) Schematic diagram of tunicamycin treatment and kidney analysis in Bap1 WT and KO mice. Four days after tamoxifen injection, Bap1 WT and KO mice received a single dosage of tunicamycin (100 ng/g body weight). Five days later, mice kidneys were collected, stained with H&E and examined.
Fig. S15.
Fig. S15.
Western blot analysis of global H2A-Ub level upon tharpsgagin treatment in UMRC6-EV and UMRC6-BAP1 cells. Indicated UMRC6 stable cells treated with 1 μm tharpsigargin for 8 h. The lysates were collected and examined by Western blot using indicated antibodies. Vinculin (VCL) was used as loading control.
Fig. S16.
Fig. S16.
Coimmunoprecipitation analysis of the association of BAP1 with OGT, HCF1, and BMI1. Cell lysates of UMRC6-BAP1 cells that had been cultured in glucose free medium for 0 or 4 h were subjected to the immunoprecipitation using anti-FLAG (for BAP1) antibody, then examined by Western blot using indicated antibodies.

References

    1. Green DR, Galluzzi L, Kroemer G. Metabolic control of cell death. Science. 2014;345(6203):1250256. - PMC - PubMed
    1. Walter P, Ron D. The unfolded protein response: From stress pathway to homeostatic regulation. Science. 2012;334(6059):1081–1086. - PubMed
    1. Hetz C. The unfolded protein response: Controlling cell fate decisions under ER stress and beyond. Nat Rev Mol Cell Biol. 2012;13(2):89–102. - PubMed
    1. Marciniak SJ, et al. CHOP induces death by promoting protein synthesis and oxidation in the stressed endoplasmic reticulum. Genes Dev. 2004;18(24):3066–3077. - PMC - PubMed
    1. Ron D, Walter P. Signal integration in the endoplasmic reticulum unfolded protein response. Nat Rev Mol Cell Biol. 2007;8(7):519–529. - PubMed

Publication types

MeSH terms