Review
. 2017 Feb;7(1):88-122.
doi: 10.21037/qims.2017.02.09.

A comprehensive literatures update of clinical researches of superparamagnetic resonance iron oxide nanoparticles for magnetic resonance imaging

Affiliations
Review

A comprehensive literatures update of clinical researches of superparamagnetic resonance iron oxide nanoparticles for magnetic resonance imaging

Yì Xiáng J Wáng et al. Quant Imaging Med Surg. 2017 Feb.

Erratum in

Abstract

This paper aims to update the clinical researches using superparamagnetic iron oxide (SPIO) nanoparticles as magnetic resonance imaging (MRI) contrast agent published during the past five years. PubMed database was used for literature search, and the search terms were (SPIO OR superparamagnetic iron oxide OR Resovist OR Ferumoxytol OR Ferumoxtran-10) AND (MRI OR magnetic resonance imaging). The literature search results show clinical research on SPIO remains robust, particularly fuelled by the approval of ferumoxytol for intravenously administration. SPIOs have been tested on MR angiography, sentinel lymph node detection, lymph node metastasis evaluation; inflammation evaluation; blood volume measurement; as well as liver imaging. Two experimental SPIOs with unique potentials are also discussed in this review. A curcumin-conjugated SPIO can penetrate brain blood barrier (BBB) and bind to amyloid plaques in Alzheime's disease transgenic mice brain, and thereafter detectable by MRI. Another SPIO was fabricated with a core of Fe3O4 nanoparticle and a shell coating of concentrated hydrophilic polymer brushes and are almost not taken by peripheral macrophages as well as by mononuclear phagocytes and reticuloendothelial system (RES) due to the suppression of non-specific protein binding caused by their stealthy ''brush-afforded'' structure. This SPIO may offer potentials for the applications such as drug targeting and tissue or organ imaging other than liver and lymph nodes.

Keywords: MR angiography, sentinel lymph node; Superparamagnetic resonance iron oxide; contrast agent; lymph node metastasis; magnetic resonance imaging (MRI); superparamagnetic iron oxide (SPIO).


Conflict of interest statement

Conflicts of Interest: JM Idée is an employee of Guerbet group, France. Guerbet group manufactures and markets a number of contrast agents for diagnostic and interventional imaging. And other author has no conflicts of interest to declare.

Figures

Figure 1
Figure 1
Schematic representation of (A) spinal crystal structure for SPIO domain, (B) SPIO crystal with multiple magnetic domains of random orientation and (C) complete SPIO contrast agent particle, with multiple SPIO crystals and coating materials. (D) SPIO crystal in the absence of an external magnetic field, the orientation of the magnetic domains is random. (E) An external magnetic field (B0) causes the magnetic domains of the SPIO crystal to reorient according to B0, which is reversible after the Bo is removed. SPIO, superparamagnetic iron oxide.
Figure 2
Figure 2
Superparamagnetic property of SPIO. (A) Homogeneous SPIO particle homogeneous suspension in a vial; (B) SPIO particles are attracted by a magnet placed close to one side wall of a vial; (C) after the remove of the external magnet, the SPIO particles can be homogeneously dispersed again, with no residual magnetic property. SPIO, superparamagnetic iron oxide.
Figure 3
Figure 3
A picture of Sienna plus® and its detector Sentimag® (Copyright: Endomagentics Ltd).
Figure 4
Figure 4
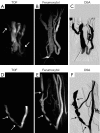
Comparison of TOF MR angiography, ferumoxytol enhanced MR angiography, and X-ray digital DSA. (A-C) MIP images of radiocephalic wrist fistula (1 month after surgery). TOF MIP image shows low signal intensity in the arterial inflow and side branch on the venous outflow (arrows); these regions are clearly depicted on the ferumoxytol-enhanced MR angiography MIP image. Note that the TOF coverage of the vascular anatomy is only half the coverage of the ferumoxytol-enhanced MR angiogram. Absence of stenosis was confirmed by using DSA; (D-F) MIP images of brachiocephalic elbow fistula (8 months after surgery). TOF MIP image illustrates two stenotic regions (arrows). Ferumoxytol-enhanced MR angiography MIP image shows three stenotic regions, two distal to the anastomosis (arrows) and one proximate that appears occluded (*). Note the improved volume coverage of the ferumoxytol-enhanced MR angiography that enables detection of stenosis missed at TOF imaging. All three stenotic regions were confirmed on DSA image [Reprinted with permission (49)]. MIP, maximum intensity projection; TOF, time of flight; DSA, digital subtraction angiography.
Figure 5
Figure 5
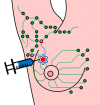
Schematic representation of the sentinel lymph node localization procedure, showing the peritumoral injection site, and tracer travelling to two sentinel lymph nodes which can be biopsied and further evaluated for histopathologically.
Figure 6
Figure 6
Three-dimensional CT lymphography reconstructed from the first post-iodinated contrast images (A). Iodinated contrast agent is injected intradermally into the skin overlying the breast tumor and the subareolar skin. Lymphatic vessels are drained into a single axillary sentinel node (arrow, A). Images of CT lymphography (B) and T2*-weighted axial MR images (C) at the same level are compared to specify the node (arrow) on T2*-weighted axial MRI corresponding to the sentinel node (arrow) identified by CT lymphography. If necessary, images of CT lymphography and T2*-weighted axial MR images can be merged on a workstation (D) [Reprinted with permission (53)].
Figure 7
Figure 7
Resovist enhanced MRI demonstrates metastasis negative and positive lymph nodes. (A) CT lymphography demonstrates a sentinel node (arrow); (B) the corresponding node is identified on pre-SPIO-contrast T2*-weighted axial MRI (arrow), showing high signal intensity; (C) after administration of SPIO, the node shows strong SPIO enhancement and was diagnosed as benign (arrow); (D) histologic findings confirmed it as benign; (E) CT lymphography demonstrates a sentinel node (arrow); (F) the corresponding node is identified on pre-SPIO-contrast T2*-weighted axial MRI (arrow), showing high signal; (G) after administration of SPIO, the node shows no SPIO enhancement and is diagnosed as malignant (arrow); (H) histologic findings confirmed it as malignant. This node is almost entirely replaced by metastatic tissue (arrowheads) [Reprinted with permission (53)]. SPIO, superparamagnetic iron oxide; MRI, magnetic resonance imaging.
Figure 8
Figure 8
This figure shows that how small lymph nodes supposed to be benign due to their size can be malignant. Images on the left hand are pre-contrast images, while the post-ferumoxtran-10 images on the right show hypersignal intensity small lymph nodes, which is a sign of malignancies. MRI at 3T allows depiction of these small lesions with high spatial resolution [Reprinted with permission (1)]. MRI, magnetic resonance imaging.
Figure 9
Figure 9
Mismatch between gadolinium- and ferumoxtran-10 enhanced images obtained at baseline in a 23-year-old woman with active relapsing-remitting MS without disease-modifying treatment. Left, axial unenhanced T2-weighted image shows multiple hyperintense lesions. Middle, axial gadolinium-enhanced T1-weighted image shows three enhanced lesions (arrows). Right, axial T1-weighted image obtained 24–48 hours after injection of Ferumoxtran-10 shows the same three lesions along with three additional active lesions that enhanced only with ferumoxtran-10 (arrows) [Reprinted with permission (94)].
Figure 10
Figure 10
Ferumoxytol-enhanced MRI detects depict macrophage distribution in intracranial aneurysm walls. (A) T2* gradient echo MRI sequence at baseline and 24 hours postinfusion of Ferumoxytol showing early signal changes in the walls of 3 cerebral aneurysms. A1–4, corresponds with a patient a right vertebral artery aneurysm; B1–4, corresponds with a patient with a left supraclinoid internal carotid artery aneurysm; and C1–4, corresponds with a patient with a fusiform vertebrobasilar artery aneurysm). Difference images demonstrate the relative signal loss after ferumoxytol infusion. All 3 aneurysms ruptured within 6 months. (B) T2* gradient echo MRI sequence at baseline and 24 hours postinfusion of Ferumoxytol, and subtraction images showing no early signal changes in 3 aneurysms from three patients (A1–3, right internal carotid artery terminus aneurysm; B1–3, anterior communicating artery aneurysm; and C1–3, right cavernous internal carotid artery aneurysm). None of these aneurysms ruptured during the follow-up period [Reprinted with permission (109)]. MRI, magnetic resonance imaging.
Figure 11
Figure 11
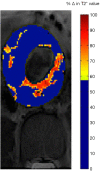
Color map of MRI of an AAA. Red and yellow pixels indicate areas of increased T2* value, indicative of USPIO uptake [Reprinted with permission (114)]. AAA, abdominal aortic aneurysm; MRI, magnetic resonance imaging.
Figure 12
Figure 12
Ferumoxytol enhanced MRI of pancreas shows increased pancreatic SPIO accumulation in patients with type-1 diabetes 3D volume sets of a representative patient with recently diagnosed type-1 diabetes (A) and a normal control subject (B). (C) Comparison of the two cohorts examined by MRI. Plots of global pancreatic delta R2* (i.e., =1/T2*) values are shown for 11 patients with type-1 diabetes and ten normal controls [Reprinted with permission (115), Copyright [2015] National Academy of Sciences of USA]. MRI, magnetic resonance imaging; SPIO, superparamagnetic iron oxide.
Figure 13
Figure 13
Combined contrast enhanced (ferumoxides and Gd-DTPA) MR images at various stages of fibrosis. Combined contrast enhanced images in adults with chronic hepatitis C virus infection and histologically determined Metavir fibrosis stages F0, F1, F2, F3, and F4. Subjectively, the reticular texture of the liver parenchyma becomes progressively more pronounced with increasing Metavir fibrosis stage [Reprinted with permission (127)].
Figure 14
Figure 14
A small (1 cm) capillary hemangioma, proven by biopsy, was located in the segment VIII; dynamic MR images after gadolinium (Gd) administration show focal faint enhancement by the lesion (white circle) only in the arterial phase (A) with no focal abnormality in portal (B) and equilibrium (C) phases (false positive finding); T2 weighted MR images before (D) and after (E) SPIO administration show homogeneous contrast distribution in the liver with diffuse hypointensity and no focal abnormalities (true negative finding) [Reprinted with permission (130)]. SPIO, superparamagnetic iron oxide.
Figure 15
Figure 15
A small (1 cm) dysplastic nodule, proven by biopsy, was located in the segment VIII; dynamic MR images after gadolinium (Gd) administration show focal faint enhancement by the lesion (white circle) only in the arterial phase (A) with no focal abnormality in portal (B) and equilibrium (C) phases (false positive finding); T2 weighted MR images before (D) and after (E) SPIO administration show homogeneous contrast distribution in the liver with diffuse hypointensity and no focal abnormalities (true negative finding) [Reprinted with permission (130)]. SPIO, superparamagnetic iron oxide.
Figure 16
Figure 16
A small (5 mm) hepatocellular carcinoma (HCC), proven by biopsy, was located in the segment VI; dynamic MR images after gadolinium (Gd) administration show no focal abnormalities in the arterial (A), portal (B) and equilibrium (C) phases (false negative finding); T2 weighted MR images before (D) and after (E) SPIO administration show diffuse liver hypointensity and focal faint hyperintensity (white circle) in the VI hepatic segment in the post-contrast MR image (E) (true positive finding) [Reprinted with permission (130)]. HCC, hepatocellular carcinoma; SPIO, superparamagnetic iron oxide.
Figure 17
Figure 17
The process of creating SS-cerebral blood volume (CBV) maps. Using pre (A) and post (B) ferumoxytol T2*-weighted (T2*w) images, deltaR2* (=1/T2*) maps (C) can be calculated. deltaR2* is assumed to be linearly proportional to contrast agent concentration. Since there is no substantial extravasation of this blood pool agent, deltaR2* is derived from the intravascular compartment only and deltaR2* maps can be used as SS-CBV maps. To eliminate the noisy background caused by the logarithmic calculation, images were masked (D). The CBV maps are typically displayed with color coding (E) [Reprinted with permission (136)]. SS, steady state; CBV, cerebral blood volume.
Figure 18
Figure 18
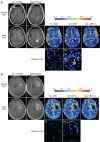
Ferumoxytol enhanced MRI facilitates differentiation between brain tumor progression and pseudoprogression. (A) MR images of a patient with glioblastoma multiforme show pseudoprogression of disease. T1-weighted MR images without contrast enhancement and with gadoteridol obtained before and 3 months after chemoradiotherapy show increased contrast enhancement after treatment. Low rCBV (<1.75) is apparent on parametric maps obtained by using ferumoxytol (Fe-rCBV), gadoteridol (Gd-rCBV), and gadoteridol with leakage correction (Gd-rCBV LC), which indicates pseudoprogression. Leakage map shows absence of contrast extravasation when ferumoxytol (Fe) was used and contrast leakage with gadoteridol (arrow); (B) MR images of a patient with glioblastoma multiforme show progression of disease. T1-weighted MR images without contrast agent and with gadoteridol (Gd) obtained before and 2 weeks after chemoradiotherapy show increased contrast enhancement after treatment. High rCBV (>1.75) is apparent on parametric maps obtained by using ferumoxytol (Fe-rCBV), gadoteridol (Gd-rCBV), and gadoteridol with leakage correction (Gd-rCBV LC), which indicates true tumor progression (arrows). No contrast agent extravasation is seen on leakage map with Fe but small leakage in the lateral aspect of the tumor is seen with gadoteridol [Reprinted with permission (140)].
Figure 19
Figure 19
Plot of liver Ferumoxytol uptake. Patients with NASH have decreased hepatic Ferumoxytol uptake, as reflected by a lower delta R2* 72 hours after Ferumoxytol infusion compared with patients with simple steatosis and healthy control subjects [Reprinted with permission (147)].
Figure 20
Figure 20
(A) Axial, (B) sagittal, and (C) coronal MP images show Ferucarbotran-labeled balloon catheter. The catheter is delineable in the 3-dimensional FOV of 20×36×36 mm3 [Reprinted with permission (150)].
Figure 21
Figure 21
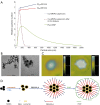
Particle size characterizations of Cur-MNP. (A) Sizes of pure SPIO and Cur-SPIO (freshly made and after 24 h dialysis) measured by dynamic light scattering analyzer; (B) TEM images of pure SPIO (left) and Cur-SPIO (right); (C) AFM images of a Cur-SPIO in morphology mode (left) and in phase difference mode (right); (D) Step-wise process of making Cur-SPIO [Reprinted with permission (154)]. SPIO, superparamagnetic iron oxide; Cur-MNP, Curcumin SPIO nanoparticles.
Figure 22
Figure 22
Iron staining, fluorescence, and immunohistochemistry reveal co-localization of SPIO and Curcumin on amyloid plaques. (A) Bright view of histochemically labeled Alzheimer’s disease transgenic mouse brain section. Immunohistochemically labeled amyloid plaques (red) and Prussian blue stained iron oxide (blue). Inset: 40× magnification of a region displaying co-localization of iron oxide with a plaque; (B) match between the black dots of 7 Tesla MRI (left) and plaques labeled immunohistochemically (red) and by Cur-SPIO (blue). Left inset: iron (blue) anchored on plaques (red). Right inset: curcumin (fluorescent) co-localization on the plaques. Insets: 100× magnification of plaques [Reprinted with permission (154)]. SPIO, superparamagnetic iron oxide.
Figure 23
Figure 23
There is a close to linear correlation between signal intensity and concentration by UTE (ultrashort TE). Whereas with gradient echo the signal intensity relationship is complex with an initial increase from T1 effects and T2* causing signal decrease at concentrations >0.2 mM [Reprinted with permission (93)].

References

    1. Wang YX, Xuan S, Port M, Idee JM. Recent advances in superparamagnetic iron oxide nanoparticles for cellular imaging and targeted therapy research. Curr Pharm Des 2013;19:6575-93. 10.2174/1381612811319370003 - DOI - PMC - PubMed
    1. Wang YX, Hussain SM, Krestin GP. Superparamagnetic iron oxide contrast agents: physicochemical characteristics and applications in MR imaging. Eur Radiol 2001;11:2319-31. 10.1007/s003300100908 - DOI - PubMed
    1. Wáng YX, Idée JM, Corot C. Scientific and industrial challenges of developing nanoparticle-based theranostics and multiple-modality contrast agents for clinical application. Nanoscale 2015;7:16146-50. 10.1039/C5NR03887A - DOI - PubMed
    1. Wang YX. Chapter 2: Superparamagnetic iron oxide particle nanoparticles for cellular imaging and targeted therapy: Opportunities and changes for clinical translation. In: Zhang B. editor. Nano Imaging: From fundamental Principles to Translational Medical Applications. Singapore: World Scientific, 2017:29-51.
    1. Wang YX. Current status of superparamagnetic iron oxide contrast agents for liver magnetic resonance imaging. World J Gastroenterol 2015;21:13400-2. 10.3748/wjg.v21.i47.13400 - DOI - PMC - PubMed