. 2017 Mar 3;3(3):e1600891.
doi: 10.1126/sciadv.1600891. eCollection 2017 Mar.

Extreme warmth and heat-stressed plankton in the tropics during the Paleocene-Eocene Thermal Maximum

Affiliations

Extreme warmth and heat-stressed plankton in the tropics during the Paleocene-Eocene Thermal Maximum

Joost Frieling et al. Sci Adv. .

Abstract

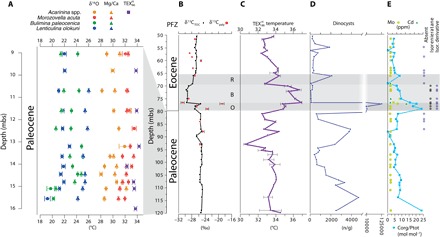
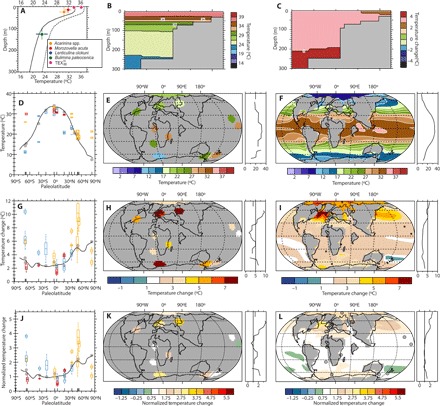
Global ocean temperatures rapidly warmed by ~5°C during the Paleocene-Eocene Thermal Maximum (PETM; ~56 million years ago). Extratropical sea surface temperatures (SSTs) met or exceeded modern subtropical values. With these warm extratropical temperatures, climate models predict tropical SSTs >35°C-near upper physiological temperature limits for many organisms. However, few data are available to test these projected extreme tropical temperatures or their potential lethality. We identify the PETM in a shallow marine sedimentary section deposited in Nigeria. On the basis of planktonic foraminiferal Mg/Ca and oxygen isotope ratios and the molecular proxy [Formula: see text], latest Paleocene equatorial SSTs were ~33°C, and [Formula: see text] indicates that SSTs rose to >36°C during the PETM. This confirms model predictions on the magnitude of polar amplification and refutes the tropical thermostat theory. We attribute a massive drop in dinoflagellate abundance and diversity at peak warmth to thermal stress, showing that the base of tropical food webs is vulnerable to rapid warming.

Keywords: PETM; Plankton; SST; Tropics; dinoflagellate; heat; heat stress; paleocence - eocene; polar amplification; temperature proxy.


Figures

Fig. 1
Fig. 1. Temperature and environment for the SQ (A) and IB10B core (B to E).
(A) SQ surface and bottom-water temperature reconstructions based on Mg/Ca (triangles), δ18O (circles) of selected foraminifer species, and TEX86H (squares). Error bars represent analytical errors. Conservative 1σ calibration errors: 1.6°C for δ18O; 1.7° and 2°C for planktonic and benthic Mg/Ca, respectively; and 2.5°C for TEX86H. (B) IB10B stable carbon isotope record of TOC (δ13CTOC) and palynological residue (δ13Cpaly). The phases of the CIE are denoted by O, B, and R for onset, body, and recovery, respectively. PFZ, planktonic foraminifer zone. (C) TEX86H-based SST (error bars based on replicate measurements). (D) Absolute concentrations of dinocysts per gram of dry sediment. Note the scale break between 4,000 and 10,000. (E) Indicators of anoxia: Organic carbon over total phosphorus ratio (Corg/Ptot) (blue squares). Presence of isorenieratene and its derivative. Concentrations of redox-sensitive trace elements Mo (light green circles) and Cd (dark green triangles) in parts per million (ppm). Note that Mo concentrations are close to the detection limit, and absolute values should be treated with caution.
Fig. 2
Fig. 2. Model-data comparison for latest Paleocene (2240 ppm) and PETM (4480 ppm) CO2 scenarios.
(A) Vertical temperature profile for the site locations. Solid and dashed lines represent latest Paleocene and PETM model estimates, respectively. Data from Fig. 1 (A and C) for comparison, including error bars for depth: Morozovella (0 to 30 m), Acarinina (0 to 50 m), TEX86H (0 m; surface), and benthic (100 to 150 m). (B) Modeled latest Paleocene temperature along an inshore-offshore transect representing the study site. (C) Modeled warming from latest Paleocene to PETM along the same transect. (D) TEX86H-derived (orange), δ18O-derived (blue), and Mg/Ca-derived (red) SSTs and modeled Paleocene meridional SST gradient (solid line). Gray dots represent point-by-point model-data comparisons. (E) Interpolated absolute SST reconstructions. (F) Modeled latest Paleocene (2240 ppm) temperatures. (G) PETM absolute SST changes and TEX86H-derived (orange), δ18O-derived (blue), and Mg/Ca-derived (red) SST changes between the latest Paleocene and the PETM. Gray dots represent point-by-point model-data comparisons. (H) Interpolated change in absolute SST. (I) Modeled SST change from the latest Paleocene to the PETM (4480 to 2240 ppm). (J) PETM SST changes, normalized to tropical (20°N to 20°S) SST changes (2.7°C) from the data and TEX86H-derived (orange), δ18O-derived (blue), and Mg/Ca-derived (red) SST changes between the latest Paleocene and the PETM. Gray dots represent point-by-point model-data comparisons. (K) SST changes from the latest Paleocene to the PETM from the data, normalized to tropical SST changes in the data (2.7°C). (L) SST changes from the latest Paleocene to the PETM, normalized to tropical SST changes in CESM1 (2.4°C). Black circles indicate site locations.

References

    1. Dickens G. R., Castillo M. M., Walker J. C. G., A blast of gas in the latest Paleocene: Simulating first-order effects of massive dissociation on oceanic methane hydrate. Geology 25, 259–262 (1997). - PubMed
    1. Sluijs A., Schouten S., Pagani M., Woltering M., Brinkhuis H., Sinninghe Damsté J. S., Dickens G. R., Huber M., Reichart G.-J., Stein R., Matthiessen J., Lourens L. J., Pedentchouk N., Backman J., Moran K., Expedition 302 Scientists , Subtropical Arctic Ocean temperatures during the Palaeocene/Eocene Thermal Maximum. Nature 441, 610–613 (2006). - PubMed
    1. Zachos J. C., Schouten S., Bohaty S., Quattlebaum T., Sluijs A., Brinkhuis H., Gibbs S. J., Bralower T. J., Extreme warming of mid-latitude coastal ocean during the Paleocene-Eocene Thermal Maximum Inferences from TEX86 and isotope data. Geology 34, 737–740 (2006).
    1. Dunkley Jones T., Lunt D. J., Schmidt D. N., Ridgwell A., Sluijs A., Valdes P. J., Maslin M., Climate model and proxy data constraints on ocean warming across the Paleocene–Eocene Thermal Maximum. Earth Sci. Rev. 125, 123–145 (2013).
    1. Sluijs A., Bijl P. K., Schouten S., Röhl U., Reichart G.-J., Brinkhuis H., Southern ocean warming, sea level and hydrological change during the Paleocene-Eocene Thermal Maximum. Clim. Past 7, 47–61 (2011).

LinkOut - more resources