. 2017 Mar 9:8:14638.
doi: 10.1038/ncomms14638.

The Shc1 adaptor simultaneously balances Stat1 and Stat3 activity to promote breast cancer immune suppression

Affiliations

The Shc1 adaptor simultaneously balances Stat1 and Stat3 activity to promote breast cancer immune suppression

Ryuhjin Ahn et al. Nat Commun. .

Abstract

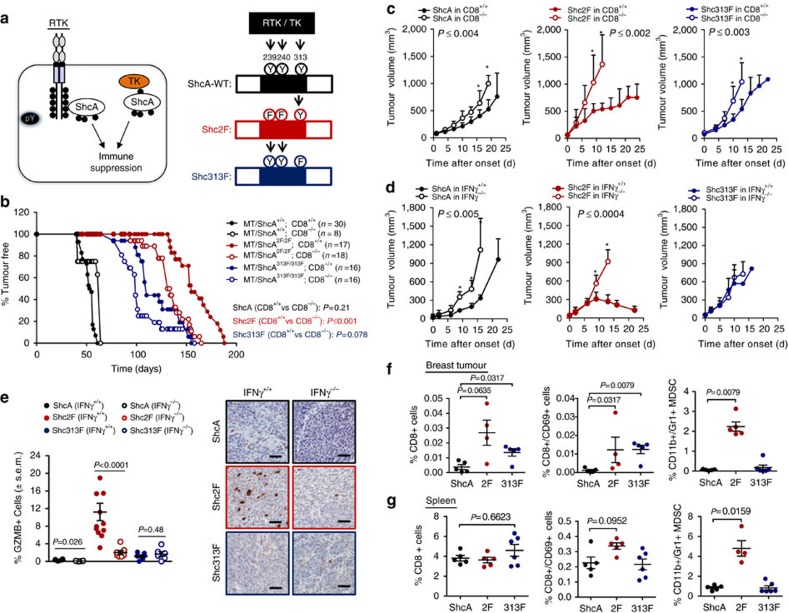
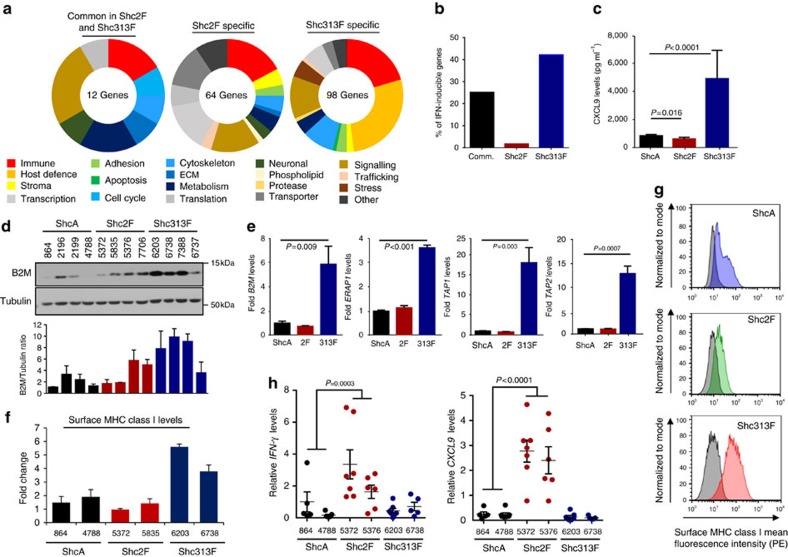
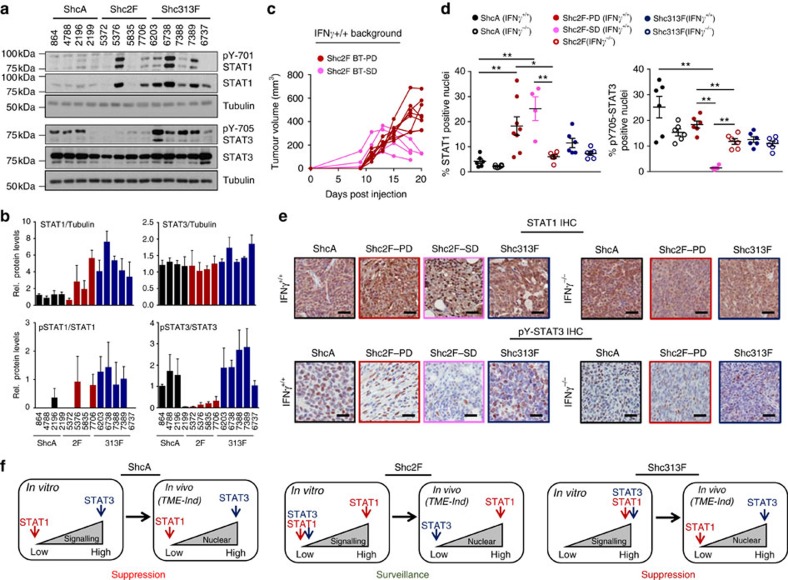
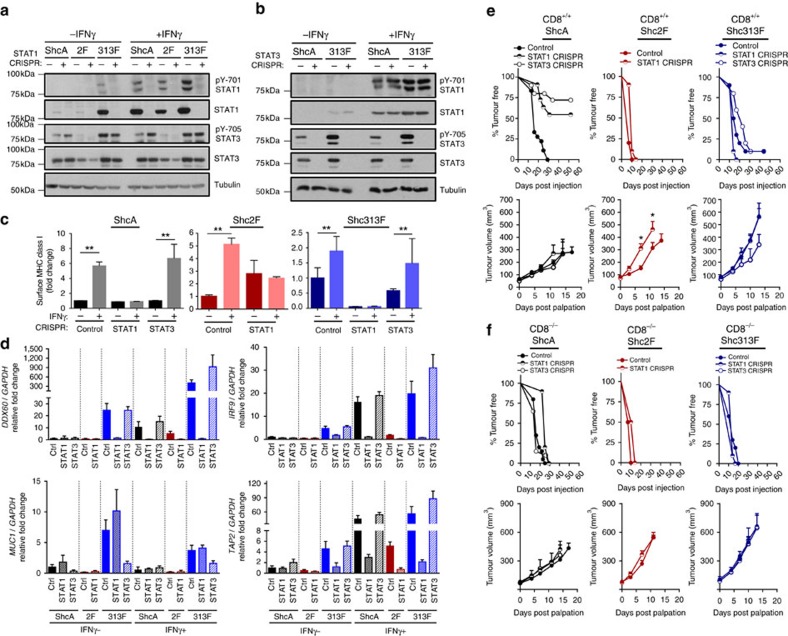
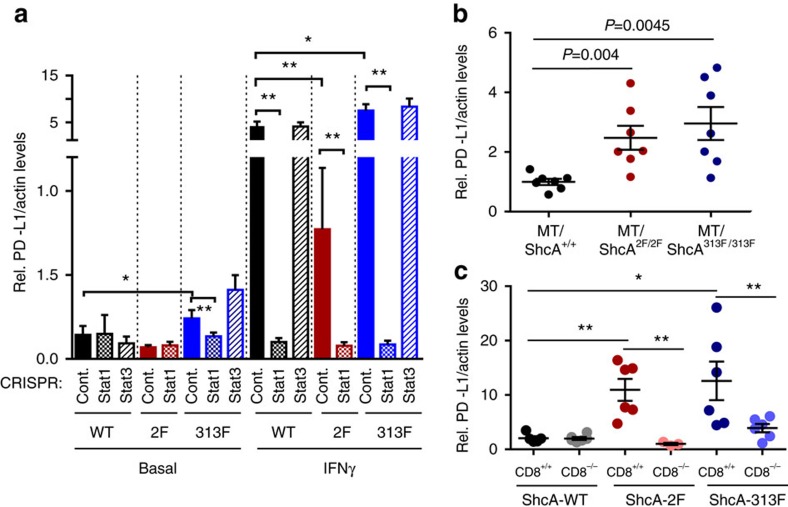
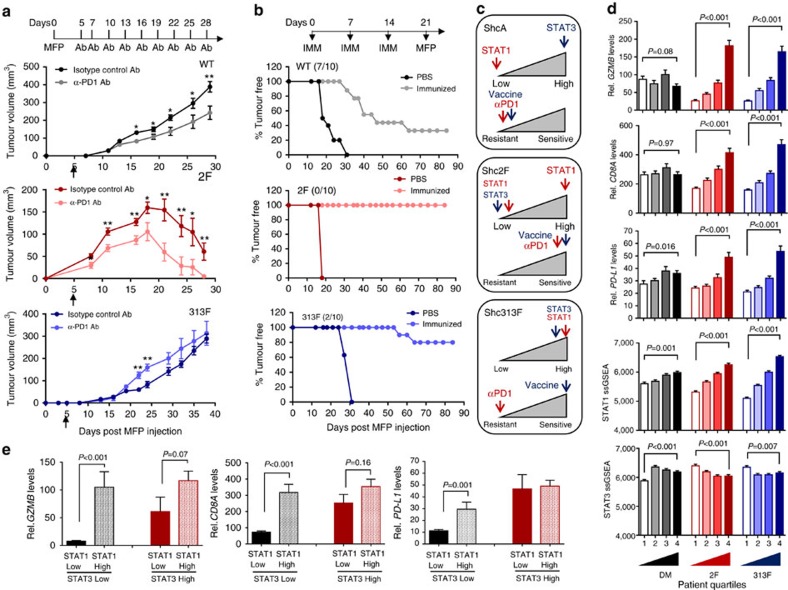
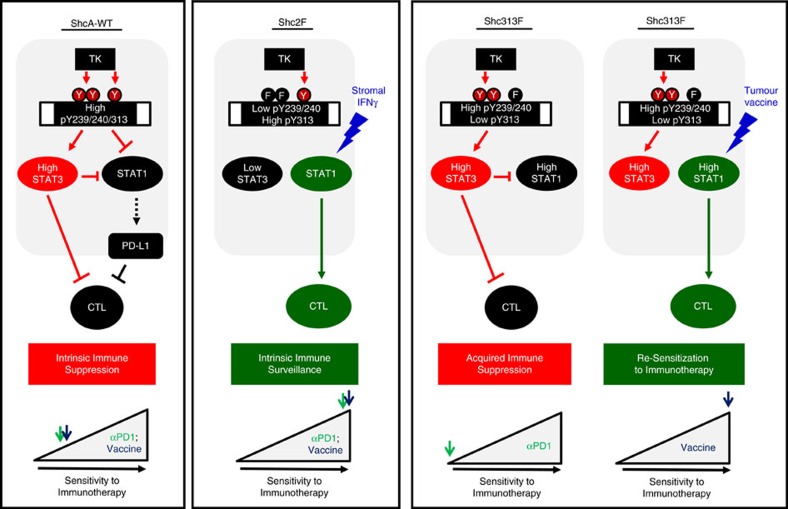
Tyrosine kinase signalling within cancer cells is central to the establishment of an immunosuppressive microenvironment. Although tyrosine kinase inhibitors act, in part, to augment adaptive immunity, the increased heterogeneity and functional redundancy of the tyrosine kinome is a hurdle to achieving durable responses to immunotherapies. We previously identified the Shc1 (ShcA) scaffold, a central regulator of tyrosine kinase signalling, as essential for promoting breast cancer immune suppression. Herein we show that the ShcA pathway simultaneously activates STAT3 immunosuppressive signals and impairs STAT1-driven immune surveillance in breast cancer cells. Impaired Y239/Y240-ShcA phosphorylation selectively reduces STAT3 activation in breast tumours, profoundly sensitizing them to immune checkpoint inhibitors and tumour vaccines. Finally, the ability of diminished tyrosine kinase signalling to initiate STAT1-driven immune surveillance can be overcome by compensatory STAT3 hyperactivation in breast tumours. Our data indicate that inhibition of pY239/240-ShcA-dependent STAT3 signalling may represent an attractive therapeutic strategy to sensitize breast tumours to multiple immunotherapies.


Conflict of interest statement

The authors declare no competing financial interests.

Figures

Figure 1
Figure 1. Phosphotyrosine-dependent ShcA signalling promotes breast cancer immune suppression.
(a) Schematic diagram illustrating engagement of TK/ShcA signalling complexes to promote immune suppression. (b) MMTV/MT transgenic mice of the indicated genotypes were evaluated for mammary tumour onset. Percentage of tumour-free mice over time. Number (n) of mice analysed is indicated. (c,d) Cell lines derived from MT-driven transgenic mammary tumours that are homozygous for WT ShcA (864) or phosphotyrosine-deficient ShcA mutants (Y313F (313F-6738)) or Y239F/Y240F (2F-5372) were injected into the fourth mammary fat pad of FVB, CD8−/− or IFNγ−/− mice. Tumour outgrowth was measured and represented as mean tumour volume (mm3)±s.e.m. (n=8–12). (e) Immunohistochemical staining of tumour tissue (n=6–12 per group) harvested from the indicated mice using Granzyme B (GZMB)-specific antibodies. The data are represented as percentage GZMB+ cells relative to total cells per field±s.e.m. Representative images are shown. Scale bars, 50 μm. (f,g) Flow cytometric analysis of immune infiltrates into MT/ShcA+/+ (864), MT/Shc2F/2F (5372) and MT/Shc313F/313F (6738) (f) tumour tissue or (g) matching spleen derived from FVB mice. Presence of CD8+ cells, CD8+CD69+ cells and CD11b+Gr1+ MDSCs (n=4–6 mice per group). The data are represented as percentage of each cell type relative to total cells analysed±s.e.m. Significance was determined by Wilcoxon's rank-sum test for eg, by multiple t-test with Holm–Sidak method for c,d (*statistically significant time points as indicated in the top left corner), and by two-tailed two sample t-test for a,b.
Figure 2
Figure 2. An intact ShcA pathway restrains IFN-driven immune responses in breast cancer cells.
(a) RNAseq was performed on cell lines derived from four independent MT/ShcA+/+, MT/Shc2F/2F and MT/Shc313F/313F mammary tumours. Genes that were significantly differentially regulated in all four cell lines were identified and stratified into three groups: 2F-specific (64 genes), 313F-specific (98 genes) or commonly differentially expressed in 2F and 313F cells relative to WT ShcA (12 genes). (b) Percentage of IFN-regulated genes identified by RNAseq (a) within each signature. (c) Average CXCL9 protein levels (ng ml−1) secreted from two independent MT/ShcA+/+, MT/Shc2F/2F and MT/Shc313F/313F breast cancer cells (n=5–6 supernatants per cell line) following a 24 h IFNγ (1 ng ml−1) stimulation as determined by ELISA (±s.d.). (d) Top: immunoblot analysis of the indicated breast cancer cell lines using B2M and Tubulin-specific antibodies. Bottom: average B2M levels, normalized to Tubulin, ±s.d., as quantified by Image J software (n=3 independent experiments). (e) Relative B2m, ERAP1, TAP1 and TAP2 mRNA levels (normalized to GAPDH) under basal conditions in MT/ShcA+/+ (864), MT/Shc2F/2F (5372) and MT/Shc313F/313F (6738) breast cancer cells. The data are shown as average fold change relative to MT/ShcA+/+ cells±s.d. (n=12 per condition from three independent experiments). (f) Surface MHC class I levels of independent MT/ShcA+/+, MT/Shc2F/2F and MT/Shc313F/313F breast cancer cell lines as determined by flow cytometry. The data are shown as average fold change relative to ShcA+/+ (864)±s.d. Representative of two independent experiments. (g) Representative histograms for surface MHC class I expression levels. Unstained control is in grey. (h) Independent MT/ShcA+/+, MT/Shc2F/2F and MT/Shc313F/313F breast cancer cell lines were injected into the mammary fat pads of FVB mice. Tumours were analysed for relative IFN-γ and CXCL9 levels (normalized to GAPDH)±s.e.m. (n=7 tumours per group). To determine significance, Mann–Whitney U-test was performed to compare MT/ShcA+/+ group (864 and 4788) with MT/Shc2F/2F (5372 and 5376) for h and two-sample t-test was performed for c,e.
Figure 3
Figure 3. Distinct ShcA-driven phosphotyrosine signalling networks differentially activate STAT3 and STAT1 signalling in breast cancer cells.
(a) Immunoblot analysis of total cell lysates from MT/ShcA+/+, MT/Shc2F/2F and MT/Shc313F/313F breast cancer cells (four to five per genotype) using STAT1, pY701-STAT1, STAT3, pY705-STAT3 and Tubulin antibodies. (b) Densitometric quantification of immunoblots using ImageJ software. The data show average fold change in expression levels (as indicated)±s.d. in the individual cell lines from three independent experiments. (c) Growth curves for individual tumour MT/Shc2F/2F (5372) mammary tumours that emerge in an immunocompetent FVB background (IFNγ+/+). Each line describes the tumour volume (mm3) of an individual breast tumour (BT) at the indicated days post injection and is representative of two independent experiments. PD, progressive disease (dark red dot), SD, stable disease (pink dot). (d) Immunohistochemical staining of mammary tumours that emerged in IFNγ+/+ or IFNγ−/− mice using STAT1- and pY705-STAT3-specific antibodies (n=6–8 tumours per genotype). The mean percentage of STAT1+ and pY705-STAT3+ stained nuclei±s.e.m. is shown. MT/Shc2F/2F tumours that displayed PD or SD phenotypes were stratified. The data are representative of two independent experiments and significance was analysed by Wilcoxon's rank-sum test (*P<0.05 and **P<0.01). (e) Representative images of STAT1- and pY705-STAT3-stained paraffin-embedded sections. Scale bars, 50 μm. (f) Schematic diagram summarizing how altered pY239/240- and pY313-ShcA signalling affect STAT1 and STAT3 activation, both in established cell lines in vitro and in mammary tumours in vivo (induced by the tumour microenvironment, TME). The consequence of the individual ShcA tyrosine phosphorylation sites on emergence of pro- or anti-tumorigenic immune responses is also shown.
Figure 4
Figure 4. The STAT3 activation status of mammary tumours dictates whether STAT1 elicits pro- or anti-tumour immune responses.
MT/ShcA+/+ (864), MT/Shc2F/2F (5372) and MT/Shc313F/313F (6738) cell lines were stably deleted of (a) STAT1, and (b) MT/ShcA+/+ (864) and MT/Shc313F/313F (6738) cells were stably deleted of STAT3 by CRISPR/Cas9 gene editing. Total cell lysates from the indicated cell lines were analysed by immunoblotting after 24 h of PBS or IFNγ (0.2 ng ml−1) treatment. Representative image of three independent experiments is shown. (c) Surface MHC class I expression levels in the indicated cell lines as assessed by flow cytometry after 24 h IFNγ treatment (0.2 ng ml−1) or PBS (control). Data represented as fold change in the geometric mean±s.d. relative to control cell lines for each genotype (n=6, two independent experiments). (d) Relative IRF9, DDX60, TAP2 and MUC1 mRNA levels, normalized to GAPDH levels in the absence (PBS) or presence (0.2 ng ml−1) of IFNγ. The data are shown as the average fold change relative to PBS-treated MT/ShcA+/+ (Control CRISPR) cells±s.d. (n=5 per group). (e,f) Mammary fat pad injection of the indicated cell lines into (e) FVB (CD8+/+) or (f) CD8−/− mice. Tumour incidence is based on the per cent tumour-free mammary glands over the indicated days post injection. The rate of tumour outgrowth is represented as mean tumour volume (mm3)±s.e.m. (n=10 tumours) (*P<0.05 and **P<0.01; unpaired two-tailed Student's t-test for c,d; one-way analysis of variance with Holm–Sidak method for e,f).
Figure 5
Figure 5. Loss of phospho-Y239/240-ShcA signalling increases PD-L1 expression on mammary tumours.
(a) Relative PD-L1 mRNA levels normalized to Actb levels were determined by RT–quantitative PCR in control, STAT1-null or STAT3-null cells of the indicated genotypes: MT/ShcA+/+ (864), MT/Shc2F/2F (5372), MT/Shc313F/313F (6738)) that were cultured in the absence (PBS) or presence (0.2 ng ml−1) of IFNγ for 24 h. Data represented as mean±s.d. (b) Relative PD-L1 mRNA levels (normalized to Actb) in mammary tumours derived from MT/ShcA+/+, MT/Shc2F/2F and MT/Shc313F/313F transgenic mice (n=7 tumours per genotype)±s.e.m. (c) Relative PD-L1 mRNA levels (normalized to Actb) in mammary tumours from CD8+/+ and CD8−/− mice injected with breast cancer cells of the indicated genotypes: MT/ShcA+/+ (864), MT/Shc2F/2F (5372) and MT/Shc313F/313F (6738). Data represented as mean±s.e.m. (n=6 tumours each) (*P<0.05 and **P<0.01; unpaired two-tailed Student's t-test for a and Wilcoxon's rank-sum test for b,c).
Figure 6
Figure 6. Distinct ShcA signalling networks differentially sensitize mammary tumours to immunotherapies.
(a) Mammary fat pad injection of FVB mice with the indicated cell lines. Starting on day 5, mice were treated with 100 μg of a neutralizing PD1 (α-PD1) antibody or its corresponding isotype control IgG and every 3 days thereafter (n=10 tumours each). Data represented as mean±s.e.m. (b) FVB mice received three intraperitoneal injections (days 0, 7 and 14) with PBS or mitomycin C-treated breast cancer cells of the indicated genotypes. On day 21, mammary fat pad injections were performed with breast cancer cells of the same genotype used for vaccination (n=9–11 mice each). (c) Schematic diagram illustrating the relationship between ShcA-driven, STAT1/STAT3 activation and sensitivity to PD1 immune checkpoint inhibitors or tumour vaccination strategies. (d) Primary breast tumours from the TCGA RNAseq data set (n=1,215) were equally stratified into four quartiles based on gene expression signatures that are either unique to loss of the Y239/240 (2F) or Y313 phosphorylation site (313F), or shared in both groups (double mutant, DM). ssGSEA was used to rank order each tumour based on acquisition of a DM, 2F or 313F-like ShcA signature. Tumours in the first quartile resemble those that possess elevated phosphotyrosine-dependent ShcA signalling, whereas those in the fourth quartile are reminiscent of the lowest degree of ShcA-dependent transcriptional responses. The average GZMB, CD8A and PD-L1 mRNA levels were evaluated in each quartile. The same tumours were stratified based on relative expression levels of STAT1 or STAT3 target genes. The average STAT1 and STAT3 ssGSEA levels were determined for tumours in each quartile. The data are shown as average expression levels±s.e.m. (comparing quartiles 1 and 4). (e) Tumours (n=320) were stratified by STAT1Low (first quartile)/STAT3Low (first quartile), n=110 or (34.4%); STAT1Low (first quartile)/STAT3High (fourth quartile), n=58 (18.1%); STAT1High (fourth quartile)/STAT3Low (first quartile), n=61 (19%); or STAT1High (fourth quartile)/STAT3High (fourth quartile), n=91 (28.4%) ssGSEA signatures. Relative GZMB, CD8A and PD-L1 expression levels are plotted (±s.e.m.). Significance was determined using multiple t-test with Holm–Sidak method for a (*P<0.05 and **P<0.01) and unpaired two-tailed Student's t-test for e,d.
Figure 7
Figure 7. Schematic representation outlining the role of how modulating the TK/ShcA axis impacts breast cancer immune suppression.
Elevated STAT3 signalling promotes immune suppression in ShcA-WT breast tumours, which suppresses STAT1-driven anti-tumorigenic immune responses. Instead, STAT1 further contributes to immune evasion by increasing PD-L1 levels in mammary tumours. As such, these tumours display a modest sensitivity to PD1 immune checkpoint blockade or tumour vaccination strategies. In contrast, loss of the phospho-pY239/240 ShcA signalling (Shc2F) significantly and specifically impairs STAT3 activation in breast cancer cells. This relieves STAT3-driven immune suppression, leading to stromally induced activation of STAT1-mediated anti-tumorigenic responses in mammary tumours, which together promote immune surveillance and significant responsiveness to anti-PD1 therapies or tumour vaccines. Finally, specific loss of pY-313 ShcA signalling (313F) directly increases STAT1 signalling in breast cancer cells, leading to a compensatory hyperactivation of STAT3 signalling. Heightened STAT3 signalling in 313F mammary tumours sustains immune evasion, leading to increased resistance to PD1 checkpoint inhibitors. Paradoxically, however, increased STAT1 signalling in these tumours increases their sensitivity to tumour vaccination strategies, owing to the heightened increase in baseline STAT1 signalling.

References

    1. Smyth M. J., Ngiow S. F., Ribas A. & Teng M. W. Combination cancer immunotherapies tailored to the tumour microenvironment. Nat. Rev. Clin. Oncol. 13, 143–158 (2016). - PubMed
    1. Borghaei H. et al.. Nivolumab versus Docetaxel in advanced nonsquamous non-small-cell lung cancer. N. Engl. J. Med. 373, 1627–1639 (2015). - PMC - PubMed
    1. Robert C. et al.. Ipilimumab plus dacarbazine for previously untreated metastatic melanoma. N. Engl. J. Med. 364, 2517–2526 (2011). - PubMed
    1. Finak G. et al.. Stromal gene expression predicts clinical outcome in breast cancer. Nat. Med. 14, 518–527 (2008). - PubMed
    1. Kristensen V. N. et al.. Integrated molecular profiles of invasive breast tumors and ductal carcinoma in situ (DCIS) reveal differential vascular and interleukin signaling. Proc. Natl Acad. Sci. USA 109, 2802–2807 (2012). - PMC - PubMed

Publication types

MeSH terms