. 2017 Mar 9:8:14687.
doi: 10.1038/ncomms14687.

TRIB2 confers resistance to anti-cancer therapy by activating the serine/threonine protein kinase AKT

Affiliations

TRIB2 confers resistance to anti-cancer therapy by activating the serine/threonine protein kinase AKT

Richard Hill et al. Nat Commun. .

Retraction in

Abstract

Intrinsic and acquired resistance to chemotherapy is the fundamental reason for treatment failure for many cancer patients. The identification of molecular mechanisms involved in drug resistance or sensitization is imperative. Here we report that tribbles homologue 2 (TRIB2) ablates forkhead box O activation and disrupts the p53/MDM2 regulatory axis, conferring resistance to various chemotherapeutics. TRIB2 suppression is exerted via direct interaction with AKT a key signalling protein in cell proliferation, survival and metabolism pathways. Ectopic or intrinsic high expression of TRIB2 induces drug resistance by promoting phospho-AKT (at Ser473) via its COP1 domain. TRIB2 expression is significantly increased in tumour tissues from patients correlating with an increased phosphorylation of AKT, FOXO3a, MDM2 and an impaired therapeutic response. This culminates in an extremely poor clinical outcome. Our study reveals a novel regulatory mechanism underlying drug resistance and suggests that TRIB2 functions as a regulatory component of the PI3K network, activating AKT in cancer cells.


Conflict of interest statement

All authors declare that there are no competing financial interests except N.L. who is an employee of Bayer AG.

Figures
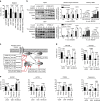
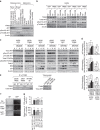
Figure 1
Figure 1. Overexpression of TRIB2 confers in vitro resistance to PI3K inhibitors.
(a) Matched isogenic TRIB2 cell line FACS analysis following exposure to BEZ235 (n=6), sc.shRNA indicates scramble shRNA while TRIB2 shRNA indicates stable shRNA knockdown for TRIB2 in each cell lines. P values are indicated for each comparison by two-way analysis of variance (ANOVA) and data represent the mean±s.d. (b) (left) Higher pro-caspase3 and reduced cleavage of caspase3 in TRIB2 overexpressing cells after treatment with BEZ235, (50 μg total protein loaded per lane and separated by 10% SDS–PAGE). (right) Densitometry for cleaved caspase3 and TRIB2 under each condition. Data normalized to actin and analysed in ImageJ. Data indicates relative mean intensity±s.e.m and analysed by two-way ANOVA. (c) Schematic showing the target specificity for each compound, the inhibitory concentration 50% (IC50) and commercial name. (d) FACS analysis of TRIB2 isogenic cell lines 72 h post exposure to various pre-clinical PI3K inhibitors (n=6). (e) Isogenic TRIB2 cell line FACS analysis 72 h post-AKT, mTOR1/2 or mTOR1 inhibition (n=6). P values are indicated for each comparison by two-way analysis of variance (ANOVA) and data represent the mean±s.d.
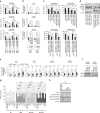
Figure 2
Figure 2. TRIB2 protein expression correlates with AKT activation status and response to PI3K inhibition.
(a) TRIB2 protein levels correlate with AKT-Ser473 phosphorylation in a broad range of model in vitro models. Representative images showing 100 μg (TRIB2), 50 μg (AKT-Ser473) total protein loaded per lane separated by 10% SDS–PAGE. sc indicates scramble shRNA within the indicated cell lines. (b) Immunoblot profiles for matched isogenic TRIB2 cell lines for the AKT signalling network. High-TRIB2 expression correlated with significantly increased post-translational modification(s) of downstream AKT targets. (c) Temporal inhibition of PI3K-dependent signalling following exposure to PI3K inhibitors. Total protein lysate of 50–200 μg was loaded per lane and separated by 6–12% SDS–PAGE. (d) FOXO3a-dependent gene expression was evaluated following 12 h treatment with PI3K inhibitors. NT indicates no treatment. *P<0.05 **P<0.01, ***P<0.005 by two-way ANOVA. Data represent the±s.d. ns indicates that the comparison was not statistically significant. (e) (left) Co-immunoprecipitation of TRIB2 or total AKT1 from indicated cell lines, (500 μg total protein lysate immunoprecipitated per lane) and separated by 8–12% SDS–PAGE. (right) Total protein levels in each indicated cell line for co-IP targets (100 μg total protein loaded per lane and separated by 8–12% SDS–PAGE). (f) Representative yellow fluorescent protein (YFP) complementation microscopy analysis assay for the assessment of the interaction between AKT1/2 and TRIB2. The leucine zipper Venus1 and Venus2 (ZIPV1-V2) constructs were used as a positive control, while the combination of TRIB3 V2 and V1 are our negative control. AKT1/2 JIP1 constructs were an additional control of a known AKT protein/protein complex. BF indicates bright field. (g) (top) Percentage of YFP positive cells determined by FACS. (bottom) Mean fluorescent intensity of YFP positive cells. One-way ANOVA with Dunnett's multiple comparison test, n=4 (*P≤0.05, **P≤0.01, ***P≤0.001). All analysis was conducted compared to zipV1trib3V2 (lane 1).
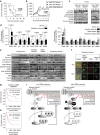
Figure 3
Figure 3. TRIB2-mediated resistance to chemotherapeutics is via AKT activation, suppressing FOXO3a and p53.
(a) Matched isogenic TRIB2 cell line FACS analysis following the knockdown of FOXO3a and subsequent exposure to BEZ235, BAY236 (copanlisib) or BAY439 (BAY1082439) (n=6). P values are indicated for each comparison by two-way ANOVA and data represent the mean±s.d. (b) Quantitative real time PCR (qRT-PCR) analysis of FOXO3a-dependent gene expression after FOXO3a knockdown and isogenic cell line treatment for 24 h with PI3K inhibitors (n=6), (*P≤0.05, **P≤0.01 and were analysed by two-way ANOVA). Data represent the mean±s.d. (c) Matched isogenic TRIB2 cell line FACS analysis after 72 h exposure to various chemotherapeutics (n=6). P values are indicated for each comparison and data represent the mean±s.d. (d) I Representative immunoblot analysis showing 50 μg (MDM2), 100 μg (MDM2-Ser166), 50 μg (p53) total protein lysate per lane separated by 6–10% SDS–PAGE. (e) p53-dependent gene expression was evaluated following TRIB2 isogenic cell line treatment with each indicated chemotherapeutic agent for 24 h. P values are shown for comparison by 2-way ANOVA (*P≤0.05, **P ≤0.001, ***P ≤0.0001) and data shown indicates mean±s.d. (f) Representative immunoblot analysis showing TRIB2 protein expression (100 μg total protein loaded per lane) following exposure to each indicated PI3K inhibitor. (g) FACS analysis of 293T cells after transfection of each TRIB2 construct and subsequent exposure to BEZ235, BAY236 (BAY 80-6946) or BAY439 (BAY1082439) (n=6) for 72 h. P values are indicated for each comparison by two-way ANOVA and data represent the mean±s.d. P values are shown for each comparison where no significant difference was noted. Data was analysed by 2-way ANOVA *P≤0.05, **P≤0.001. (h) Representative immunoblot analysis showing 50 μg (GFP), 100 μg (AKT-Ser473), 100 μg (FOXO3a-Ser253), 100 μg (MDM2-Ser166) protein expression 48 h post-transfection of the indicated GFP tagged TRIB2 plasmid constructs.
Figure 4
Figure 4. TRIB2-conferred resistance to PI3K inhibitors in vivo and ex vivo and correlates with poor clinical prognosis.
(a) Kaplan–Meier analysis of isogenic TRIB2 cell lines grow subcutaneously in NOD/Scid mice treated with vehicle (n=7), of BEZ235 (n=7). The presence of TRIB2 significantly reduced survival (log rank P=0.033) when treated daily with BEZ235. (b) TRIB2 overexpressing 293T tumours (n=7) show little to no response to daily administration of BEZ235 compared to isogenic lines with endogenous (low, n=7) TRIB2 expression. (c) Representative immunoblot analysis of key proteins of interest from in vivo treated tumours. Only three tumours were present from the 293T-empty-BEZ235 treatment group. Red line (on 293-TRIB2 treated immunoblots highlight bands from the same membrane that were spliced due to lane gaps left on the original full immunoblot. Original full membranes are provided in Supplementary Information; Supplementary Fig. 19). (d) (left panel) Quantitative real time PCR (qRT-PCR) analysis of gene expression in ex vivo metastatic melanoma samples (n=20) versus normal control tissue (n=10). Data were analysed by two-way ANOVA) and values represent the mean±s.d. (right panel), Quantitative real time PCR (qRT-PCR) analysis of gene expression in ex vivo metastatic melanoma samples (n=20) versus normal control tissue (n=10) classified by clinical response to first line chemotherapy (complete response n=5, stable disease n=5 or progressive disease n=10). Data were analysed by two-way ANOVA) *P≤0.05, **P≤0.01, ***P≤0.001) and values represent the mean±s.d. (e) Representative immunoblot analysis of the AKT signalling cascade from ex vivo metastatic melanoma samples compared to normal tissue samples. (f) Representative immunofluorecent images of metastatic melanoma dual stained for TRIB2 and pSer473-AKT1 demonstrating co-staining and interaction. (g) Kaplan–Meier analysis from melanoma patients in the GSE65904 dataset classified based on low (≥1.5 fold) or high (≥2.5 fold) TRIB2 expression. Log-rank tests reveal that TRIB2 expression is highly significant for patient prognosis with median survival for low (4,450 days) and high (394 days) expression respectively. (h) Kaplan–Meier analysis for metastasis-free survival based on low (≥1.5 fold) or high (≥2.5 fold) TRIB2 expression (i) Proposed model of TRIB2-mediated drug resistance.

References

    1. Butler E. B., Zhao Y., Munoz-Pinedo C., Lu J. & Tan M. Stalling the engine of resistance: targeting cancer metabolism to overcome therapeutic resistance. Cancer Res. 73, 2709–2717 (2013). - PMC - PubMed
    1. Berns K. et al.. A large-scale RNAi screen in human cells identifies new components of the p53 pathway. Nature 428, 431–437 (2004). - PubMed
    1. Lam E. W., Brosens J. J., Gomes A. R. & Koo C. Y. Forkhead box proteins: tuning forks for transcriptional harmony. Nat. Rev. Cancer 13, 482–495 (2013). - PubMed
    1. Brunet A. et al.. Akt promotes cell survival by phosphorylating and inhibiting a Forkhead transcription factor. Cell 96, 857–868 (1999). - PubMed
    1. Chandarlapaty S. et al.. AKT inhibition relieves feedback suppression of receptor tyrosine kinase expression and activity. Cancer Cell 19, 58–71 (2011). - PMC - PubMed

Publication types

MeSH terms