. 2017 Mar 9:7:44348.
doi: 10.1038/srep44348.

Major shifts at the range edge of marine forests: the combined effects of climate changes and limited dispersal

Affiliations

Major shifts at the range edge of marine forests: the combined effects of climate changes and limited dispersal

J Assis et al. Sci Rep. .

Abstract

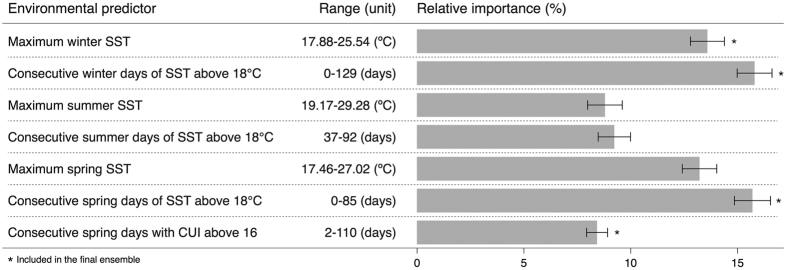
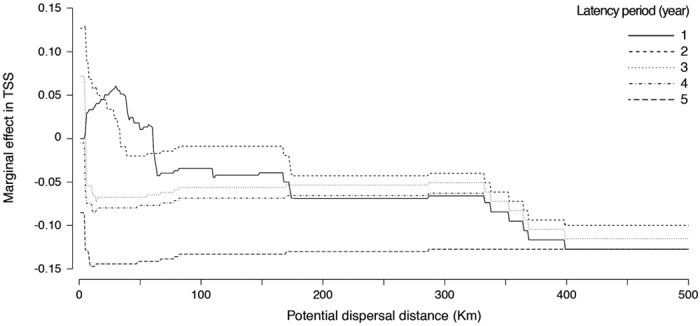
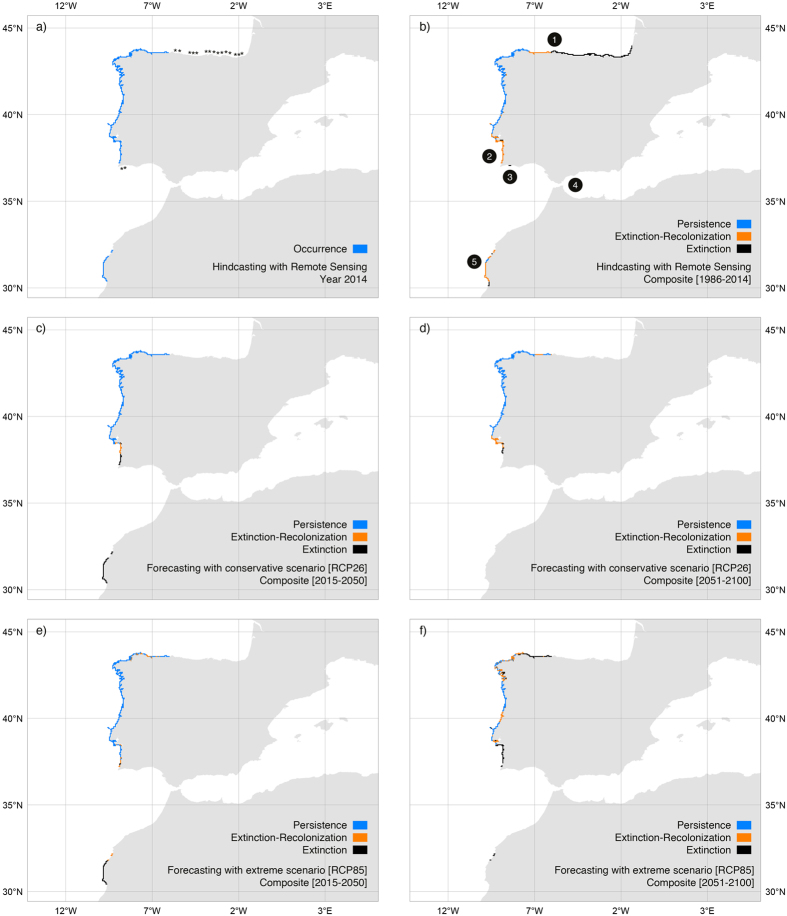
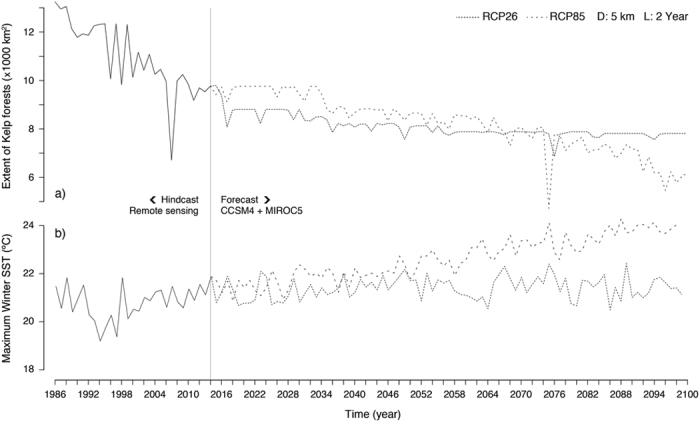
Global climate change is likely to constrain low latitude range edges across many taxa and habitats. Such is the case for NE Atlantic marine macroalgal forests, important ecosystems whose main structuring species is the annual kelp Saccorhiza polyschides. We coupled ecological niche modelling with simulations of potential dispersal and delayed development stages to infer the major forces shaping range edges and to predict their dynamics. Models indicated that the southern limit is set by high winter temperatures above the physiological tolerance of overwintering microscopic stages and reduced upwelling during recruitment. The best range predictions were achieved assuming low spatial dispersal (5 km) and delayed stages up to two years (temporal dispersal). Reconstructing distributions through time indicated losses of ~30% from 1986 to 2014, restricting S. polyschides to upwelling regions at the southern edge. Future predictions further restrict populations to a unique refugium in northwestern Iberia. Losses were dependent on the emissions scenario, with the most drastic one shifting ~38% of the current distribution by 2100. Such distributional changes might not be rescued by dispersal in space or time (as shown for the recent past) and are expected to drive major biodiversity loss and changes in ecosystem functioning.


Conflict of interest statement

The authors declare no competing financial interests.

Figures

Figure 1
Figure 1. Relative importance of each environmental predictor used for modelling the distribution of Saccorhiza polyschides (only contributions above 5% are shown; for more information please refer to Supplementary Table S2)
. Name of predictors (SST - Sea Surface Temperature; CUI - Coastal Upwelling Index; Winter: NDJF; Spring: MAMJ; Summer: JAS), range in the study region, units and mean relative contribution to the accuracy of models (asterisks show predictors included in the final ensemble) are shown.
Figure 2
Figure 2. Simulation of the effect of potential dispersal distance (step 1 km) and latency period (step 1 year) on the marginal value of True Skill Statistics (TSS), starting from a state of no dispersal and no latency capacity.
Figure 3
Figure 3. Accuracy of hindcasting (1986–2014) given by sensitivity (true presence rate) and specificity (true absence rate).
Dark grey bars show the independent historical records outside the training window of the models (i.e., ground-truthing data). Amount of occurrence data (presences or absences) shown in parenthesis (asterisks indicate the years with no data). Horizontal dotted line depicting the 0.9 threshold.
Figure 4
Figure 4. Distribution of Saccorhiza polyschides in Iberia-Morocco predicted with remote sensing data (period 1986–2014) and AOGCMs data (period 2015–2100, under two scenarios of greenhouse gas emissions.
RCP26 and RCP8.5). (Panel a) Predicted distribution in 2014 and sites (asterisks) where the species occurred in the past but our most recent surveys (years 2010 and 2012) failed to record it. Areas of persistence, extinction and extinction followed by recolonization for the periods (panel b) 1986–2014, (panels c,e) 2015–2050 and (panels d,f) 2051–2100. The reconstruction of distributions integrated a dispersal distance of 5 km and latency period of 2 years. Numbers represent Regions Of Interest: ROI 1: Cabo de Peñas; ROI 2: Carrapateira; ROI 3: Lagos; ROI 4: Tarifa; ROI 5: western Morocco. Maps generated with QGIS (QGIS Development Team, 2016. QGIS Geographic Information System. Open Source Geospatial Foundation Project. http://www.qgis.org/).
Figure 5
Figure 5
(Panel a) Extent of Saccorhiza polyschides in Iberia-Morocco predicted with remote sensing data (period 1986–2014) and AOGCMs data (period 2015–2100, under two scenarios of greenhouse gas emissions; RCP26 and RCP8.5). The models integrated a dispersal distance (D) of 5 km and a latency period (L) of 2 years. (Panel b) Variation of the maximum winter sea surface temperature (SST) averaged for Iberia-Morocco (for additional environmental predictors please refer to Supplementary Figure S5).

Similar articles

Cited by

References

    1. Chen I. C., Hill J. K., Ohlemüller R., Roy D. B. & Thomas C. D. Rapid range shifts of species associated with high levels of climate warming. Science 333, 1024–1026 (2011). - PubMed
    1. Bellard C., Bertelsmeier C., Leadley P., Thuiller W. & Courchamp F. Impacts of climate change on the future of biodiversity. Ecol. Lett. 15, 365–377 (2012). - PMC - PubMed
    1. Hampe A. & Petit R. J. Conserving biodiversity under climate change: The rear edge matters. Ecol. Lett. 8, 461–467 (2005). - PubMed
    1. Hoegh-Guldberg O. & Bruno J. F. The impact of climate change on the world’s marine ecosystems. Science 328, 1523–1528 (2010). - PubMed
    1. Steneck R. S. et al.. Kelp forest ecosystems: biodiversity, stability, resilience and future. Environ. Conserv. 29, 436–459 (2002).

Publication types