. 2017 Mar 9:7:43992.
doi: 10.1038/srep43992.

The human mitochondrial transcription factor A is a versatile G-quadruplex binding protein

Affiliations

The human mitochondrial transcription factor A is a versatile G-quadruplex binding protein

Sébastien Lyonnais et al. Sci Rep. .

Erratum in

Abstract

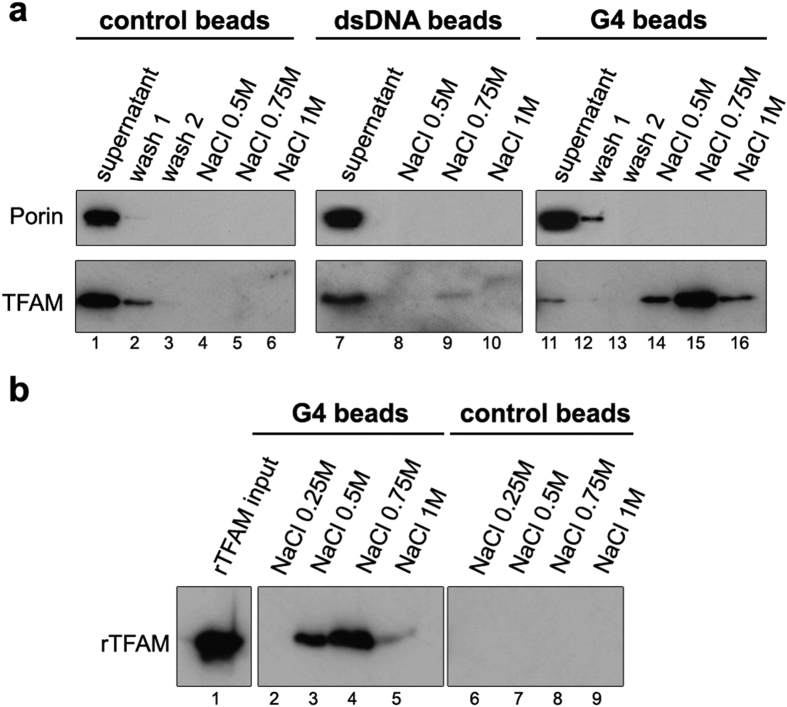
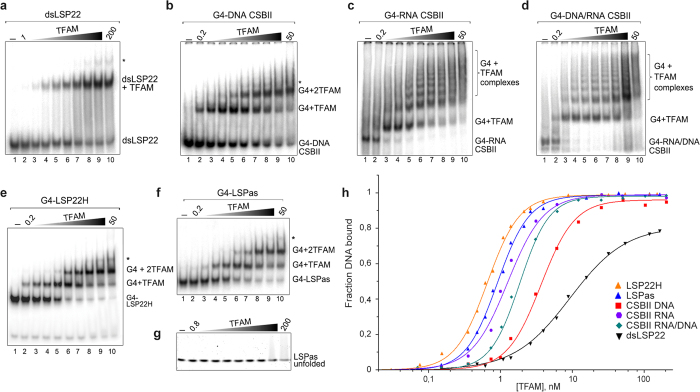
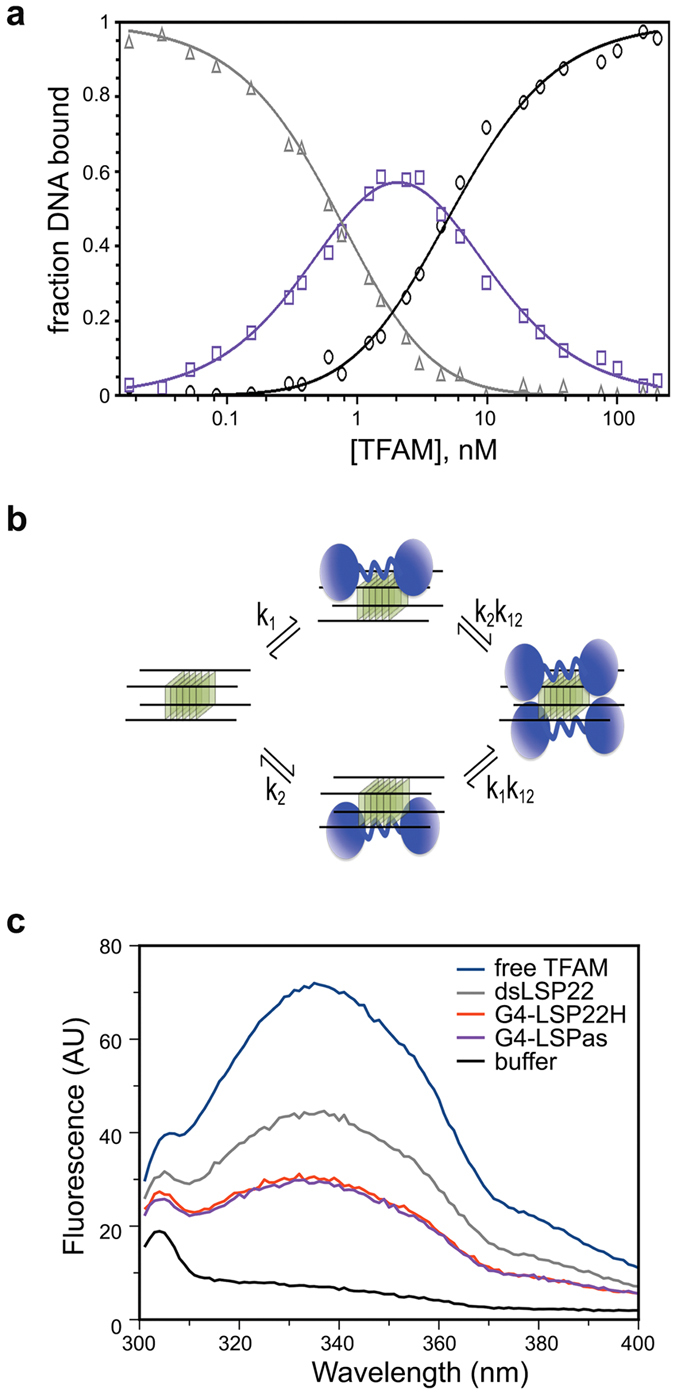
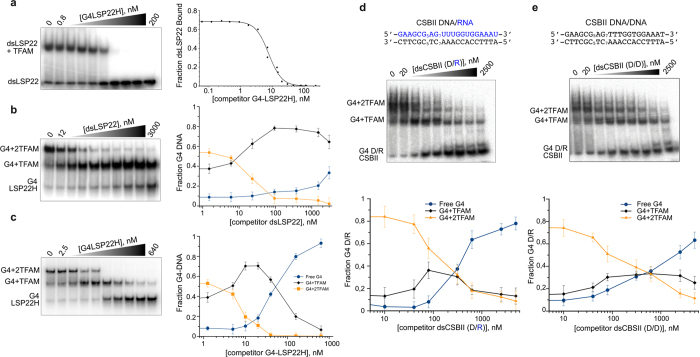
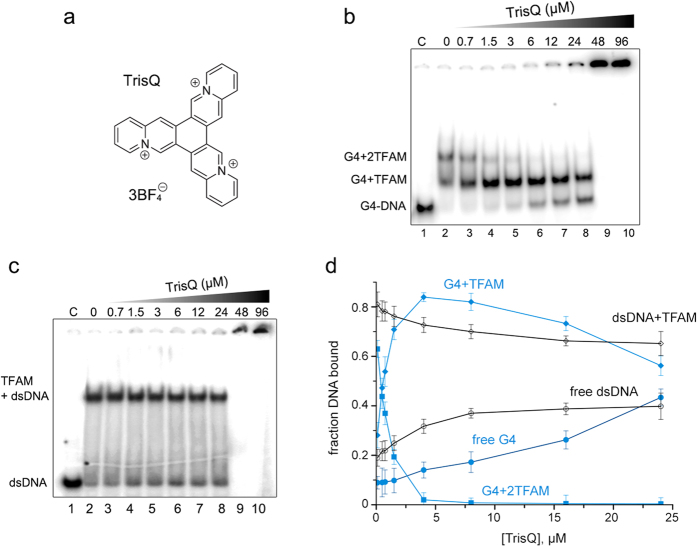
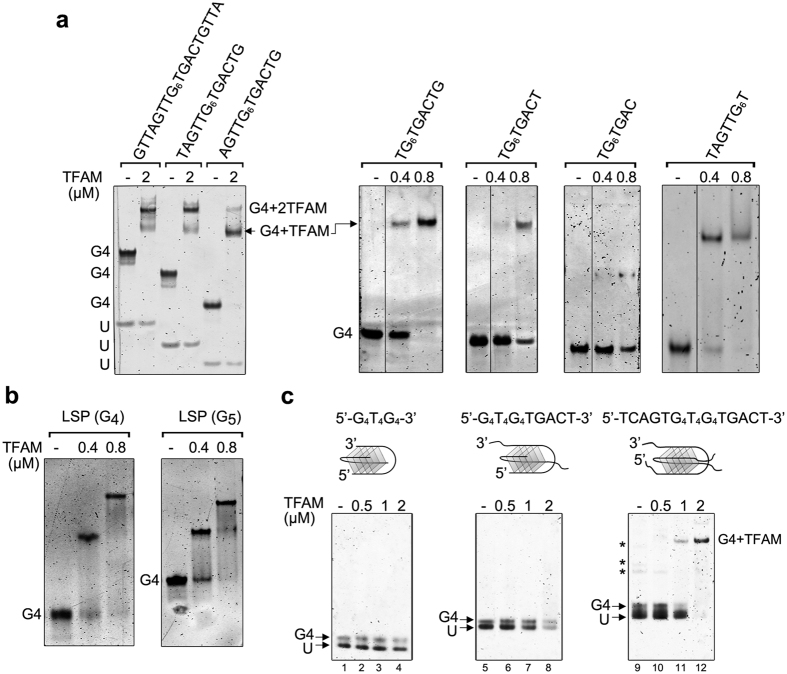
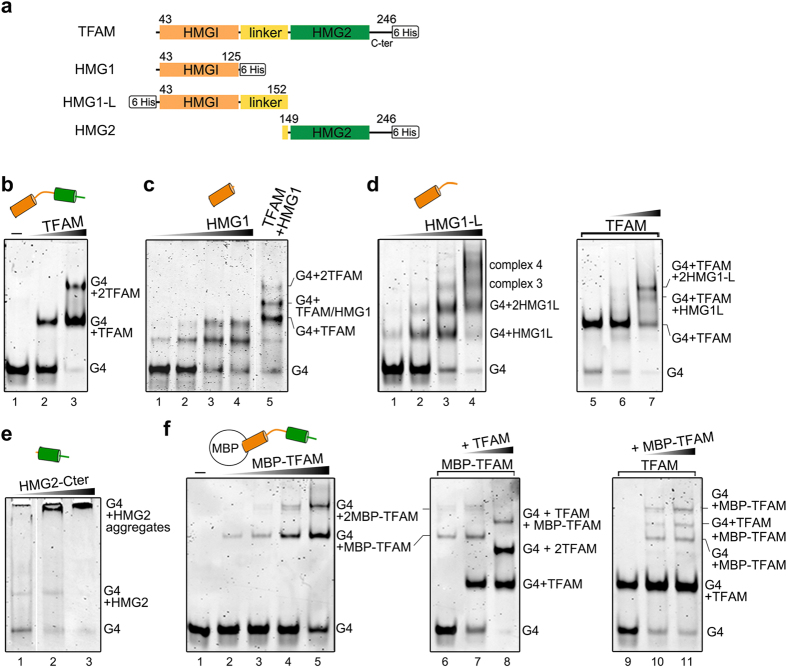
The ability of the guanine-rich strand of the human mitochondrial DNA (mtDNA) to form G-quadruplex structures (G4s) has been recently highlighted, suggesting potential functions in mtDNA replication initiation and mtDNA stability. G4 structures in mtDNA raise the question of their recognition by factors associated with the mitochondrial nucleoid. The mitochondrial transcription factor A (TFAM), a high-mobility group (HMG)-box protein, is the major binding protein of human mtDNA and plays a critical role in its expression and maintenance. HMG-box proteins are pleiotropic sensors of DNA structural alterations. Thus, we investigated and uncovered a surprising ability of TFAM to bind to DNA or RNA G4 with great versatility, showing an affinity similar than to double-stranded DNA. The recognition of G4s by endogenous TFAM was detected in mitochondrial extracts by pull-down experiments using a G4-DNA from the mtDNA conserved sequence block II (CSBII). Biochemical characterization shows that TFAM binding to G4 depends on both the G-quartets core and flanking single-stranded overhangs. Additionally, it shows a structure-specific binding mode that differs from B-DNA, including G4-dependent TFAM multimerization. These TFAM-G4 interactions suggest functional recognition of G4s in the mitochondria.


Conflict of interest statement

The authors declare no competing financial interests.

Figures

Figure 1
Figure 1. TFAM is captured from mitochondrial extracts with CSBII G4-DNA by pull-down assays.
Experiments were carried out with bulk magnetic beads (control beads), beads coated with CSBII DNA-G4 (G4 beads) or with the corresponding CSBII dsDNA fragment (dsDNA beads). Bound proteins were revealed by Western blot after SDS-PAGE. (a) Pull-down assays using mitochondrial fractions incubated with the indicated beads in the presence of 0.5% Triton X-100. Lane ‘Supernatant’ corresponds to the mitochondrial extract after incubation with each type of beads, and which was used as a control of the input material with Porin as a reference. The NaCl concentration at each elution step is indicated. For the naked and G4 beads, the gels show two washing steps to evince the specificity of the assay. The amounts of TFAM at the supernatants are inversely proportional to the ones eluted with NaCl. (b) Pull-down assays performed with recombinant TFAM (rTFAM) incubated with G4 (lanes 2–5) or control beads (6–9) that show non-specific binding upon blockage with appropriate buffer. Bound rTFAM was eluted with the indicated amounts of NaCl after three washings steps. Note the efficient blockage of TFAM binding to the control beads.
Figure 2
Figure 2. TFAM recognizes DNA and RNA oligonucleotides folded into G4 structures.
(a–g) EMSA of the indicated 32P-labelled substrates (0.5 nM) incubated with increasing concentrations of rTFAM (first and last dilutions, in nM, are indicated for each gel in lane 2 and 10, respectively). In (g), the unfolded LSPas was obtained by alkaline denaturation and neutralization of the G4 before immediate incubation with TFAM. (h) Experimental points from the mobility-shift titrations exemplified in panels a-g for binding quantification and curve fitting using the Hill equation. The fraction of the total DNA bound was used for the G4 substrates. The solid curves result from fitting the data according to Eq. (1). Titration for dsLSP22 was not carried beyond 80% of saturation, because TFAM aggregation occurs at high protein concentration (e.g. >300 nM).
Figure 3
Figure 3. Two TFAM can bind a single tetramolecular G4, which is not recognized like B-DNA.
(a) Gel-mobility shift titration for all types of complexes upon TFAM binding to G4-LSP22H (Fig. 2e). Fractions of unbound (triangles), singly bound (shift I, squares), and doubly bound (shift II, circles) DNA are represented. The solid curves result from fitting the data according to Eqs 3 (b) Model of binding of two TFAM molecules (in blue) to two sites on a tetramolecular G4. The intrinsic association constants, k1 and k2, represent the binding constants to G4 sites 1 and 2, while k12 is the cooperativity parameter representing the increased stability of protein-DNA complexes resulting from binding two protein molecules to the two G4 sites. (c) Intrinsic fluorescence emission spectra of TFAM (0.5 μM) in the absence (blue) and presence of 1.5 μM dsLSP22 (grey), G4-LSPas (violet) and G4-LSP22H (red) at an excitation wavelength of 275 nm.
Figure 4
Figure 4. TFAM prefers G4 over dsDNA.
(a) Competition assay by EMSAusing increasing amounts of unlabelled G4-LSP22H against 32P-labelled dsLSP22 (5 nM) in complex with TFAM (12 nM). The 0.8 and 200 labels correspond to initial and final concentrations (in nM) of G4-LSP22H. The fractions of bound DNA were plotted and fitted using Eq. 2. (b) Competition of unlabelled dsLSP22H against 32P-labelled G4-LSP22H (8 nM) in complex with TFAM (20 nM). The fraction of each species as a function of competitor addition is plotted on the right. (c) Homo-competition carried out as in (b), with 32P-labelled G4-LSP22H titrated with itself. (d,e) Competition assay using increasing amounts of unlabelled double-stranded CSBII, (d), a DNA/RNA heteroduplex or (e) a CSBII DNA homoduplex, against 32-P labelled CSBII G4-DNA/RNA (5 nM) in complex with TFAM (20 nM). The sequences of the competitors are indicated and the concentration ranged from 20 nM (lane 2) to 2.5 μM (lane 9).The fraction of each species as a function of competitor addition is showed at the bottom.
Figure 5
Figure 5. TrisQ selectively displaces TFAM from G4- over ds-DNA.
(a) Structure of TrisQ. (c,d) EMSA showing the binding of TFAM (20 nM) to 8 nM of 32P-labelled G4LSP22H (c) or to 32P-labelled dsLSP22 (6 nM) (d), competed by the indicated amounts of TrisQ. “C” indicates the control sample of DNA without TFAM. (d) Quantification of the band shifts from panels (b,c), the points and fitting corresponding to the sample containing G4 are shown in blue.
Figure 6
Figure 6. Binding specificities of TFAM to G4 DNA.
(a) Examples of complexes obtained upon incubation of the indicated amounts of TFAM (in μM) with G4 tetramers of various lengths and sequences. (−) indicates absence of protein; (U), unfolded oligonucleotide. The gel on the left panel contains 0.5 μM G4-DNA/lane, the others contain 0.2 μM. (b) TFAM/G4 complexes obtained with tetramolecular G4 (0.2 μM) assembled from LSP sequence containing a tract of four (G4) and five (G5) guanines. (c) Complexes obtained between TFAM and bimolecular G4-DNAs formed by G4T4G4, G4T4G4TGACT and TCAG4T4G4TGACT oligonucleotides. The topologies of the bimolecular substrates are schematized above each gel, with folding involving diagonal loops here, although lateral loops can also exist. (−) indicates absence of protein. U: unfolded oligonucleotide. Each lane contains 0.8 μM of the DNA substrates (0.4 μM dimers). Lanes (2–4), (6–8) and (10–12) contain 0.5, 1 and 2 μM of TFAM, respectively. Asterisks for TCAG4T4G4TGACT indicate other G4 species such as parallel tetramers.
Figure 7
Figure 7. Domains of TFAM involved in G4 binding.
(a) Diagram of TFAM domains and TFAM constructs used in this study. (b–f) Binding to G4-LSP22H (0.2 μM) followed by EMSA. (b) Binding of 0.4–0.8 μM TFAM (lanes 2–3); (c) binding of 0.32, 0.75, 1.5, and 3 μM HMG1 (lanes 1–4) or a mixture of 0.6 μM TFAM and HMG1 (lane 5). (d) Left panel: complexes obtained with 0.32, 0.75, 1.5, and 3 μM HMG1-L (lanes 1–4). Right panel: TFAM (0.5 μM)/G4-LSP22H complexes (lane 5) were preformed 10 minutes before the addition of 0.5 or 1 μM of HMG1-L (lanes 6–7). (e) Binding of 0.75, 1.5 and 3 μM HMG2-Cter. (f) Left panel, binding of 0.25 to 2 μM MBP-TFAM (lanes 2–5). Central panel, MBP-TFAM (0.8 μM)/G4-LSP22H complexes (lane 6) were preformed 10 minutes before the addition of 0.5–1 μM of TFAM (lanes 7–8). Right panel: preformed TFAM (0.6 μM)/G4-LSP22H complexes mixed with to 0.8 and 1.6 μM MBP-TFAM (lanes 10–11). For clarity, one free G4 migration control is shown in lanes 1 of panels (b,f).

Similar articles

Cited by

References

    1. Bochman M. L., Paeschke K. & Zakian V. A. DNA secondary structures: stability and function of G-quadruplex structures. Nat Rev Genet 13, 770–780, doi: 10.1038/nrg3296 (2012). - DOI - PMC - PubMed
    1. Chambers V. S. et al.. High-throughput sequencing of DNA G-quadruplex structures in the human genome. Nat Biotechnol 33, 877–881, doi: 10.1038/nbt.3295 (2015). - DOI - PubMed
    1. Biffi G., Tannahill D., McCafferty J. & Balasubramanian S. Quantitative visualization of DNA G-quadruplex structures in human cells. Nat Chem 5, 182–186, doi: 10.1038/nchem.1548 (2013). - DOI - PMC - PubMed
    1. Lipps H. J. & Rhodes D. G-quadruplex structures: in vivo evidence and function. Trends in cell biology 19, 414–422, doi: 10.1016/j.tcb.2009.05.002 (2009). - DOI - PubMed
    1. Maizels N. & Gray L. T. The G4 genome. PLoS Genet 9, e1003468, doi: 10.1371/journal.pgen.1003468 (2013). - DOI - PMC - PubMed

Publication types