Review
. 2017 Apr 18;46(8):2158-2198.
doi: 10.1039/c6cs00765a.

Advanced optoacoustic methods for multiscale imaging of in vivo dynamics

Affiliations
Review

Advanced optoacoustic methods for multiscale imaging of in vivo dynamics

X L Deán-Ben et al. Chem Soc Rev. .

Abstract

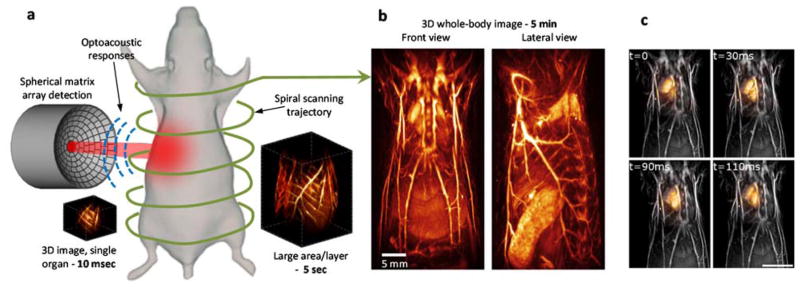
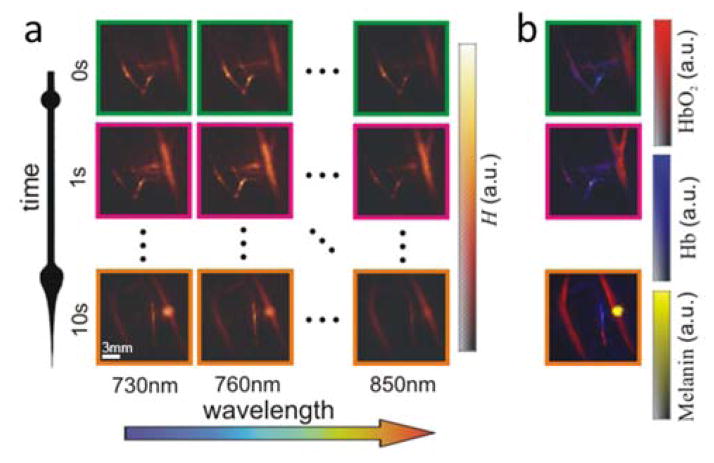
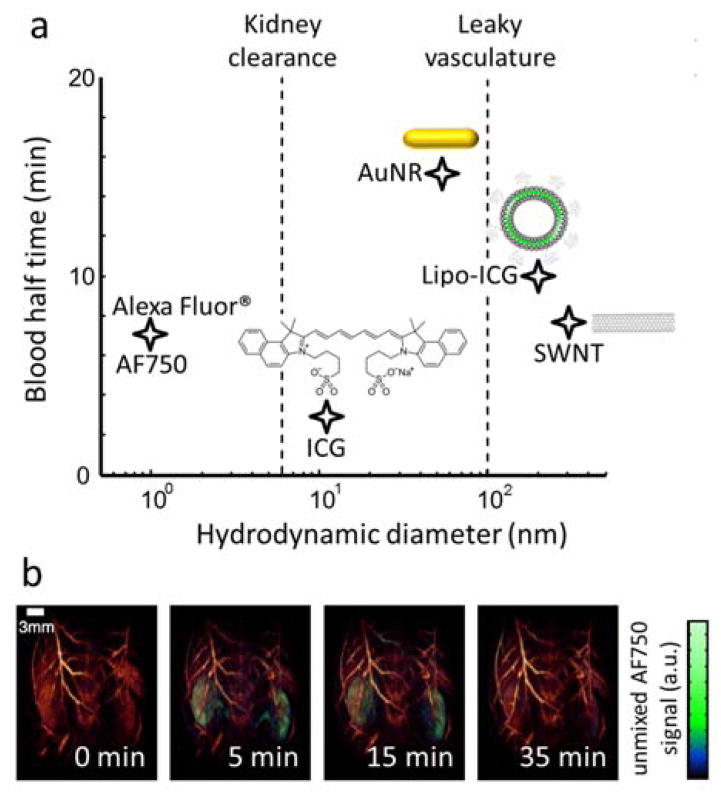
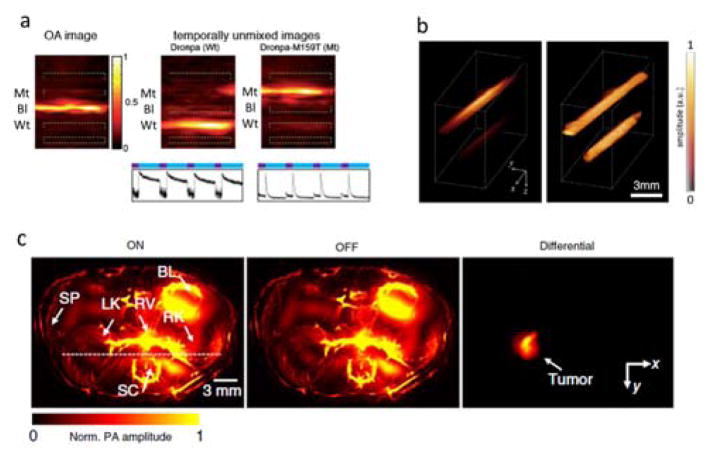
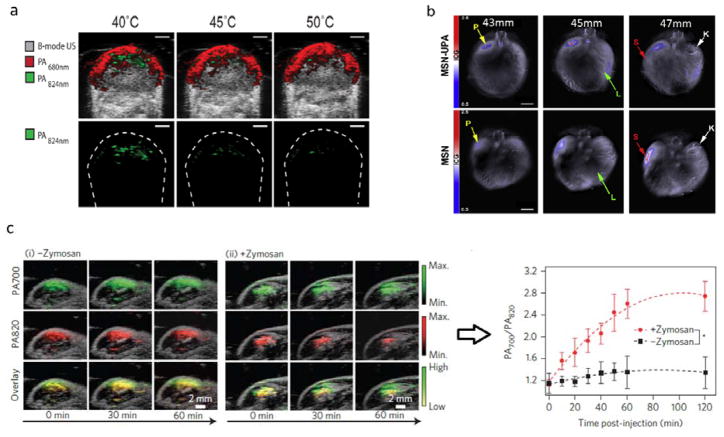
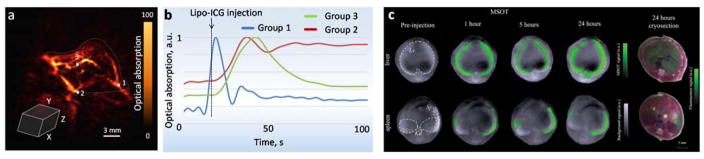
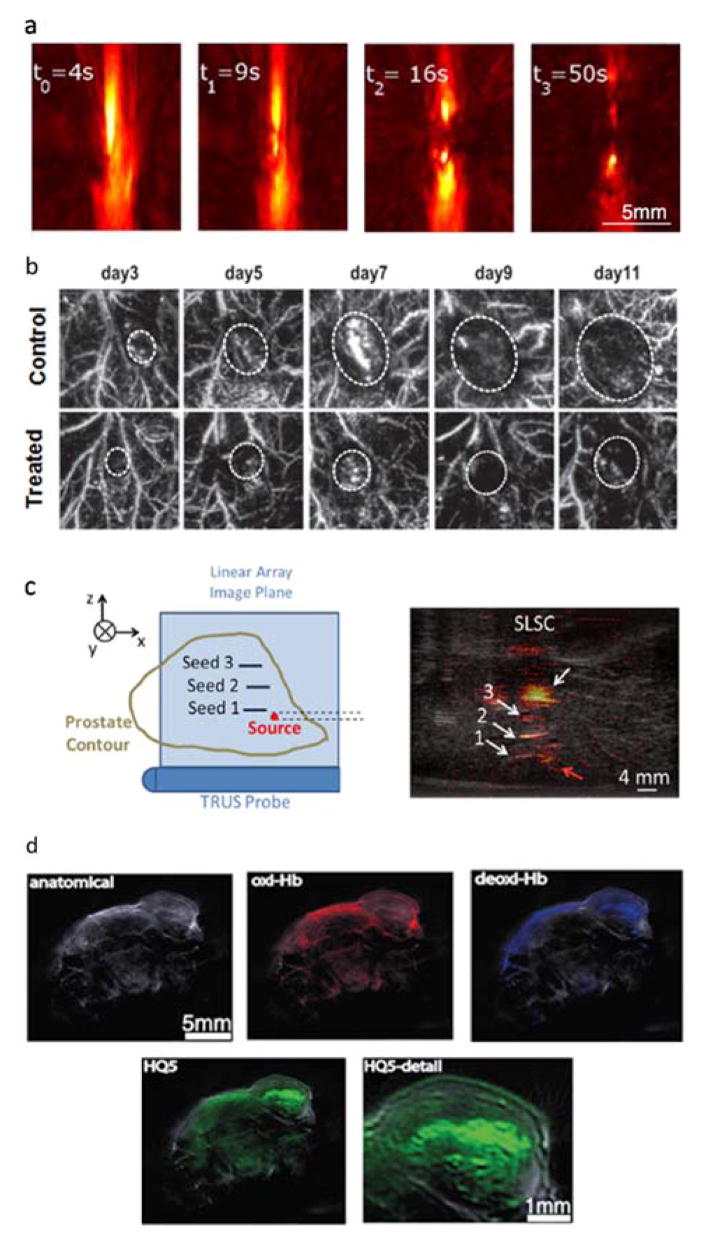
Visualization of dynamic functional and molecular events in an unperturbed in vivo environment is essential for understanding the complex biology of living organisms and of disease state and progression. To this end, optoacoustic (photoacoustic) sensing and imaging have demonstrated the exclusive capacity to maintain excellent optical contrast and high resolution in deep-tissue observations, far beyond the penetration limits of modern microscopy. Yet, the time domain is paramount for the observation and study of complex biological interactions that may be invisible in single snapshots of living systems. This review focuses on the recent advances in optoacoustic imaging assisted by smart molecular labeling and dynamic contrast enhancement approaches that enable new types of multiscale dynamic observations not attainable with other bio-imaging modalities. A wealth of investigated new research topics and clinical applications is further discussed, including imaging of large-scale brain activity patterns, volumetric visualization of moving organs and contrast agent kinetics, molecular imaging using targeted and genetically expressed labels, as well as three-dimensional handheld diagnostics of human subjects.


Figures

Fig 1
Fig 1
Schematic illustration of the optoacoustic signal generation and detection. Short light pulses at selected optical wavelengths are absorbed by the tissue chromophores and contrast agents, leading to instantaneous heating and thermal expansion. As a result, ultrasound pressure waves are excited and measured around the imaged object.
Fig 2
Fig 2
Dynamic imaging with optical-resolution photoacoustic microscopy (OR-PAM). (a) Lay-out of the imaging system. (b) Fractional change in the optoacoustic images of the left (LH) and right (RH) hemispheres of the mouse brain in response to left (LHS – left) and right (RHS – right) hind limb stimulation. Adapted with permission from [22]. © 2015 - Macmillan Publishers Ltd.
Fig 3
Fig 3
All-optical optoacoustic scanner based on a Fabry-Pérot ultrasound sensor. (a) Lay-out of the imaging system. (b) Longitudinal optoacoustic images of tumor vasculature showing the effect of the vascular disrupting therapeutic agent OXi4503 before (left), 24 hours (center) and 48 hours (right) after treatment. Adapted with permission from [53], © 2012 Society of Photo Optical Instrumentation Engineers.
Fig 4
Fig 4
Small animal imaging with multi-spectral optoacoustic tomography (MSOT). (a) Schematic of the real-time cross-sectional imaging system. Adapted with permission from [88]. © 2011 - Macmillan Publishers Ltd. (b) Time-lapse MSOT images of a mouse administered with an anthracycline antibiotic adriamycin (ADR) (bottom) and control mouse (top) before and after injection of the near-infrared dye IRDye800CW. Gray-scale background represents single-wavelength optoacoustic reconstructions whereas the spectrally-unmixed dye distribution is superimposed in color. Figure is used under the Creative Commons Attribution 4.0 International License from [94]. A scale bar was added and image identification was altered.
Fig 5
Fig 5
Multi-scale four dimensional (4D) optoacoustic imaging. (a) Lay-out of the spiral volumetric optoacoustic tomography (SVOT) imaging concept. Whole-body tomographic data acquisition is performed along a spiral (helical) scanning trajectory by means of a spherical matrix ultrasound detection array, further capable of real-time 3D imaging. (b) It takes about 5 minutes to acquire whole-body image data by combining all images acquired along the entire spiral trajectory. Adapted with permission from [73] © 2017 - Macmillan Publishers Ltd. (c) Whole-body optoacoustic images (gray scale) superimposed with images of a beating heart (orange) acquired in real time for a single position of the spherical array. Scale bar – 1cm. Adapted with permission from [104] © 2016 Optical Society of America.
Fig 6
Fig 6
Five dimensional (5D) optoacoustic imaging of the forearm of a healthy volunteer. (a) The imaging concept is based on per-pulse tuning of the laser wavelength and rapid collection of multi-spectral volumetric data using a handheld spherical matrix array scanner. (b) Spectral unmixing of the 3D images for different instants and wavelengths renders the distribution of different tissue chromophores in real time. Adapted with permission from [11], © 2014 - Macmillan Publishers Ltd.
Fig 7
Fig 7
Optical absorption spectra of major endogenous chromophores at typical concentrations occurring in living mammalian tissues. Melanin spectrum (brown) is shown for typical concentrations in the skin [122]; haemoglobin (red – oxygenated, blue – deoxygenated) for typical concentrations in whole blood (150 g/l – continuous lines) and average soft tissues (15 g/l – dashed lines) [123]; water (cyan) for a typical concentration of 80% by volume in soft tissues [124]; lipids (yellow) for a concentration of 20% by volume [–126]. The first (NIR – I) and second (NIR – II) windows [127], where optical absorption is minimized, are indicated.
Fig 8
Fig 8
Clearance constants of the common optoacoustic contrast agents from the blood circulation. (a) Blood half-life versus hydrodynamic diameter are shown for AF750 [73]; ICG [137] (note that ICG small molecules bind to albumin in blood, resulting in a hydrodynamic diameter of 11 nm that prevents kidney clearance [138]); gold nanorods (AuNR) [139]; liposomal ICG (Lipo-ICG) [137] and single-walled carbon nanotubes (SWNT) [140]. (b) Renal clearance of AF750 as visualized with spiral volumetric optoacoustic tomography (SVOT). Adapted with permission from [73] © 2017 - Macmillan Publishers Ltd.
Fig 9
Fig 9
Relation between the mass and molar extinctions of the agent and the generated optoacoustic signal. (a) Mass versus molar extinction for some commonly used optoacoustic contrast agents: small-molecule-based ICG [123]; single walled carbon nanotubes (SWNT) [145]; semiconducting polymer particles (SPN1) [145]; gold nanorods (AuNR) [145]. The data is provided at the peak absorption wavelengths. (b) Comparison of the generated optoacoustic signals per mass and per molar concentration for the different types of nanoparticles. Adapted with permission from [145]. © 2014 - Macmillan Publishers Ltd.
Fig 10
Fig 10
Genetic labeling approaches in optoacoustic imaging. (a) Green fluorescent protein (GFP) synthetized directly from the GFP gene using mRNA. (b) Blue product (5,5′-dibromo-4,4′-dichloro-indigo) generated by hydrolysis of 5-bromo-4-chloro-3-indolyl-b-D-galactoside (X-gal) and catalyzed by the β-galactosidase enzyme. (c) Melanin enzymatically produced from endogenous tyrosine. (d) Violacein produced from the oxidative conversion of endogenous L-tryptophan by a 5-step enzymatic reaction. (e) Wavelength range covered by optoacoustic genetic reporters plotted along with the average optical attenuation in soft tissues. Reproduced with permission from [128]. © 2013 IOP Publishing.
Fig 11
Fig 11
Examples of molecular conformational changes leading to changes in the optical absorption spectrum that can be exploited for optoacoustic molecular sensing. (a) The heme group of haemoglobin changes its configuration when oxygen binds to iron. (b) The calcium-binding messenger calmodulin (CaM) in the genetically-encoded calcium indicator GCaMP undergoes a conformational change when calcium is present. Figure is used under the Creative Commons Attribution 4.0 International License from [309]. (c) The fluorescent protein Dronpa can be switched between its cis and trans conformations using light at different wavelengths. Adapted with permission from [357]. © 2007 The Company of Biologists Ltd.
Fig 12
Fig 12
Photodegradation of optoacoustic agents under nanosecond light exposure. (a) Signal decline in semiconducting polymer particles (SPN1), single walled carbon nanotubes (SWNT) and gold nanorods (GNR) due to exposure to pulsed laser radiation (9 mJ/cm2 fluence), indicating their susceptibility to laser-induced deformation. Adapted with permission from [145]. © 2014 - Macmillan Publishers Ltd. (b) Photobleaching of fluorescent proteins and chromoproteins under prolonged exposure to nanosecond laser pulses. The fluence at the sample ranged from 1.5 to 1.7 mJ/cm2. Adapted with permission from [280]. © 2013 Optical Society of America. (c) Loss of fluorescence signal (shown in %) due to photobleaching of mCherry-expressing cells under different illumination conditions (average intensity and fluence) within ANSI exposure limits for 10 second exposure with 10000 pulses. Adapted with permission from [270]. © 2015 Elsevier.
Fig 13
Fig 13
Optoacoustic tracking of moving cells. (a) Cells in lymph flow of a mouse mesentery vessel before (left) and after (right) being trapped with gradient acoustic forces induced by optoacoustic waves generated by irradiation with a linear laser beam. Adapted with permission from [292]. © 2016 - Macmillan Publishers Ltd. (b) Optoacoustic set-up for measuring the flow velocity of cells via time correlation of the optoacoustic signals generated by two consecutive laser pulses. Adapted with permission from [293]. © 2016 - Macmillan Publishers Ltd. (c) Selected time-lapse images showing the oxygen saturation of individual red blood cells in cuticle capillaries obtained with high-speed optical-resolution photoacoustic microscopy (OR-PAM). Adapted with permission from [41]. © 2013 Society of Photo Optical Instrumentation Engineers.
Fig 14
Fig 14
Optoacoustic visualization of perfusion and organ function. (a) Capillary bed and individual red blood cells (RBC) traveling along a capillary imaged with optical-resolution photoacoustic microscopy (OR-PAM). Adapted with permission from [24]. © 2011 Optical Society of America. (b) Cross-sectional optoacoustic image of a mouse in the liver area obtained with MSOT. Time-lapse profiles of the unmixed ICG signal in liver and gallbladder are shown below. Figure is used under the Creative Commons Attribution 4.0 International License from [302]. A scale bar was added and image identification was altered. (c) Four snapshots from the high-frame-rate sequence of volumetric images of a beating mouse heart taken during ICG injection with the 4D optoacoustic tomography (left) along with the time profiles of the signals for the right (V1) and left (V2) ventricles. The pulmonary transit time Δt is indicated. Figure is used under the Creative Commons Attribution International License from [100]. No changes were made.
Fig 15
Fig 15
Optoacoustic imaging of hemodynamic changes in the rodent brain. (a) Oxygen saturation changes of the superior sagittal sinus (SSS) and the contralateral MI and MII arterioles as a function of time obtained from A-line (1D) optoacoustic signals. Adapted with permission from [305]. © 2012 Sage Publications. (b) Functional connectivity maps in a live mouse brain acquired with cross-sectional optoacoustic tomography indicating eight main functional regions in the cortex. Figure adapted with permission from [121], © 2013 National Academy of Sciences. (c) Time series of rat brain images obtained with wearable cross-sectional optoacoustic tomography under alternating normoxia and hyperoxia (HO) conditions. Scale bar – 1mm. Adapted with permission from [306]. © 2015 Sage Publications. (d) Intensity plots of the epileptic-seizure-related activity as identified by correlating electroencephalogram (EEG) traces with optoacoustic hemodynamic responses obtained using 5D optoacoustic tomography. Adapted with permission from [101]. © 2017 Society of Photo Optical Instrumentation Engineers.
Fig 16
Fig 16
Functional optoacoustic neurotomography (FONT) visualizes neuronal activity using the genetically-encoded calcium indicator GCaMP5G [255]. (a) Volumetric optoacoustic images of an adult zebrafish brain. (b) Real-time imaging of calcium activity with epi-fluorescence (top) and optoacoustics (bottom) after injection of the neurostimulant agent pentylenetetrazole (PTZ) into the brain. Temporal traces in the 5 marked regions of interest are shown. The fluorescence images have very blurry appearance indicating that the intense light scattering in large brains makes them inaccessible by optical microscopy methods. In contrast, FONT is able to provide high-resolution three-dimensional information regarding real-time neuronal activity in the entire scattering brain. (c) Time-resolved images from a single slice through the 3D data, as indicated in violet in (a). (d) Close-up spatio-temporal resolution analysis of a single line, whose orientation is indicated by an arrow in (c). (e) Temporal and spatial profiles through the image in (d). Scale bars − 500 μm. Adapted with permission from [255]. © 2016 - Macmillan Publishers Ltd.
Fig 17
Fig 17
Optoacoustic imaging of photoswitchable probes. (a) Temporal unmixing of Dronpa (middle) and its mutant variant Dronpa-M159T (right) from blood (left) as obtained from a time-lapse sequence of images acquired with 4D optoacoustic tomography. Adapted with permission from [130]. © 2015 Optical Society of America. (b) 3D optoacoustic images of two tubings containing Dronpa-M159T located at different depths in a light scattering medium before (left) and after (right) normalization with the calculated decay rates. Adapted with permission from [273]. © 2015 Optical Society of America. (c) Cross-sectional optoacoustic tomography images of a mouse with injected U87 tumor cells expressing the bacterial phytochrome BphP1 in its activated (left) and deactivated (middle) states along with the difference between the two images (right). Adapted with permission from [272]. © 2016 - Macmillan Publishers Ltd.
Fig 18
Fig 18
Optoacoustic molecular imaging and sensing. (a) Temperature threshold sensing in tumour xenografts injected with J-aggregating bacteriopheophorbide a-lipid nanoparticles JPN16 by comparison of cross-sectional optoacoustic images at two different wavelengths. Figure is used under the License from Standard ACS AuthorsChoice/Editors’ Choice Usage Agreement from [269]. A 1mm scale bar was added and image identification was altered. (b) Multispectral optoacoustic tomography (MSOT) images of a mouse implanted with S2VP10 pancreatic cancer cells after injection of mesoporous silica nanoparticles (MSN) with chitosan and urokinase plasmonigen activator (MSN-UPA) (top) or untargeted MSN (bottom). Scale bar – 5 mm. Adapted with permission from [311]. © 2015 Elsevier. (c) Optoacoustic sensing of reactive oxygen species (ROS) by comparison of cross-sectional optoacoustic images for saline-treated (left) and zymosan-treated (middle) regions in a mouse and the time profiles of the optoacoustic amplitude ratios for two wavelengths (right) after injection of ratiometric semiconducting polymer nanoparticles (RSPN). Adapted with permission from [145]. © 2014 - Macmillan Publishers Ltd.
Fig 19
Fig 19
Optoacoustic imaging of pharmacokinetics and bio-distribution. (a) Images of a subcutaneous 4T1 breast tumour in a mouse obtained with 4D optoacoustic tomography after injection of liposomal indocyanine green (Lipo-ICG). The corresponding temporal profiles for the three marked regions of interest are shown in (b). Adapted with permission from [312]. © 2015 European Society of Radiology with permission of Springer. (c) MSOT imaging of bio-distribution of a 1,1’-dioctadecyltetramethyl indotricarbocyanine iodide (DiR)-loaded polyethyleneimine functionalized poly(lactic-coglycolic acid) (PEI-PLGA) nanoparticles in a CD1 mouse. Green colour scale corresponds to the unmixed distribution of the probe. Adapted with permission from [313]. © 2015 John Wiley & Sons.
Fig 20
Fig 20
Optoacoustic monitoring of treatments. (a) 4D optoacoustic monitoring of endovenous laser therapy (ELT) treatment aimed at eliminating incompetent truncal veins. Adapted with permission from [267]. © 2015 John Wiley & Sons, Inc. (b) Optoacoustic images of breast cancer xenografts receiving scrambled control (top) and intratumoral self-complementary AAV serotype 2 (scAAV2) septuplet-tyrosine mutant vectors encoding siRNAs against ATF6 (bottom). Adapted with permission from [317]. © 2013 Elsevier. A scale bar was added. (c) Optoacoustic images of brachytherapy seeds implanted in a canine prostate as obtained by means of a transrectal ultrasound probe. Adapted with permission from [318]. © 2014 Society of Photo Optical Instrumentation Engineers. (d) Multispectral optoacoustic tomography (MSOT) images of spontaneous 4T1-luc2 tumour necrosis with the carboxylated cyanine HQ5. Adapted with permission from [319]. © 2015 Impact Journals.
Fig 21
Fig 21
Optoacoustic imaging of cellular and sub-cellular function. (a) OR-PAM images of the cytoplasms (green) and nuclei (blue) of fibroblasts. Adapted with permission from [320]. © 2013 Society of Photo Optical Instrumentation Engineers. (b) 3D images of red blood cells obtained with ultra-high frequency acoustic-resolution optoacoustic microscopy. Scale bar – 2μm. Adapted with permission from [51]. © 2017 IEEE. (c) In vivo images of the melanin distribution near the basal layer of the epidermis obtained with single-photon absorption (1PA) (left) and two-photon absorption (2PA) (right) optoacoustic microscopy. Scale bar – 50μm. Figure is used under the Creative Commons Attribution 3.0 International License from [37]. (d) Images of mitochondria in NIH 3T3 fibroblasts obtained with OR-PAM (left) and optoacoustic nanoscopy (middle) showing the enhanced resolution rendered with the latter approach for the indicated profiles (right). Adapted with permission from [32]. © 2014 Society of Photo Optical Instrumentation Engineers.
Fig 22
Fig 22
Optoacoustic imaging of development. (a) Zebrafish images through stages of larval developmental obtained with hybrid focus optoacoustic microscopy (HFOAM). Adapted with permission from [321]. © 2015 Elsevier. (b) Optoacoustic images of a mouse embryo obtained with a Fabry-Pérot-based optoacoustic scanner. Adapted with permission from [322]. © 2012 Society of Photo Optical Instrumentation Engineers.
Fig 23
Fig 23
Optoacoustic imaging of longitudinal dynamics and disease progression. (a) Images of implanted Tyr-expressing 293T cells at different time points post inoculation, acquired with the Fabry-Pérot-based optoacoustic scanner. Adapted with permission from [241]. © 2015 - Macmillan Publishers Ltd. (b) Optoacoustic imaging of melanoma micrometastasis in popliteal lymph node basin (top) and a large in-transit metastasis at upper third of lower thigh distal to popliteal basin (bottom) as obtained with handheld volumetric optoacoustic tomography scanner. Adapted with permission from [91]. © 2016 Radiological Society of North America. (c) In vivo imaging of amyloid plaques in a brain region of APPswe/PS1dE9 mouse injected with Congo-red. Images acquired with multiphoton microscopy (1) and dual-wavelength OR-PAM (2, 3, 4) are shown. Adapted with permission from [326]. © 2009 Optical Society of America.
Fig 24
Fig 24
Examples of clinical optoacoustic studies in oncology. (a) Metastatic status of sentinel lymph nodes in melanoma patients determined noninvasively with multispectral optoacoustic tomography (MSOT). Preoperative non-invasive assessment of ICG (green scale) and melanin (orange) distribution in suspected metastatic sentinel lymph nodes using handheld cross-sectional and volumetric MSOT scanners. Penetration of up to 5cm was claimed with 100% sensitivity and 48 to 62% lesion detection specificity. Adapted with permission from [106]. © 2015 AAAS (b) 3D optoacoustic images of a highly suspect cancer lesion in the breast of a female patient. Figure is used under the Creative Commons Attribution International License from [328]. Image identification was altered.
Fig 25
Fig 25
Comparison of dynamic imaging capabilities of the various functional modalities used in small animal research and the clinics. Shown are: optical methods (violet) based on two photon microscopy (2P) [342], light-sheet microscopy (LSM) [343] and light field microscopy (LFM) [344]; small animal [345] and human [346] functional magnetic resonance imaging (fMRI - orange); high-density diffuse optical tomography (HD-DOT - gray) [347]; functional ultrasound (fUS - green) [348]; optical-resolution photoacoustic microscopy (OR-PAM) [22]; 4D and 5D optoacoustic tomography (4D-5D OAT) [255] (dots indicate three reported systems with isotropic resolution).

References

    1. Weissleder R, Nahrendorf M. Advancing biomedical imaging. Proceedings of the National Academy of Sciences of the United States of America. 2015;112:14424–14428. - PMC - PubMed
    1. Osmanski BF, Pezet S, Ricobaraza A, Lenkei Z, Tanter M. Functional ultrasound imaging of intrinsic connectivity in the living rat brain with high spatiotemporal resolution. Nat Commun. 2014;5 - PMC - PubMed
    1. Giepmans BNG, Adams SR, Ellisman MH, Tsien RY. Review - The fluorescent toolbox for assessing protein location and function. Science. 2006;312:217–224. - PubMed
    1. Chudakov DM, Matz MV, Lukyanov S, Lukyanov KA. Fluorescent Proteins and Their Applications in Imaging Living Cells and Tissues. Physiol Rev. 2010;90:1103–1163. - PubMed
    1. Ntziachristos V. Going deeper than microscopy: the optical imaging frontier in biology. Nature methods. 2010;7:603–614. - PubMed

LinkOut - more resources