. 2017 Mar 9;8(3):e2662.
doi: 10.1038/cddis.2017.82.

Estrogen receptors in granulosa cells govern meiotic resumption of pre-ovulatory oocytes in mammals

Affiliations

Estrogen receptors in granulosa cells govern meiotic resumption of pre-ovulatory oocytes in mammals

Wei Liu et al. Cell Death Dis. .

Abstract

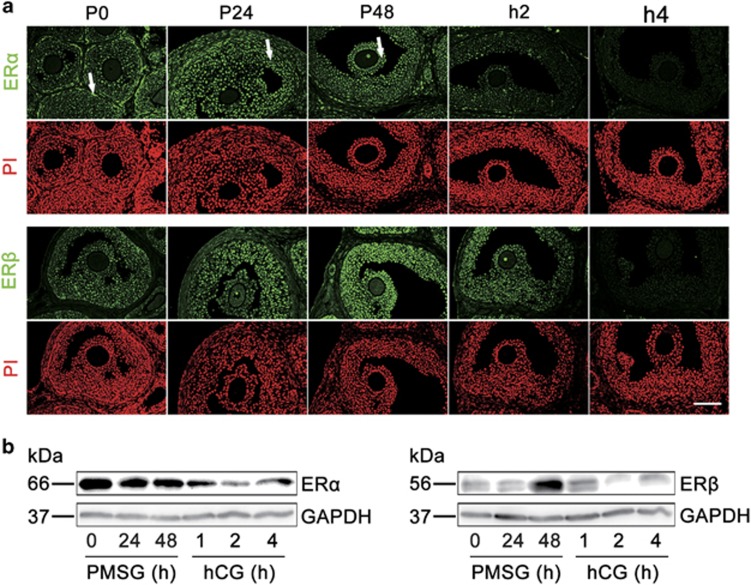
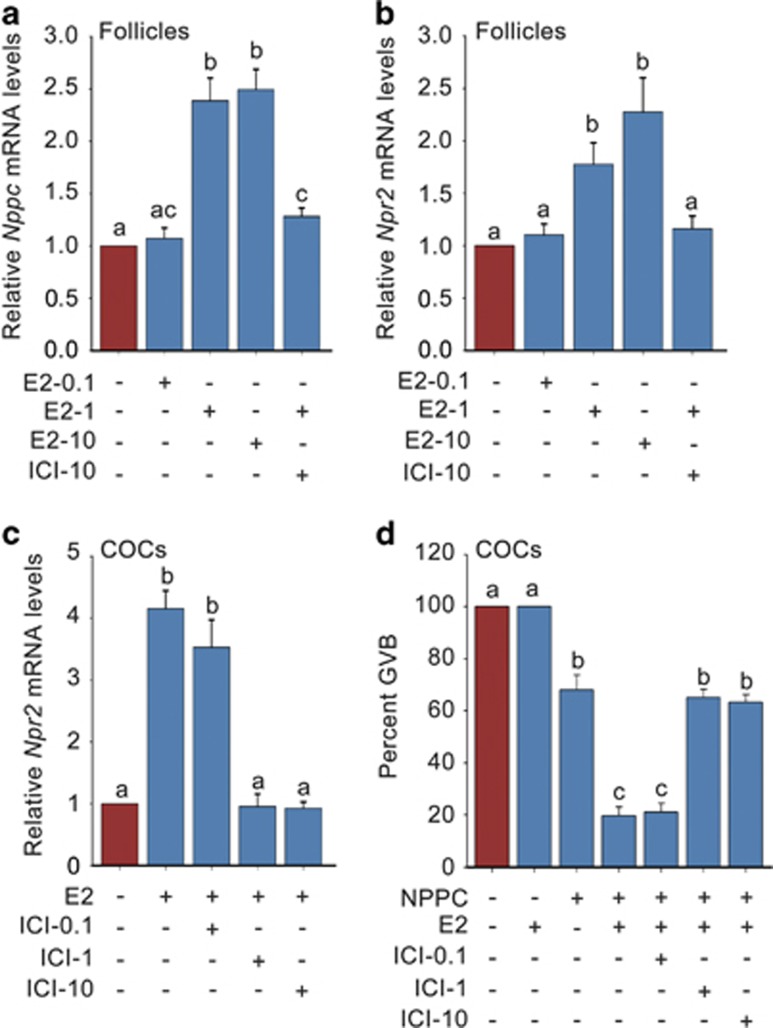
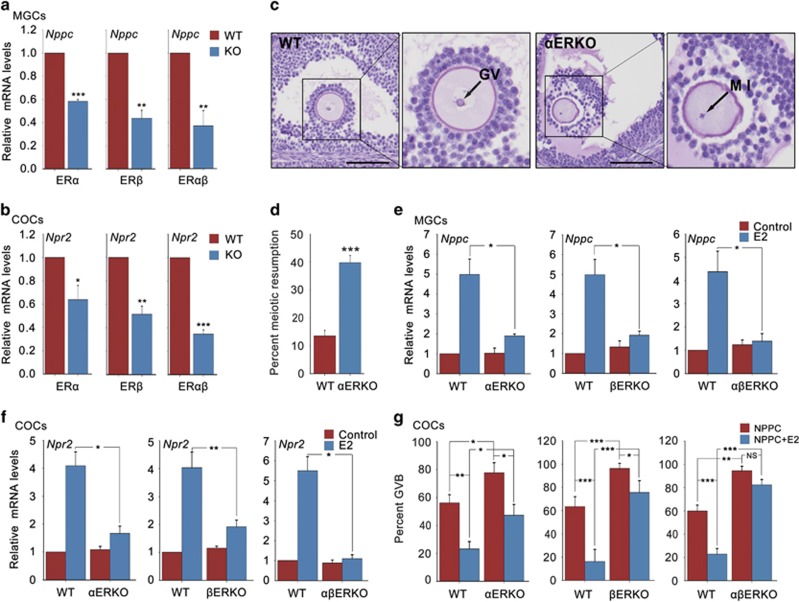
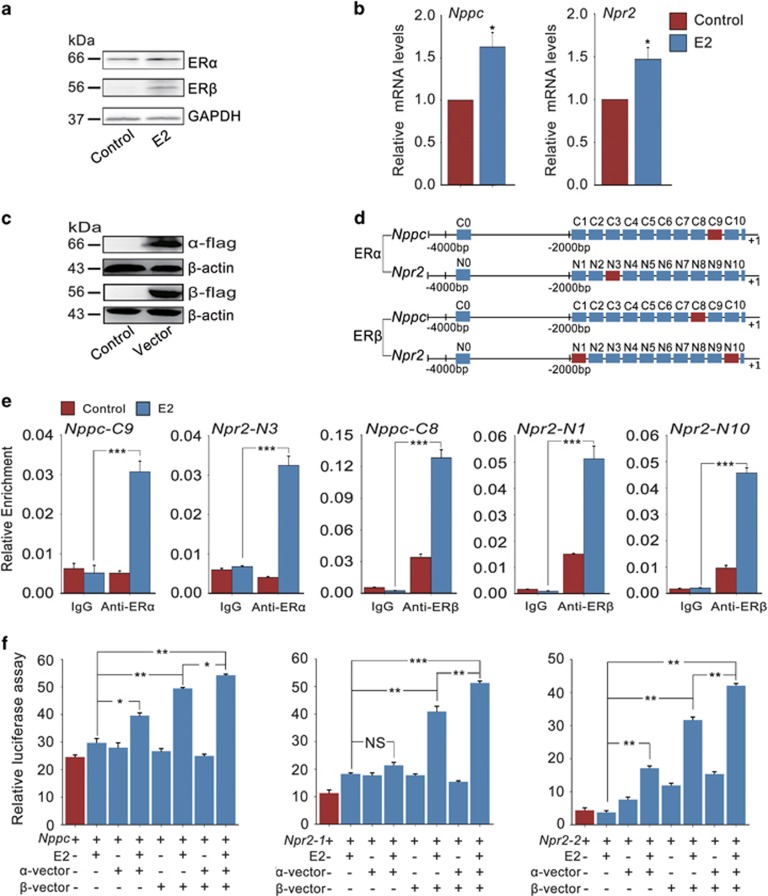
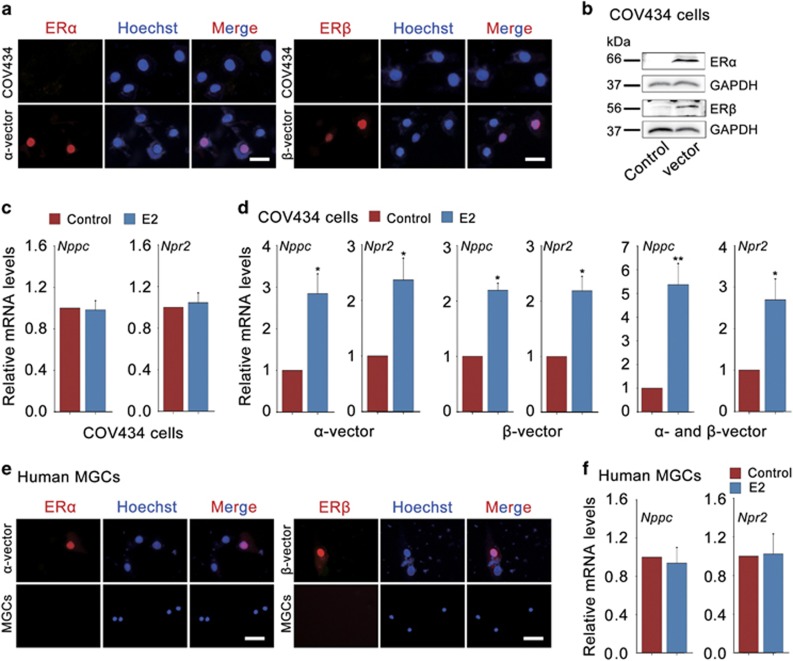
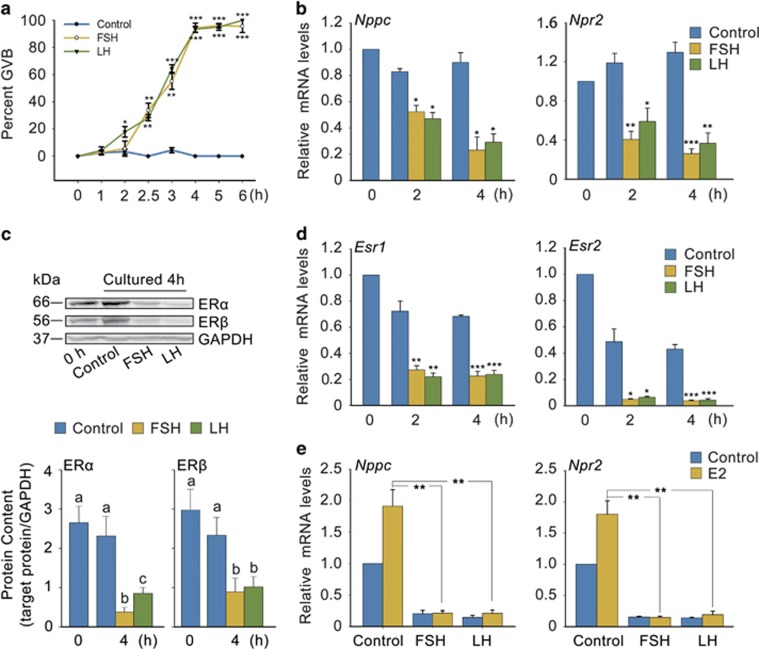
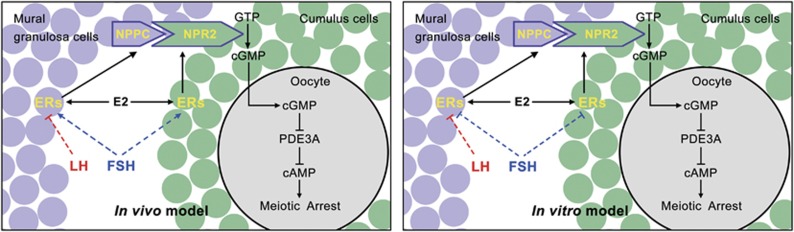
In mammals, oocytes are arrested at the diplotene stage of meiosis I until the pre-ovulatory luteinizing hormone (LH) surge triggers meiotic resumption through the signals in follicular granulosa cells. In this study, we show that the estradiol (E2)-estrogen receptors (ERs) system in follicular granulosa cells has a dominant role in controlling oocyte meiotic resumption in mammals. We found that the expression of ERs was controlled by gonadotropins under physiological conditions. E2-ERs system was functional in maintaining oocyte meiotic arrest by regulating the expression of natriuretic peptide C and natriuretic peptide receptor 2 (NPPC/NPR2), which was achieved through binding to the promoter regions of Nppc and Npr2 genes directly. In ER knockout mice, meiotic arrest was not sustained by E2 in most cumulus-oocyte complexes in vitro and meiosis resumed precociously in pre-ovulatory follicles in vivo. In human granulosa cells, similar conclusions are reached that ER levels were controlled by gonadotropins and E2-ERs regulated the expression of NPPC/NPR2 levels. In addition, our results revealed that the different regulating patterns of follicle-stimulating hormone and LH on ER levels in vivo versus in vitro determined their distinct actions on oocyte maturation. Taken together, these findings suggest a critical role of E2-ERs system during oocyte meiotic progression and may propose a novel approach for oocyte in vitro maturation treatment in clinical practice.


Conflict of interest statement

The authors declare no conflict of interest.

Figures

Figure 1
Figure 1
Gonadotropins control ER levels in mouse ovaries in vivo. (a) Immunofluorescence analysis of ERα and ERβ expression in ovaries. Ovaries were stained for ERα or ERβ (green) and the nuclear marker propidium iodide (PI, red) at the indicated time points after PMSG stimulation followed at 48 h later with hCG. ERα protein was highly expressed in theca cells (indicated by arrows in P0) in small follicles, but also stained in MGCs (indicated by arrows in P24) and CCs (indicated by arrows in P48) of large antral follicles by PMSG stimulation. ERβ staining was predominantly observed in MGCs and CCs in large antral follicles. P, means PMSG, h means hCG. Scale bars: 100 μm. (b) WB data indicating the regulation of gonadotropins on ERα and ERβ levels in ovaries. Ovaries were isolated from 22- to 24-day-old mice stimulated with PMSG followed at 48 h later with hCG as indicated in figures. GAPDH served as a loading control
Figure 2
Figure 2
E2-ERs promote Nppc/Npr2 levels and maintain NPPC-mediated oocyte meiotic arrest. (a and b) Effects of E2 and ICI182780 on Nppc and Npr2 mRNA levels in follicles. Follicles were cultured in medium containing 0.0 μM (control)–10.0 μM E2 or plus 10 μM ICI182780 (ICI: a nonselective ERα and ERβ antagonist) for 4 h. n=3. (c) Effects of E2 and ICI on Npr2 mRNA levels in COCs. COCs were cultured for 24 h in medium without (control) or with 0.1 μM E2 or plus 0.1–1.0 μM ICI. n=3. (d) Effects of E2 and ICI on NPPC-mediated oocyte meiotic arrest in COCs. COCs were cultured for 24 h and the percentages of oocytes that underwent GVB were determined. E2, 0.1 μM; NPPC, 0.03 μM; ICI, 0.1–1.0 μM. n=4. Data represent the mean±S.E.M. Different letters (a-c) indicate significant differences between groups (P<0.05, ANOVA and Holm–Sidaik test)
Figure 3
Figure 3
ERKO mouse ovaries show decreased NPPC/NPR2 levels and percentages of meiotic arrested oocytes. (a and b) Expression of Nppc levels in MGCs and Npr2 levels in COCs isolated from 22- to 24-day-old WT and ERKO mouse ovaries. Ovaries were stimulated with PMSG for 46 to 48 h. n=3. (c) A prophase-arrested oocyte (GV) within a large antral follicle of a WT ovary and an oocyte with metaphase I (MI) chromosomes within a large antral follicle of a αERKO ovary. Scale bars: 100 μm. (d) Percentages of oocytes that had resumed meiosis, counted in serial sections of ovaries from WT and αERKO mice. n=9. (e and f) Effects of E2 on Nppc levels in MGCs and Npr2 levels in COCs isolated from WT and ERKO mice. MGCs and COCs were cultured for 24 h in medium without (control) or with 0.1 μM E2. n=3. (g) Effect of E2 on NPPC-maintained oocyte meiotic arrest within COCs isolated from WT and ERKO mice. COCs were incubated in medium containing 0.03 μM NPPC or plus 0.1 μM E2 for 24 h. n=4. Data represent the mean±S.E.M. *P<0.05, **P<0.01 and ***P<0.001 (t-test)
Figure 4
Figure 4
ERs directly regulate Nppc and Npr2 gene transcription. (a) Expression of ERα and ERβ proteins in KK1 cells in response to E2 stimulation. KK1 cells were treated without (control) or with 0.1 μM E2 for 24 h. GAPDH served as a loading control. (b) Effect of E2 on Nppc and Npr2 levels in KK1 cells. KK1 cells were cultured for 24 h in medium containing 0.1 μM E2 or not (control). n=3. (c) Expression of ERα and ERβ proteins in KK1 cells after transfection with empty vector (control), flag-tagged mouse α-vector or β-vector for 48 h. ERα and ERβ protein levels were assessed using an anti-flag antibody. β-Actin served as a loading control. (d) Schematic diagram of Nppc and Npr2 genome structure. Each rectangle denotes 200 bp. Red rectangles represent the Nppc or Npr2 promoter binding sequences for ERα or ERβ. (e) ChIP-qPCR analysis of the interaction between ERα/ERβ proteins and Nppc/Npr2 promoters in KK1 cells. KK1 cells (transfection with empty vector, flag-tagged mouse α-vector or β-vector) were treated without (control) or with 0.1 μM E2 for 6 h. n=3. (f) The binding of ERα/ERβ to Nppc/Npr2 promoter regions detected by luciferase reporter assay. KK1 cells (transfection with pRL-TK plus flag-tagged mouse α-vector, β-vector or both) were treated without or with 0.1 μM E2 for 24 h. pRL-TK, an internal control plasmid to normalize firefly luciferase activity of the reporter plasmids. Nppc, Npp2-1 or Npr2-2 represent pGL3-basic plasmid containing −2000 to 1 regions of the Nppc gene, −616 to 1 or −2000 to −1260 regions of the Npr2 gene, respectively. n=4. Data represent the mean±S.E.M. *P<0.05, **P<0.01 and ***P<0.001 (t-test)
Figure 5
Figure 5
E2-ERs promote Nppc and Npr2 levels in human granulosa cells. (a) Expression of ERα and ERβ (red) in COV434 cells (upper) or COV434 cells after transfection with myc-tagged human α-vector or β-vector for 48 h (under). The nuclei were stained as blue by Hoechst. Scale bars: 25 μm. (b) WB analysis of ERα and ERβ protein levels in COV434 cells. COV434 cells were transfected with empty vector (control), myc-tagged human α-vector or β-vector for 48 h. GAPDH served as a loading control. (c) E2 failed to promote Nppc and Npr2 mRNA levels in COV434 cells. COV434 cells were cultured in medium without (control) or with 0.1 μM E2 for 24 h. Data represent the mean±S.E.M. n=3. (d) E2 increased Nppc and Npr2 mRNA levels in COV434 cells after transfection with myc-tagged human α-vector, β-vector or both. COV434 cells were incubated without (control) or with 0.1 μM E2 for 24 h. *P<0.05 and **P<0.01 (t-test). Data represent the mean±S.E.M. n=3. (e) Expression of ERα and ERβ (red) in human MGCs. Human MGCs were freshly isolated from ovulatory follicles, which were stimulated with FSH for 10 days, and followed by LH for 36 h. Human MGCs after transfection with myc-tagged human α-vector or β-vector for 48 h served as the corresponding positive control (upper). The nuclei were stained as blue by Hoechst. Scale bars: 25 μm. (f) Effect of E2 on Nppc and Npr2 mRNA levels in human MGCs. Human MGCs were freshly isolated from ovaries stimulated with FSH for 10 days followed by LH for 36 h and cultured for 24 h in medium containing 0.1 μM E2 or not (control). Data represent the mean±S.E.M. n=3
Figure 6
Figure 6
FSH and LH induce oocyte maturation by downregulating ER levels in vitro. (a) Effects of FSH and LH on oocyte maturation (referred to as GVB) in follicles. Freshly isolated follicles (0 h) were cultured in medium containing FSH or LH for the indicated period of time. *P<0.05, **P<0.01 and ***P<0.001 versus corresponding control (t-test). n=6. (b) Effects of FSH and LH on Nppc and Npr2 mRNA levels in follicles cultured for the indicated period of time. *P<0.05, **P<0.01 and ***P<0.001 versus corresponding control (t-test). n=3. (c) FSH and LH decreased ERα and ERβ levels in follicles. GAPDH served as a loading control. Graph shows the density quantification of WB band (normalization of target protein with respect to GAPDH). Bars represent mean of relative abundance, different letters (a-c) indicate significant differences between groups (P<0.05, ANOVA and Holm–Sidak test). (d) FSH and LH decreased Esr1 and Esr2 mRNA levels in follicles. Esr1 and Esr2 are the corresponding gene names of ERα and ERβ. *P<0.05, **P<0.01, ***P<0.001 versus corresponding control (t-test). n=3. (e) E2 failed to promote Nppc and Npr2 mRNA levels in follicles primed with FSH or LH for 4 h. **P<0.01 (t-test). n=3. Data represent the mean±S.E.M. FSH, 0.1 IU/ml; LH, 1.0 μg/ml; E2, 1.0 μM
Figure 7
Figure 7
Model depicting the role of E2-ERs in governing oocyte meiotic resumption in response to gonadotropin stimulation. FSH stimulates ER levels in granulosa cells in vivo, which can directly promote Nppc and Npr2 gene transcription in response to E2 stimulation, thus raising cGMP levels in CCs. Cyclic GMP thereby diffuses into the oocyte through gap junction and inhibits PDE3A activity and cAMP hydrolysis and maintains oocyte meiotic arrest. Conversely, LH decreases ERα and ERβ levels both in vivo and in vitro as FSH does in vitro, in turn decreasing NPPC/NPR2 and cGMP levels, thus triggering the hydrolysis of cAMP by PDE3A and oocyte resumes meiosis

Similar articles

Cited by

References

    1. Pincus G, Enzmann EV. The comparative behavior of mammalian eggs in vivo and in vitro: I. The activation of ovarian eggs. J Exp Med 1935; 62: 665–675. - PMC - PubMed
    1. Zhang M, Su YQ, Sugiura K, Xia G, Eppig JJ. Granulosa cell ligand NPPC and its receptor NPR2 maintain meiotic arrest in mouse oocytes. Science 2010; 330: 366–369. - PMC - PubMed
    1. Kiyosu C, Tsuji T, Yamada K, Kajita S, Kunieda T. NPPC/NPR2 signaling is essential for oocyte meiotic arrest and cumulus oophorus formation during follicular development in the mouse ovary. Reproduction 2012; 144: 187–193. - PubMed
    1. Wigglesworth K, Lee KB, O'Brien MJ, Peng J, Matzuk MM, Eppig JJ. Bidirectional communication between oocytes and ovarian follicular somatic cells is required for meiotic arrest of mammalian oocytes. Proc Natl Acad Sci USA 2013; 110: E3723–E3729. - PMC - PubMed
    1. Sela-Abramovich S, Edry I, Galiani D, Nevo N, Dekel N. Disruption of gap junctional communication within the ovarian follicle induces oocyte maturation. Endocrinology 2006; 147: 2280–2286. - PubMed

Publication types

MeSH terms

Substances

LinkOut - more resources