. 2017 Apr;12(4):732-747.
doi: 10.1038/nprot.2017.001. Epub 2017 Mar 9.

Decerebrate mouse model for studies of the spinal cord circuits

Affiliations

Decerebrate mouse model for studies of the spinal cord circuits

Claire F Meehan et al. Nat Protoc. 2017 Apr.

Abstract

The adult decerebrate mouse model (a mouse with the cerebrum removed) enables the study of sensory-motor integration and motor output from the spinal cord for several hours without compromising these functions with anesthesia. For example, the decerebrate mouse is ideal for examining locomotor behavior using intracellular recording approaches, which would not be possible using current anesthetized preparations. This protocol describes the steps required to achieve a low-blood-loss decerebration in the mouse and approaches for recording signals from spinal cord neurons with a focus on motoneurons. The protocol also describes an example application for the protocol: the evocation of spontaneous and actively driven stepping, including optimization of these behaviors in decerebrate mice. The time taken to prepare the animal and perform a decerebration takes ∼2 h, and the mice are viable for up to 3-8 h, which is ample time to perform most short-term procedures. These protocols can be modified for those interested in cardiovascular or respiratory function in addition to motor function and can be performed by trainees with some previous experience in animal surgery.


Conflict of interest statement

COMPETING FINANCIAL INTERESTS The authors declare no competing financial interests.

Figures

Figure 1 |
Figure 1 |
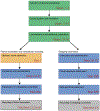
Procedural steps for creating a decerebrate preparation. Schematic block representation of decerebration procedure and steps to create a fictive or actual stepping preparation. The step numbers refer to the Procedure steps in the protocol.
Figure 2 |
Figure 2 |
Surgical preparation of carotid to artery ligation and tracheotomy. (a) Red dotted line indicates location of superficial cut along the midline of the neck. (b) Excavation of the superficial adipose tissue to expose the sternohyoid muscles. (c) Blunt dissection of the carotid artery and vagus nerve. (d) 6-0 sutures run underneath the carotid artery, avoiding the vagus nerve. (e) Unilateral tied sutures of the carotid artery. (f) Location of sternohyoid and sternomastoid muscles. (g) Separation of the sternohyoid muscle to expose the trachea. (h) 4-0 sutures run under the trachea for future use. (i) Tracheal cannula inserted into the trachea. (j) Tracheal cannula sutured into place for attaching to a ventilator. Local ethics committees approved the procedures shown here. This figure illustrates Steps 5–14 of the PROCEDURE.
Figure 3 |
Figure 3 |
Laminectomy with durotomy. (a) Representation of a three-vertebra laminectomy with dura mater attached. Rongeurs or laminectomy forceps are used to clip away the lamina. (b) Spinal cord with the dura mater in the process of being opened with small spring scissors. (c) The dura—held by forceps. (d) Close-up view of the image within the orange square in c. This laminectomy is suitable for application of substances and optogenetics, but smaller laminectomies can improve stability of the spinal cord, which is useful for intracellular recordings. This figure illustrates Steps 15–17 of the PROCEDURE. Local ethics committees approved the procedures shown here.
Figure 4 |
Figure 4 |
Intracellular recording and antidromic stimulation. (a) Intracellular recording setup as viewed from the right side of the animal, showing the use of Narashige clamps, which provides an excellent range of motion. (b) Alternative setup showing the use of Cunningham spinal clamps, which provides for greater working space on the dorsal surface due to the lateral placement of clamps. This figure illustrates to Step 18A of the PROCEDURE. Local ethics committees approved all procedures shown here.
Figure 5 |
Figure 5 |
Sciatic nerve isolation of the hind limb. (a) Superficial cut starting at the hip joint, proceeding straight to the knee joint and ending at the ankle joint. The location of the intersection point between the gluteal muscles and the biceps femoris is indicated by a thin white line in the tissue. White arrows identify muscle facia, and yellow arrow indicates the rostro-caudal orientation of the mouse. (b) Dissection of the gluteal muscles and the biceps femoris after cutting along the connecting line. (c) Visualization of the (1) sciatic nerve and the nerve branches consisting of the (2) tibial, (3) common peroneal, and (4) sural nerves. (d) The various branches of sciatic nerve shown in schematic form. Local ethics committees approved all procedures shown here. See REAGENTS section for details. This figure to illustrates Box 1, steps 1–5. Local ethics committees approved the procedures shown here.
Figure 6 |
Figure 6 |
Hind-limb securing and antidromic stimulation of nerves. (a) Hind-limb stimulation. Left hind limb is secured in a custom-made holder with nerves dissected. Red dashed box indicates the placement of hook electrodes with oil bath. (b) Stimulating hook electrodes (close-up view of the area outlined by the dashed red box in a). Two sets of hook electrodes are placed under the tibial nerve and common peroneal nerve for evoking antidromic action potentials. See REAGENTS section for details. This figure illustrates Box 1, steps 6 and 7. Local ethics committees approved all procedures shown here.
Figure 7 |
Figure 7 |
Craniotomy and decerebration cut location. (a) Craniotomy and brain exposure are performed by first scoring a square outline (red dashed box) between the lambda and the bregma using an electric handheld drill. The mouse rongeur tool is used to remove the skull as one piece by lifting the scored area, exposing the brain and meninges. (b) Superior sagittal sinus vein and other major vasculature are cauterized using hand cauterization tool (Acu-Tip Portable or Bovie Change-A-Tip) at the most caudal end to reduce bleeding. (c) Schematic representation of the removal of the cerebral cortex (decerebration) and underlying structures. Decerebration is performed with a no. 10 round blade, cutting through the brain at a 45° angle; cut is represented by an asterisk and the red dotted line. (d) Rostral portion of brain is carefully removed from the cut (asterisk) using a microspatula and without damage to the remaining caudal section. In the absence of the rostral brain, the remaining cavity is filled with a hemostatic sponge and/or Surgicel. This figure illustrates Steps 20–27 of the PROCEDURE. Local ethics committees approved all procedures shown here.
Figure 8 |
Figure 8 |
Comparison of intracellular recordings from a motoneuron and a candidate interneuron. These intracellular recordings were performed in adult female C57BL/6J mice, and all recordings in decerebrates were performed at least 2 h after removal of isoflurane from the ventilation flow, to allow for metabolism of the isoflurane. (a) Average antidromic action potentials (n = 18) from stimulation of the sciatic nerve, recorded from a motoneuron in a decerebrate mouse. (b) An average of six spontaneous action potentials recorded in a candidate ventral horn interneuron in an anesthetized mouse. (c) Repetitive firing (middle trace) evoked in a motoneuron in a decerebrate mouse following intracellular ramp current injection (lower trace). Upper trace shows instantaneous firing frequency. (d) Repetitive firing evoked (middle trace) in the same interneuron as in b, following intracellular current injection (lower trace). Upper trace shows instantaneous firing frequency. (e) Graph showing an example If slope obtained for a ventral horn interneuron (green) in a mouse. This can be compared with an example of a typical If slope from a mouse motoneuron (light blue) and an example of one of the steepest If slopes that we have recorded over the years (from a presumptive fast motoneuron, darker blue). (f) Comparison of current–frequency (If) slopes recorded from individual motoneurons (single dots) in decerebrate mice and in mice under different anesthesia types (n = 99 motoneurons (decerebrate n = 21 cells from 3 mice, Hypnorm & midazolam n = 21 cells from 5 mice, ketamine & xylazine n = 24 cells from 4 mice, sodium pentobarbital n = 33 cells from 5 mice; a total of 18 mice were used)). Horizontal lines and error bars represent mean ± s.d. Cells from individual mice within each group are color-coded. The data in this figure come from a series of experiments designed specifically to compare If slopes in decerebrate mice with those of anesthetized mice and so all parameters were kept constant (and the examples from e are not included). (g) Current clamp (upper two traces) and voltage clamp (lower two traces) of a series of intracellular recorded EPSPs in an adult mouse spinal motoneuron in vivo evoked by stimulation of the tibial nerve. (h) The IV function recorded under voltage clamp during a voltage ramp command. A negative inflection is seen at ~−53 mV, consistent with the onset of persistent inward currents calculated by measuring the deviation of the negative slope region from the theoretical line expected without their activation. Local ethics committees approved all procedures used to obtain these results. See REAGENTS section for details.
Figure 9 |
Figure 9 |
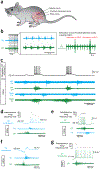
Evoking fictive locomotion in a decerebrate mouse after L-DOPA treatment. (a) Schematic illustrating the spinal cord and the dissected peripheral nerve branches of the sciatic nerve: the common peroneal (CP) and tibial (Tib) nerves. (b) The effects of peripheral nerve stimulation. Left: an example of rhythmic activity evoked by peripheral nerve stimulation (tested after L-DOPA administration and before spontaneous L-DOPA locomotion started). Right: once the L-DOPA-induced rhythm develops, the rhythm can be reset by stimulation of a peripheral nerve (in this case the nerve branches innervate posterior biceps and semitendinosus (PBST) muscles). In this example, the rhythm was enhanced by a rostral spinalization. (c) Intracellular recording from a CP motoneuron (upper trace) during a period of L-DOPA-evoked fictive locomotion. This is depicted as rhythmic ENG activity (lower traces) alternating between nerves innervating flexor muscles (CP) and nerves innervating extensor muscle (Tib) extensor on a single side. (d) An example of a recording from a Tib motoneuron showing a decrementing pattern of discharge during the active phase on the corresponding ENG recorded from the Tib nerve. Note the inhibition of the Vm of the motoneuron during the active phase of the antagonist nerve (CP). (e) An example of a recording from a CP motoneuron showing an incrementing pattern of discharge during the active phase on the corresponding CP ENG. Inhibition is also seen during the antagonist (Tib) ENG phase. (f) An example of a recording from a slightly more hyperpolarized Tib motoneuron, revealing a clear phase of inhibition and excitation during the active phases of the Tib and CP nerve ENG, respectively. (g) An example of a recording from a CP motoneuron showing an initial high-frequency burst of action potentials (a quadruplet) at spike onset, followed by a rapidly decrementing pattern. Local ethics committees approved all procedures used to obtain the results shown here. See REAGENTS section for details. ENG, electroneurogram.
Figure 10 |
Figure 10 |
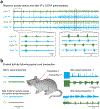
Effect of spinalization on fictive locomotion. (a) Spontaneous locomotion recorded from common peroneal (CP) and tibial (Tib) ENGs after administration of L-DOPA. Lower left insert shows zoomed in section illustrating slow synchronous activity on all nerves. Lower right insert shows a time period later in the recording, at which the activity on all nerves is faster, with alternation between left and right legs and flexor and extensors. (b) An example of the effect of spinalization on rhythmic activity. L-DOPA-induced locomotion had ceased. A spinalization at the cervical level resulted in rhythmic activity between the flexor nerve, CP, and the extensor nerve, gastrocnemius (Gast). Once locomotion ceased, it could be elicited again by a second thoracic spinal transection. Local ethics committees approved all procedures used to produce data shown here.
Figure 11 |
Figure 11 |
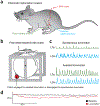
Assisted and spontaneous locomotion evoked on clutch-driven treadmill. (a) Schematic representation of the left side of the mouse, with EMG electrode insertion into the tibialis anterior and gastrocnemius muscles. The EMG cable is secured subcutaneously to reduce EMG motion artifacts. (b) Schematic of the free-wheel treadmill with clutch system allowing for spontaneous and assisted treadmill locomotion. (c) Example traces of spontaneous and assisted locomotion from CFW decerebrate mice—EMG traces were recorded from the left tibialis anterior (LTa) and gastrocnemius (LGn). (d) Example trace of a 40-s bout of locomotion demonstrating the weight-bearing at baseline compared with weight-bearing during intrathecal administration of dopamine using a force transducer. Weight change in the force transducer is inversely proportional to the weight-bearing by the mouse. The black bars indicate the stance phase of the left and right limbs. Local ethics committees approved all procedures used to produce data shown here. See REAGENTS section for details. Figure 11 refers to Step 28B of the PROCEDURE.
Figure 12 |
Figure 12 |
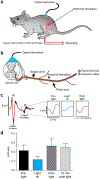
Photostimulation of the dorsal L4/L5 spinal cord reduces amplitude of monosynaptic reflex. (a) Schematic representation of stimulation and recording setup. (b) Electrical stimulation of the sciatic nerve was performed on VGAT-ChR2 (H134R)-EYFP-BAC mice in the presence and absence of trains of photostimulation targeted toward VGAT neurons in the spinal cord. Photostimulation was accomplished using an array of six micro-LEDs in a flexible silicone bilayer, allowing stimulation of the surface of the spinal cord. (c) Example traces show a reduction in the H-reflex recorded from the flexor digitorum brevis (marked H in diagram) and expanded in right panels to show reduction in the H-reflex amplitude during light-on conditions. (d) Graph summarizing effects across conditions. Error bars refer to mean ± s.d. n = 20 for each bar. Local animal ethics committees approved these procedures. See REAGENTS section for details. Local ethics committees approved all procedures used to produce results shown here.

Similar articles

Cited by

References

    1. Kiehn O Development and functional organization of spinal locomotor circuits. Curr. Opin. Neurobiol 21, 100–109 (2011). - PubMed
    1. Grossmann KS, Giraudin A, Britz O, Zhang J & Goulding M Genetic dissection of rhythmic motor networks in mice. Prog. Brain Res 187, 19–37 (2010). - PMC - PubMed
    1. Whelan PJ Shining light into the black box of spinal locomotor networks. Philos. Trans. R. Soc. Lond. B Biol. Sci 365, 2383–2395 (2010). - PMC - PubMed
    1. Dougherty KJ et al. Locomotor rhythm generation linked to the output of spinal shox2 excitatory interneurons. Neuron 80, 920–933 (2013). - PubMed
    1. Lanuza GM, Gosgnach S, Pierani A, Jessell TM & Goulding M Genetic identification of spinal interneurons that coordinate left-right locomotor activity necessary for walking movements. Neuron 42, 375–386 (2004). - PubMed

Publication types

LinkOut - more resources