. 2017 Mar 1;58(3):1521-1528.
doi: 10.1167/iovs.16-20824.

In Vivo Bioluminescence Imaging for Longitudinal Monitoring of Inflammation in Animal Models of Uveitis

Affiliations

In Vivo Bioluminescence Imaging for Longitudinal Monitoring of Inflammation in Animal Models of Uveitis

Michal B Gutowski et al. Invest Ophthalmol Vis Sci. .

Abstract

Purpose: We develop a quantitative bioluminescence assay for in vivo longitudinal monitoring of inflammation in animal models of uveitis.

Methods: Three models of experimental uveitis were induced in C57BL/6 albino mice: primed mycobacterial uveitis (PMU), endotoxin-induced uveitis (EIU), and experimental autoimmune uveitis (EAU). Intraperitoneal injection of luminol sodium salt, which emits light when oxidized, provided the bioluminescence substrate. Bioluminescence images were captured by a PerkinElmer In Vivo Imaging System (IVIS) Spectrum and total bioluminescence was analyzed using Living Image software. Bioluminescence on day zero was compared to bioluminescence on the day of peak inflammation for each model. Longitudinal bioluminescence imaging was performed in EIU and EAU.

Results: In the presence of luminol, intraocular inflammation generates detectable bioluminescence in three mouse models of uveitis. Peak bioluminescence in inflamed PMU eyes (1.46 × 10⁵ photons/second [p/s]) was significantly increased over baseline (1.47 × 10⁴ p/s, P = 0.01). Peak bioluminescence in inflamed EIU eyes (3.18 × 10⁴ p/s) also was significantly increased over baseline (1.09 × 10⁴ p/s, P = 0.04), and returned to near baseline levels by 48 hours. In EAU, there was a nonsignificant increase in bioluminescence at peak inflammation.

Conclusions: In vivo bioluminescence may be used as a noninvasive, quantitative measure of intraocular inflammation in animal models of uveitis. Primed mycobacterial uveitis and EIU are both acute models with robust anterior inflammation and demonstrated significant changes in bioluminescence corresponding with peak inflammation. Experimental autoimmune uveitis is a more indolent posterior uveitis and generated a more modest bioluminescent signal. In vivo imaging system bioluminescence is a nonlethal, quantifiable assay that can be used for monitoring inflammation in animal models of uveitis.


Figures

Figure 1
Figure 1
Time course of inflammation for three uveitis models. Endotoxin-induced uveitis peaks 18 hours after intravitreal LPS injection and resolves by 48 hours. Primed mycobacterial uveitis is initiated with a subcutaneous injection of killed mycobacterial injection 7 days before intravitreal injection of killed mycobacterial extract and peaks 2 days later. Experimental autoimmune uveitis peaks at day 21 after subcutaneous injection of IRBP peptide in complete Freund's adjuvant.
Figure 2
Figure 2
Luminol bioluminescence detection of inflammation in PMU. Day 2 bioluminescence images of (A) an uninflamed left eye and (B) an inflamed right eye. Color scale reflects photon density (red for highest density). Total bioluminescence = 1.5 × 10⁵ p/s in the inflamed eye region of interest. (C) Left and (D) right eye OCT on day 2. The inflamed eye (D) demonstrates corneal edema (bracket), AC cell (arrowheads), and pupillary membrane (arrow). Histology of the (E) left and (F) right eyes on day two verifies the absence (E) and presence (F) of inflammation. (G) Total bioluminescence on day 2 from right and left eyes. The difference between the average bioluminescence of inflamed eyes on day 2 (1.46 × 10⁵ p/s) and at baseline (1.47 × 10⁴ p/s) was significant (P = 0.01).
Figure 3
Figure 3
Luminol bioluminescence detection of inflammation in EIU. Optical coherence tomography of the anterior chamber (AC) and the vitreous and retina (DF) at times 0, 18, and 48 hours. Corneal edema (yellow brackets), small pupillary membrane (arrow), and hypopyon (arrowhead), and vitritis (white bracket) are seen at 18 hours. At 48 hours, the hypopyon is decreased in size (arrowhead), and there is less vitritis. (GI) Bioluminescence images at (G) time 0, (H) 18 hours, and (I) 48 hours. (J) Bioluminescence at 18 hours from right and left eyes. The difference between the average total bioluminescence of all right eyes at time zero (1.09 × 10⁴ p/s) and at 18 hours (3.18 × 10⁴ p/s) was significant (P = 0.04). Longitudinal imaging performed demonstrated peak bioluminescence at 18 hours, and decline in bioluminescence by 48 hours.
Figure 4
Figure 4
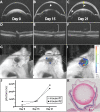
Luminol bioluminescence detection of inflammation in EAU. Optical coherence tomography of the anterior chamber (AC) and the vitreous and retina (DF) at days 0, 15, and 21. Corneal edema (yellow brackets), rare AC cells (arrowheads), and vitritis (white bracket) develop over the course of inflammation. Bioluminescence images on days (G) 0, (H) 15, and (I) 21. Ocular bioluminescence at day 21 = 2.9 × 10⁴ p/s. (J) Change in bioluminescence in 2 animals. (K) Postmortem histology after imaging on 21 confirms inflammation for the eye shown in (AI).
Figure 5
Figure 5
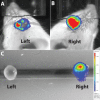
Ex vivo imaging eliminates nonspecific conjunctival bioluminescence in a control eye. Imaging of a PMU animal on day 2. (A) Control left eye shows unexpected bioluminescence. (B) Inflamed right eye shows the expected high levels of bioluminescence. (C) Repeat imaging after enucleation and removal of extraocular tissue.

References

    1. Caspi RR. Understanding autoimmune uveitis through animal models. The Friedenwald Lecture. Invest Ophthalmol Vis Sci. 2011; 52: 1872–1879. - PMC - PubMed
    1. Dick AD,, Cheng YF,, McKinnon A,, Liversidge J,, Forrester JV. Nasal administration of retinal antigens suppresses the inflammatory response in experimental allergic uveoretinitis. A preliminary report of intranasal induction of tolerance with retinal antigens. Br J Ophthalmol. 1993; 77: 171–175. - PMC - PubMed
    1. Agarwal RK,, Silver PB,, Caspi RR. Rodent models of experimental autoimmune uveitis. Methods Mol Biol. 2012; 900: 443–469. - PMC - PubMed
    1. Thurau SR,, Chan CC,, Nussenblatt RB,, Caspi RR. Oral tolerance in a murine model of relapsing experimental autoimmune uveoretinitis (EAU): induction of protective tolerance in primed animals. Clin Exp Immunol. 1997; 109: 370–376. - PMC - PubMed
    1. Xu H,, Koch P,, Chen M,, Lau A,, Reid DM,, Forrester JV. A clinical grading system for retinal inflammation in the chronic model of experimental autoimmune uveoretinitis using digital fundus images. Exp Eye Res. 2008; 87: 319–326. - PubMed

Publication types

LinkOut - more resources