A Prospective, Multi-institutional, Pathologist-Based Assessment of 4 Immunohistochemistry Assays for PD-L1 Expression in Non-Small Cell Lung Cancer
- PMID: 28278348
- PMCID: PMC5650234
- DOI: 10.1001/jamaoncol.2017.0013
A Prospective, Multi-institutional, Pathologist-Based Assessment of 4 Immunohistochemistry Assays for PD-L1 Expression in Non-Small Cell Lung Cancer
Abstract
Importance: Four assays registered with the US Food and Drug Administration (FDA) detect programmed cell death ligand 1 (PD-L1) to enrich for patient response to anti-programmed cell death 1 and anti-PD-L1 therapies. The tests use 4 separate PD-L1 antibodies on 2 separate staining platforms and have their own scoring systems, which raises questions about their similarity and the potential interchangeability of the tests.
Objective: To compare the performance of 4 PD-L1 platforms, including 2 FDA-cleared assays, 1 test for investigational use only, and 1 laboratory-developed test.
Design, setting, and participants: Four serial histologic sections from 90 archival non-small cell lung cancers from January 1, 2008, to December 31, 2010, were distributed to 3 sites that performed the following immunohistochemical assays: 28-8 antibody on the Dako Link 48 platform, 22c3 antibody on the Dako Link 48 platform, SP142 antibody on the Ventana Benchmark platform, and E1L3N antibody on the Leica Bond platform. The slides were scanned and scored by 13 pathologists who estimated the percentage of malignant and immune cells expressing PD-L1. Statistical analyses were performed from December 1, 2015, to August 30, 2016, to compare antibodies and pathologists' scoring of tumor and immune cells.
Main outcomes and measures: Percentages of malignant and immune cells expressing PD-L1.
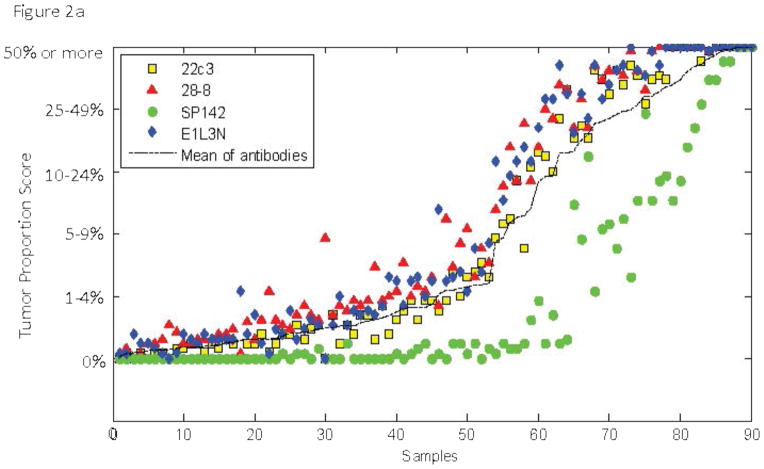
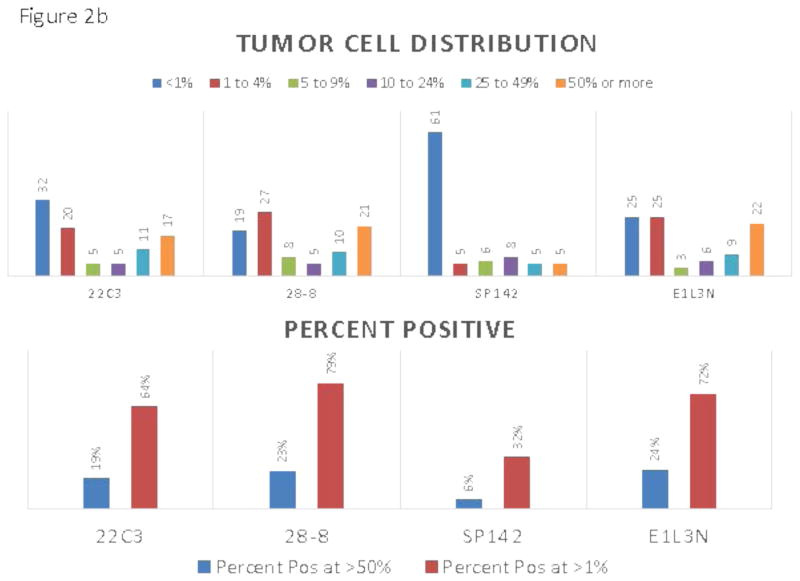
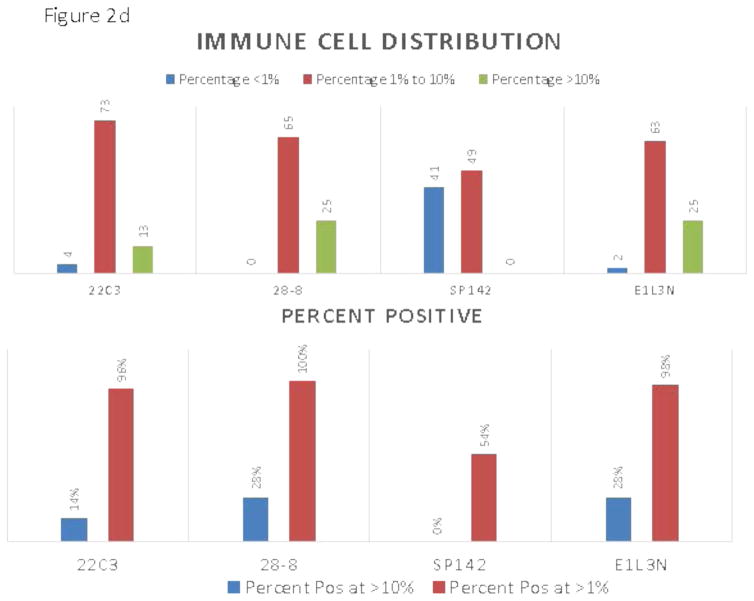
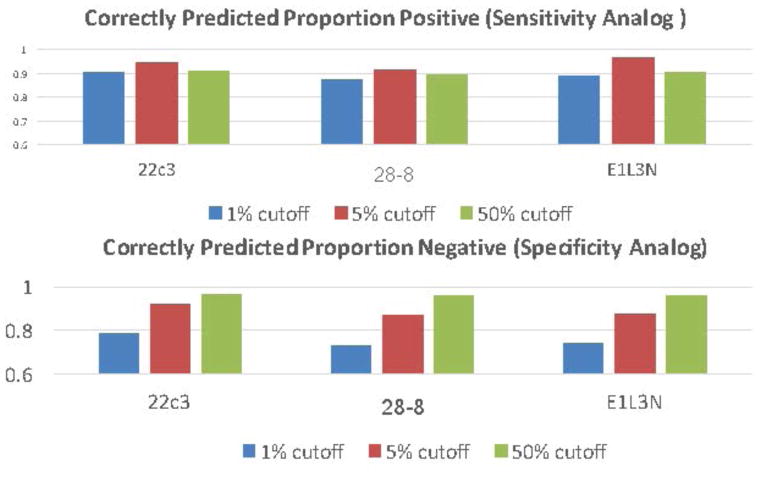
Results: Among the 90 samples, the SP142 assay was an outlier, with a significantly lower mean score of PD-L1 expression in both tumor and immune cells (tumor cells: 22c3, 2.96; 28-8, 3.26; SP142, 1.99; E1L3N, 3.20; overall mean, 2.85; and immune cells: 22c3, 2.15; 28-8, 2.28; SP142, 1.62; E1L3N, 2.28; overall mean, 2.08). Pairwise comparisons showed that the scores from the 28-8 and E1L3N tests were not significantly different but that the 22c3 test showed a slight (mean difference, 0.24-0.30) but statistically significant reduction in labeling of PD-L1 expression in tumor cells. Evaluation of intraclass correlation coefficients (ICCs) between antibodies to quantify interassay variability for PD-L1 expression in tumor cells showed high concordance between antibodies for tumor cell scoring (0.813; 95% CI, 0.815-0.839) and lower levels of concordance for immune cell scoring (0.277; 95% CI, 0.222-0.334). When examining variability between pathologists for any single assay, the concordance between pathologists' scoring for PD-L1 expression in tumor cells ranged from ICCs of 0.832 (95% CI, 0.820-0.844) to 0.882 (95% CI, 0.873-0.891) for each assay, while the ICCs from immune cells for each assay ranged from 0.172 (95% CI, 0.156-0.189) to 0.229 (95% CI, 0.211-0.248).
Conclusions and relevance: The assay using the SP142 antibody is an outlier that detected significantly less PD-L1 expression in tumor cells and immune cells. The assay for antibody 22c3 showed slight yet statistically significantly lower staining than either 28-8 or E1L3N, but this significance was detected only when using the mean of 13 pathologists' scores. The pathologists showed excellent concordance when scoring tumor cells stained with any antibody but poor concordance for scoring immune cells stained with any antibody. Thus, for tumor cell assessment of PD-L1, 3 of the 4 tests are concordant and reproducible as read by pathologists.
Figures


Comment in
-
Assays for PD-L1 Expression: Do All Roads Lead to Rome?JAMA Oncol. 2017 Aug 1;3(8):1058-1059. doi: 10.1001/jamaoncol.2017.0012. JAMA Oncol. 2017. PMID: 28278316 No abstract available.
References
-
- Hayes DF, Bast RC, Desch CE, et al. Tumor marker utility grading system: a framework to evaluate clinical utility of tumor markers. J Natl Cancer Inst. 1996 Oct 16;88(20):1456–1466. - PubMed
Publication types
MeSH terms
Substances
Grants and funding
LinkOut - more resources
Full Text Sources
Other Literature Sources
Medical
Research Materials