

Diagnostic Efficiency of the Child and Adolescent Symptom Inventory (CASI-4R) Depression Subscale for Identifying Youth Mood Disorders
- PMID: 28278596
- PMCID: PMC5801256
- DOI: 10.1080/15374416.2017.1280807
Diagnostic Efficiency of the Child and Adolescent Symptom Inventory (CASI-4R) Depression Subscale for Identifying Youth Mood Disorders
Abstract
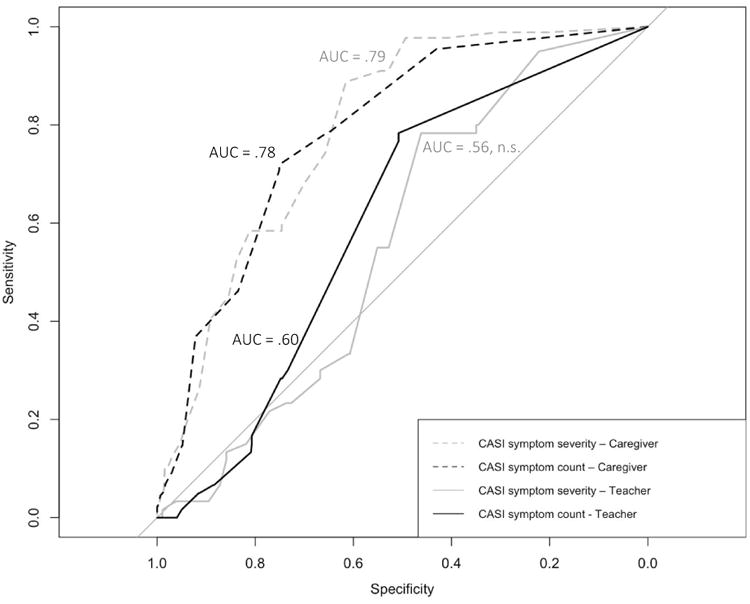
This study examined the diagnostic and clinical utility of the Child and Adolescent Symptom Inventory-4 R (CASI-4 R) Depressive and Dysthymia subscale for detecting mood disorders in youth (ages 6-12; M = 9.37) visiting outpatient mental health clinics. Secondary analyses (N = 700) utilized baseline data from the Longitudinal Assessment of Manic Symptoms study. Semistructured interviews with youth participants and their parents/caregivers determined psychiatric diagnoses. Caregivers and teachers completed the CASI-4 R. CASI-4 R depressive symptom severity and symptom count scores each predicted mood disorder diagnoses. Both caregiver scores (symptom severity and symptom count) of the CASI-4 R subscale significantly identified youth mood disorders (areas under the curve [AUCs] = .78-.79, ps < .001). The symptom severity version showed a small but significant advantage. Teacher symptom severity report did not significantly predict mood disorder diagnosis (AUC = .56, p > .05), whereas the teacher symptom count report corresponded to a small effect size (AUC = .61, p < .05). The CASI-4 R Depression scale showed strong incrememental validity even controlling for the other CASI-4 R scales. Caregiver subscale cutoff scores were calculated to assist in ruling in (diagnostic likelihood ratio [DLR] = 3.73) or ruling out (DLR = 0.18) presence of a mood disorder. The CASI-4 R Depressive subscale caregiver report can help identify youth mood disorders, and using DLRs may help improve diagnostic accuracy.
Figures
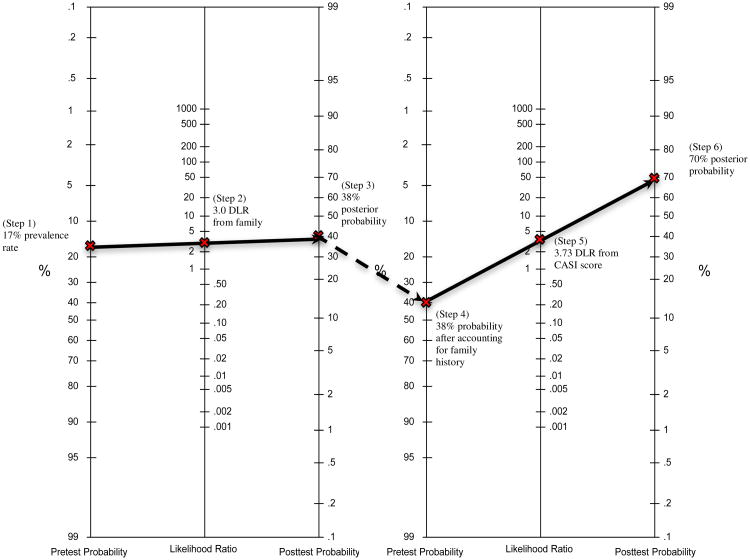
Select the pretest probability and plot it on the first line on the left side of the nomogram. In this example, we use 17% as the base rate of depressive disorders in an outpatient clinic.
Determine and plot the diagnostic likelihood ratio (DLR) associated with the risk factor on the second line. For instance, we found that depression in parents is associated with a three-fold increase in risk for developing major depression (DLR = 3.0; Weissman et al., 2006).
Connect the dots and extend the line to the third line to determine that the posttest probability estimate is 38%.
To incorporate additional information, repeat the process using the posttest probability as the new pretest probability estimate in the second nomogram.
Plot the DLR associated with the parent's CASI depression severity score; in this example, a score of 17 corresponds to a DLR of 3.73 (see Table 3).
Connect the dots to determine the new posttest probability estimate of 70%.
Similar articles
-
Comparing the CASI-4R and the PGBI-10 M for Differentiating Bipolar Spectrum Disorders from Other Outpatient Diagnoses in Youth.J Abnorm Child Psychol. 2017 Apr;45(3):611-623. doi: 10.1007/s10802-016-0182-4. J Abnorm Child Psychol. 2017. PMID: 27364346 Free PMC article.
-
Diagnostic accuracy of the Child and Adolescent Symptom Inventory (CASI-4R) substance use subscale in detecting substance use disorders in youth.Psychol Assess. 2023 Feb;35(2):178-187. doi: 10.1037/pas0001182. Epub 2022 Nov 28. Psychol Assess. 2023. PMID: 36442043
-
Diagnostic Efficiency of Caregiver Report on the SCARED for Identifying Youth Anxiety Disorders in Outpatient Settings.J Clin Child Adolesc Psychol. 2018;47(sup1):S161-S175. doi: 10.1080/15374416.2016.1188698. Epub 2016 Aug 2. J Clin Child Adolesc Psychol. 2018. PMID: 27485325 Free PMC article.
-
Mood disorders in children and adolescents.J Pediatr Nurs. 2009 Feb;24(1):13-25. doi: 10.1016/j.pedn.2008.04.007. Epub 2008 Oct 15. J Pediatr Nurs. 2009. PMID: 19159832 Review.
-
Assessment of depression after stroke: a comparison of different screening instruments.Stroke. 2009 Feb;40(2):523-9. doi: 10.1161/STROKEAHA.108.527705. Epub 2008 Dec 12. Stroke. 2009. PMID: 19074478 Review.
Cited by
-
Youth Depression Screening with Parent and Self-Reports: Assessing Current and Prospective Depression Risk.Child Psychiatry Hum Dev. 2019 Aug;50(4):647-660. doi: 10.1007/s10578-019-00869-6. Child Psychiatry Hum Dev. 2019. PMID: 30737605 Free PMC article.
-
Girls' brain structural connectivity in late adolescence relates to history of depression symptoms.J Child Psychol Psychiatry. 2020 Nov;61(11):1224-1233. doi: 10.1111/jcpp.13184. Epub 2019 Dec 26. J Child Psychol Psychiatry. 2020. PMID: 31879977 Free PMC article.
-
Parental reflective functioning and internalizing symptoms predict altruistic prosocial behaviour in children.Br J Dev Psychol. 2025 Sep;43(3):755-770. doi: 10.1111/bjdp.12551. Epub 2025 Feb 17. Br J Dev Psychol. 2025. PMID: 39962726 Free PMC article.
-
Measurement-Based Care for Depression in Youth: Practical Considerations for Selecting Measures to Assess Depression, Associated Features and Functioning.Child Psychiatry Hum Dev. 2024 Jan 13. doi: 10.1007/s10578-023-01652-4. Online ahead of print. Child Psychiatry Hum Dev. 2024. PMID: 38217644 Review.
-
Agreement and Discrepancy on Emotional and Behavioral Problems Between Caregivers and HIV-Infected Children and Adolescents From Uganda.Front Psychiatry. 2019 Jul 11;10:460. doi: 10.3389/fpsyt.2019.00460. eCollection 2019. Front Psychiatry. 2019. PMID: 31354539 Free PMC article.
References
-
- Achenbach TM, Rescorla LA. Manual for the ASEBA School-Age Forms & Profiles. Burlington, VT: University of Vermont; 2001.
-
- Ægisdóttir S, White MJ, Spengler PM, Maugherman AS, Anderson LA, Cook RS, et al. Cohen G. The meta-analysis of clinical judgment project: Fifty-six years of accumulated research on clinical versus statistical prediction. The Counseling Psychologist. 2006;34(3):341–382. doi: 10.1177/0011000005285875. - DOI
-
- American Psychiatric Association. The Diagnostic and Statistical Manual of Mental Disorders: DSM-5. 5th. Arlington, VA: American Psychiatric Publishing, Inc; 2013.
-
- Bayes T, Price R. An Essay towards solving a Problem in the Doctrine of Chances. By the late Rev. Mr. Bayes, communicated by Mr. Price, in a letter to John Canton, M. A. and F. R. S. Philosophical Transactions of the Royal Society of London (1683-1775) 1763;53:370–418.
Publication types
MeSH terms
Grants and funding
LinkOut - more resources
Full Text Sources
Other Literature Sources
Medical