. 2017 May:126:61-74.
doi: 10.1016/j.biomaterials.2017.02.024. Epub 2017 Feb 21.

Engineered microenvironments for synergistic VEGF - Integrin signalling during vascularization

Affiliations

Engineered microenvironments for synergistic VEGF - Integrin signalling during vascularization

Vladimíra Moulisová et al. Biomaterials. 2017 May.

Abstract

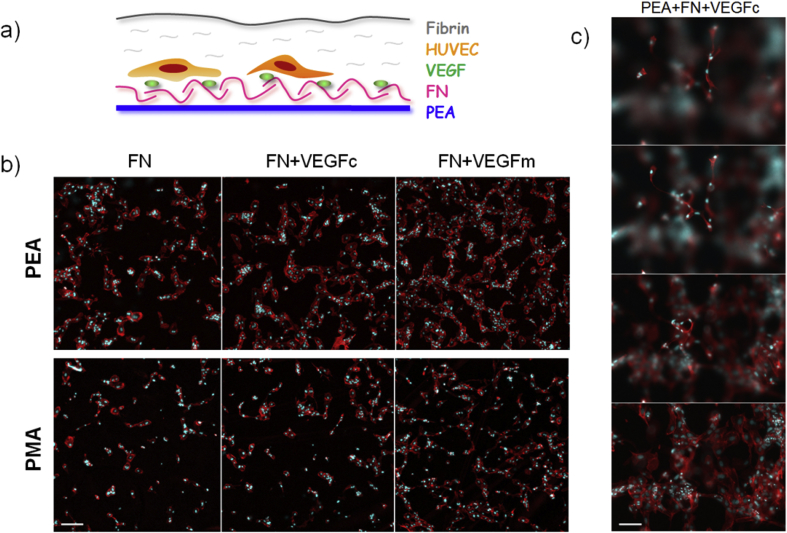
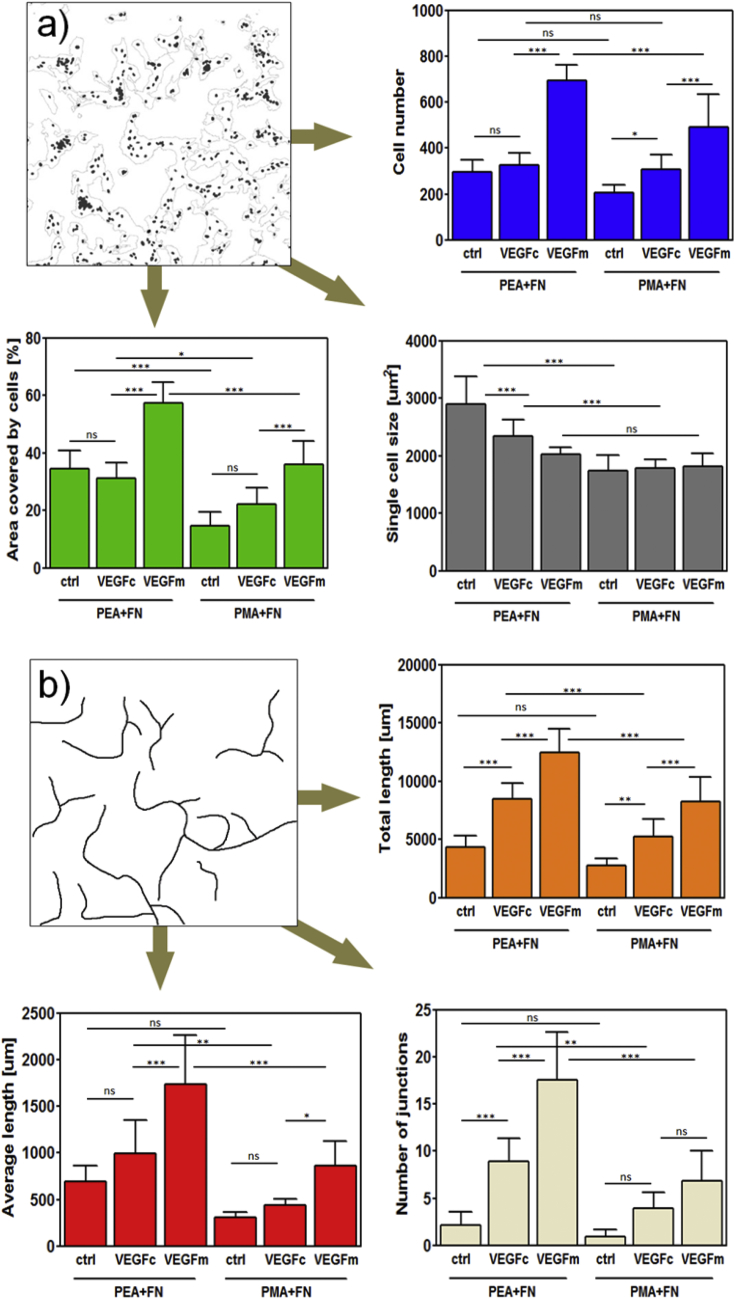
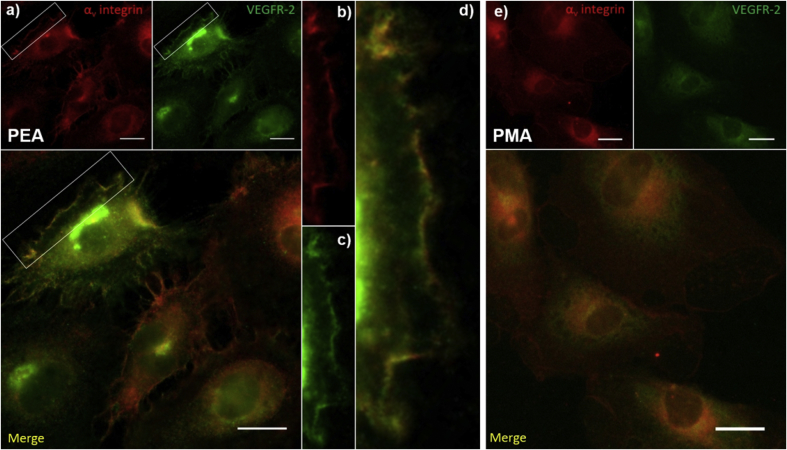
We have engineered polymer-based microenvironments that promote vasculogenesis both in vitro and in vivo through synergistic integrin-growth factor receptor signalling. Poly(ethyl acrylate) (PEA) triggers spontaneous organization of fibronectin (FN) into nanonetworks which provide availability of critical binding domains. Importantly, the growth factor binding (FNIII12-14) and integrin binding (FNIII9-10) regions are simultaneously available on FN fibrils assembled on PEA. This material platform promotes synergistic integrin/VEGF signalling which is highly effective for vascularization events in vitro with low concentrations of VEGF. VEGF specifically binds to FN fibrils on PEA compared to control polymers (poly(methyl acrylate), PMA) where FN remains in a globular conformation and integrin/GF binding domains are not simultaneously available. The vasculogenic response of human endothelial cells seeded on these synergistic interfaces (VEGF bound to FN assembled on PEA) was significantly improved compared to soluble administration of VEGF at higher doses. Early onset of VEGF signalling (PLCγ1 phosphorylation) and both integrin and VEGF signalling (ERK1/2 phosphorylation) were increased only when VEGF was bound to FN nanonetworks on PEA, while soluble VEGF did not influence early signalling. Experiments with mutant FN molecules with impaired integrin binding site (FN-RGE) confirmed the role of the integrin binding site of FN on the vasculogenic response via combined integrin/VEGF signalling. In vivo experiments using 3D scaffolds coated with FN and VEGF implanted in the murine fat pad demonstrated pro-vascularization signalling by enhanced formation of new tissue inside scaffold pores. PEA-driven organization of FN promotes efficient presentation of VEGF to promote vascularization in regenerative medicine applications.

Keywords: Fibronectin; Growth factors; Protein assembly; VEGF; Vascularization; poly(ethyl acrylate).


Figures

Image 1
Graphical abstract
Fig. 1
Fig. 1
Integrin-VEGF synergistic signalling triggered by FN organized into nanonetworks on PEA. a) Fibronectin molecule with domains depicted; b) fibronectin assembly on two different polymer substrates; on PMA it remains in globular conformation, whereas on PEA, FN assembly is triggered and networks are assembled; c) scheme of synergistic effect of VEGF bound to FN on cell signalling: the presentation of VEGF bound to FN in close vicinity of integrin binding site effectively enhances outside-in signalling and allows to VEGFR and integrins to work in synergy.
Fig. 2
Fig. 2
Characterization of VEGF binding to FN-coated PEA and PMA: a) VEGF bound to FN-coated PEA and PMA substrates assessed by ELISA. b) Availability of GF binding domains of FN was higher on PEA than on PMA c) AFM images of FN-coated PEA incubated with and without VEGF - images show stretched FN molecules (with monomer length ∼ 50 nm). Blue arrows depict approximate position of FNIII12-14 domains (GF binding site) with no GF present, green arrows show thickening of FNIII12-14 domains, suggesting presence of VEGF molecules. d) Scheme of immunogold binding to VEGF immobilized on surface. An expected structure height was estimated based on PDB structures 2VPF and 1IGY used for VEGF and IgG representation, respectively; structures were processed in PyMol (scheme not to scale). e) AFM imaging of FN-coated substrates after immunogold reaction with VEGF in presence of the GF (left) and without (right). White peaks represent VEGF bound to PEA whereas no VEGF was detected on PMA (left). Only FN network (PEA) or scattered FN molecules (PMA) are visible on VEGF negative controls (right). Unpaired two-tailed t-test was performed for statistical analysis; ***P < 0.001; ns = non-significant. (For interpretation of the references to colour in this figure legend, the reader is referred to the web version of this article.)
Fig. 3
Fig. 3
HUVEC forming network structures on functionalized substrates: a) Scheme of system components: After polymers were coated with FN and VEGF, cells were seeded on the top and finally covered with a thin layer of fibrin matrix. b) Fluorescence images of cell cultures after 6 days: FN+VEGFc coated PEA showed higher degree of aligned structures in comparison to PMA (central images), negative controls (samples with no GF coating) and positive controls (samples with no GF coating but with VEGF constantly present in media) are also shown (left and right, resp.); scale bar represents 200 μm c) Stack images showing 3D sprouting of HUVEC cells into the fibrin matrix on PEA+FN+VEGFc: bottom image is at the level of synthetic polymer substrate, height difference between bottom and top image is 200 μm; scale bar represents 100 μm.
Fig. 4
Fig. 4
Image analysis of HUVEC behavior on functionalized substrates: a) A merged image of DAPI staining and a mask from actin staining; these raw images were used for quantification of cell count and cell spreading after 6 days of culture. The cell number (blue bars) did not vary apart from FN+VEGFm controls (FN-coated polymer substrates with VEGF present in medium). The total area coverage (green bars) was higher on PEA when compared to PMA for individual conditions: FN coated only (FN), FN and VEGF coated (FN+VEGFc), and FN-coated with VEGF in medium (FN+VEGFm), revealing better spreading on PEA-FN surfaces. This is supported by larger single cell area (grey bars) on PEA samples when comparing PEA+FN vs. PMA+FN and also PEA+FN+VEGFc vs. PMA+FN+VEGFc. b) Simplified binary image of actin staining used for quantification of cell organization; statistical analysis of total length of aligned structures per image (orange bars) as well as an average length of these structures (red bars) including number of junctions per image (cream bars) showed higher level of cell alignment on PEA+FN+VEGF samples when compared to their respective PMA+FN+VEGF controls. Total length and number of junctions were significantly higher in PEA+FN+VEGFc samples when compared to PEA+FN control, which clearly proved vasculogenic effect of VEGF coating. One way ANOVA with Tukey's multiple comparison post-test was done for statistical analysis; *P < 0.05; **P < 0.01; ***P < 0.001; ns = non-significant. (For interpretation of the references to colour in this figure legend, the reader is referred to the web version of this article.)
Fig. 5
Fig. 5
Effect of fibronectin RGD → RGE mutation on HUVEC behavior on PEA. a) Representative fluorescence images of HUVECs cultures after 6 days of incubation showed lower cell attachment and spreading on mFN-RGE coated surfaces when compared to mFN-WT (RGD). Scale bar represents 200 μm b) Image analysis of parameters characterizing cell attachment and formation of aligned structures revealed that the mutated mFN-RGE significantly decreased HUVEC numbers and spreading on PEA surfaces when compared to mFN-WT; this was valid also in presence of VEGF for both VEGF in coating (VEGFc) and VEGF in media (VEGFm) (blue, green and grey bar graphs). mFN-RGE also impaired the network formation in comparison to mFN-WT, in VEGFm samples (yellow, red and cream bar graphs), and partially in VEGFc samples (red bar graph). For statistical evaluation, one way ANOVA with Tukey's multiple comparison post-test was performed; *P < 0.05; **P < 0.01; ***P < 0.001; ns = non-significant. (For interpretation of the references to colour in this figure legend, the reader is referred to the web version of this article.)
Fig. 6
Fig. 6
Integrin αv and VEGF receptor colocalization in HUVEC on polymer+FN+VEGFc surfaces after 24 h of incubation: a) Cells on PEA coated with FN and VEGF (PEA+FN+VEGFc) stained in red for integrin αv and in green for VEGFR-2; top images represent individual channels while the bottom image shows their merge; white rectangles point out example area where both proteins were detected in the same location which resulted in yellow colour in the merge image. Detailed view of this area for integrin αv, VEGF receptor and their merge is shown on b), c) and d), respectively; e) Cells on PMA coated with FN and VEGF (PMA+FN+VEGFc) stained in the same way as on the PEA sample with individual red and green channels at the top and merge image at the bottom; integrin αv staining is present while clear VEGFR-2 staining is not obvious (the faint staining is mainly associated with background). Scale bar represents 20 μm on every image. (For interpretation of the references to colour in this figure legend, the reader is referred to the web version of this article.)
Fig. 7
Fig. 7
ERK1/2, PLCγ1 and FAK phosphorylation in HUVEC on PEA and PMA coated with fibronectin: a) ELISA quantification of pERK1/2 after 30 min incubation showed significantly higher phosphorylation in cells on PEA (green bars) than on PMA (orange bars). On PEA+FN substrates, VEGF-coated sample (VEGFc) showed higher level of ERK1/2 phosphorylation when compared to PEA+FN without VEGF (FN). PEA+FN sample with VEGF present in both coating and media (VEGFcm) showed no difference from PEA+FN+VEGFc, and PEA+FN with VEGF in media only (VEGFm) did not vary from PEA+FN control. b) Representative images of western blot membranes with detected phospho-PLCγ1 and phospho-FAK proteins in HUVEC lysates after 30 min and 2 h incubation, respectively; bands were normalized against α-tubulin; c) Quantification of phosphorylated proteins from phospho-PLCγ1 and phospho-FAK western blot bands. Enhanced VEGF signalling is observed on PEA+FN+VEGFc d) Scheme of individual VEGFR-2 and integrin signalling pathways towards ERK1/2 stimulation depicting the role of PLCγ1 and FAK as early effectors of VEGFR-2 and integrin signal transduction; phosphorylated mitogen-activated kinase 1 and 2 (ERK1/2) leads to activation of the c-Fos transcription factor. Its formation of heterodimers with c-Jun and binding to DNA. e) Scheme of synergistic VEGFR-2 and integrin signalling towards pERK1/2 can lead to enhanced ERK1/2 stimulation. For statistical evaluation, one way ANOVA with Tukey's multiple comparison post-test was performed; *P < 0.05; **P < 0.01; ***P < 0.001; ns = non-significant. (For interpretation of the references to colour in this figure legend, the reader is referred to the web version of this article.)
Fig. 8
Fig. 8
Murine fat pad model for vascularization showed better response for PEA than for PMA scaffolds; a) Fabrication of scaffolds: PEA and PMA was polymerized in 3D printed PVA templates to form scaffold with interconnected channels. b) Quantification of lectin fluorescence representing endothelial cells infiltrating PEA+FN+VEGFc and PMA+FN+VEGFc (**P < 0.01). c) Representative images of thin sections of explanted PEA and PMA scaffolds show endothelial cell specific lectin fluorescence staining of original fat pad tissue as well as new endothelial cells inside the pores; fluorescence inside the pores was used for quantification. Limits between scaffolds and fat pad tissue are shown by the yellow dashed line; pores within the scaffold are delimited by blue dashed lines. Fat pad tissue surrounds completely both PMA and PEA scaffods. d) Detailed image of newly formed tissue inside a pore of the PEA+FN+VEGF scaffold showing vascular network; lower magnification image on the right shows position of the pore in the scaffold and link to the original fat pad tissue through a channel. e) Lack of formation of tissue inside pores of the PMA+FN+VEGF scaffolds together with the corresponding bright field image that has allowed univocal identification of pores. The corresponding bright field image for PEA is include in Supplementary Fig S5e. Cytoskeleton is in red, nuclei in cyan, scale bars represent 100 μm. (For interpretation of the references to colour in this figure legend, the reader is referred to the web version of this article.)

Similar articles

Cited by

References

    1. Auger F.A., Gibot L., Lacroix D. The pivotal role of vascularization in tissue engineering. Annu. Rev. Biomed. Eng. 2013;15:177–200. - PubMed
    1. Kim J.J., Hou L.Q., Huang N.F. Vascularization of three-dimensional engineered tissues for regenerative medicine applications. Acta Biomater. 2016;41:17–26. - PMC - PubMed
    1. Carmeliet P., Jain R.K. Molecular mechanisms and clinical applications of angiogenesis. Nature. 2011;473:298–307. - PMC - PubMed
    1. Olsson A.K., Dimberg A., Kreuger J., Claesson-Welsh L. VEGF receptor signalling - in control of vascular function. Nat. Rev. Mol. Cell Biol. 2006;7:359–371. - PubMed
    1. Stratman A.N., Davis M.J., Davis G.E. VEGF and FGF prime vascular tube morphogenesis and sprouting directed by hematopoietic stem cell cytokines. Blood. 2011;117:3709–3719. - PMC - PubMed

Publication types

MeSH terms

Substances