. 2017 Mar 8;93(5):1213-1226.e5.
doi: 10.1016/j.neuron.2017.02.017.

Entorhinal-CA3 Dual-Input Control of Spike Timing in the Hippocampus by Theta-Gamma Coupling

Affiliations

Entorhinal-CA3 Dual-Input Control of Spike Timing in the Hippocampus by Theta-Gamma Coupling

Antonio Fernández-Ruiz et al. Neuron. .

Abstract

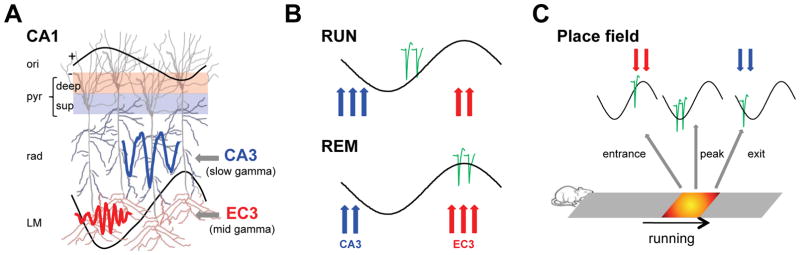
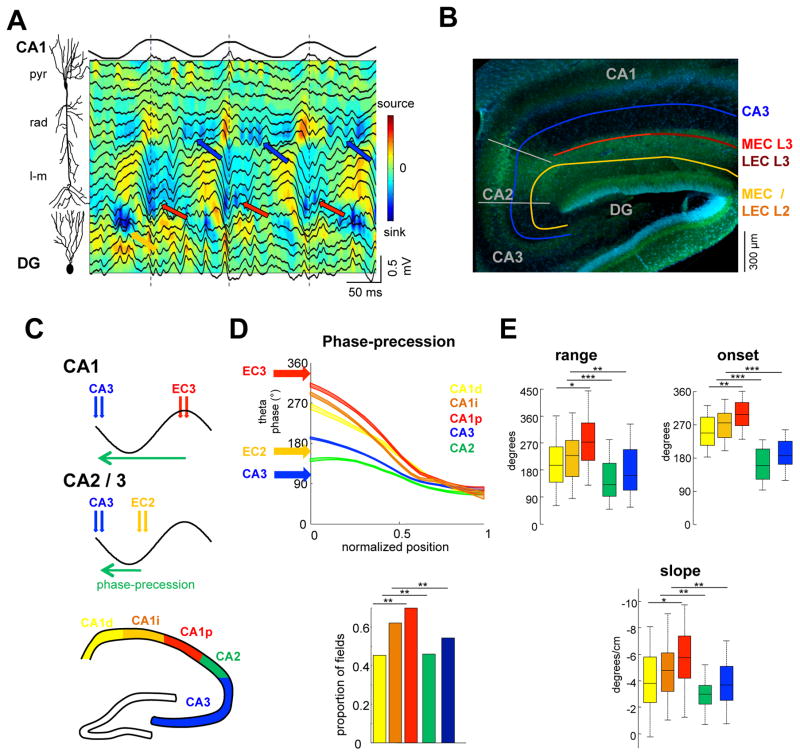
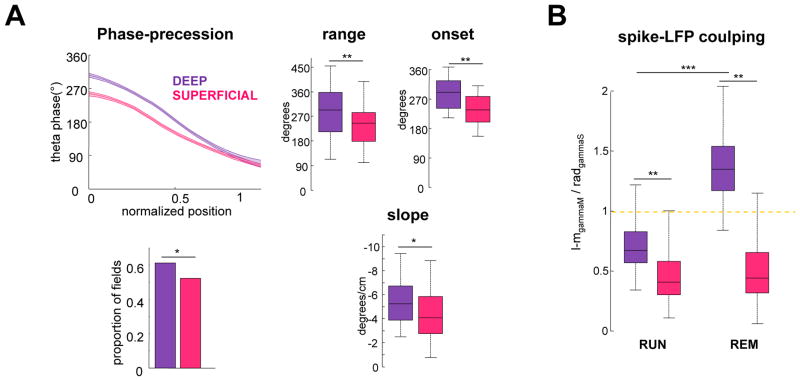
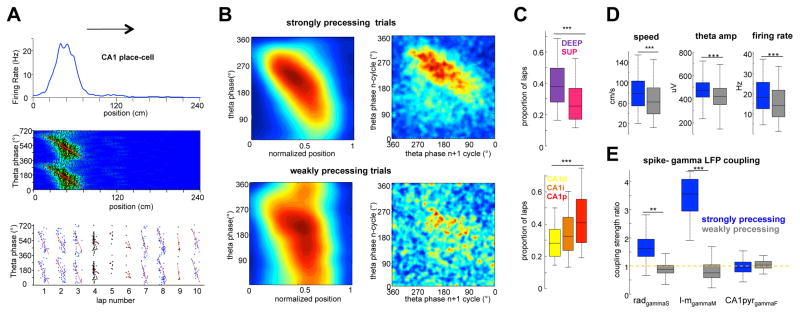
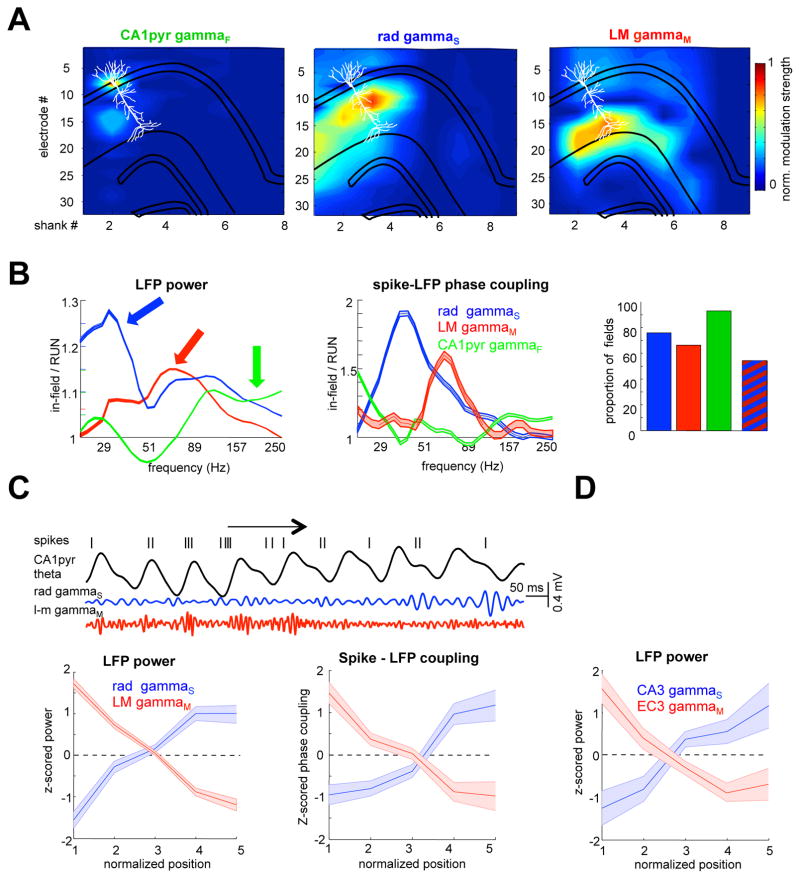
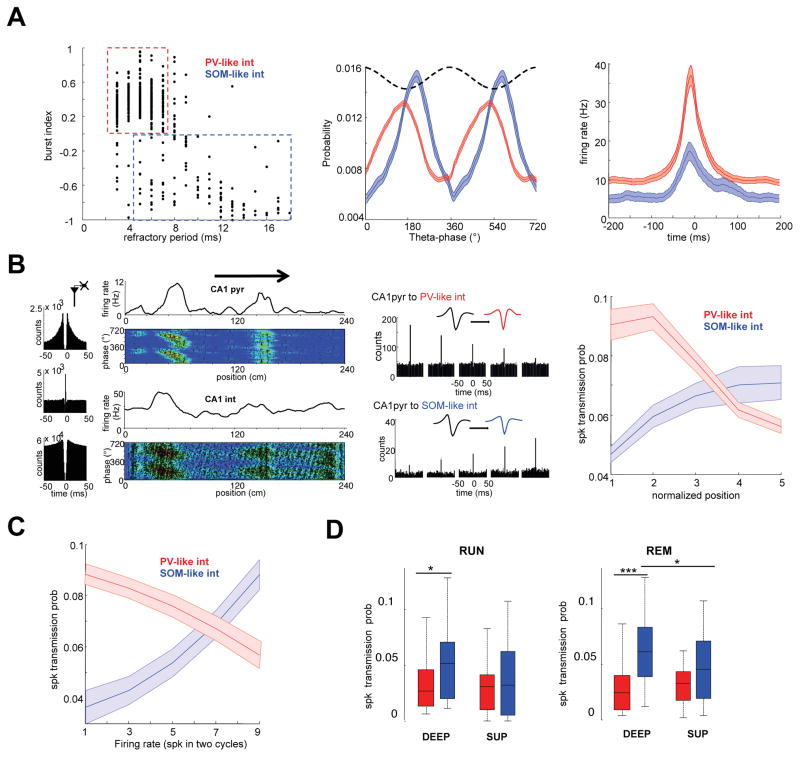
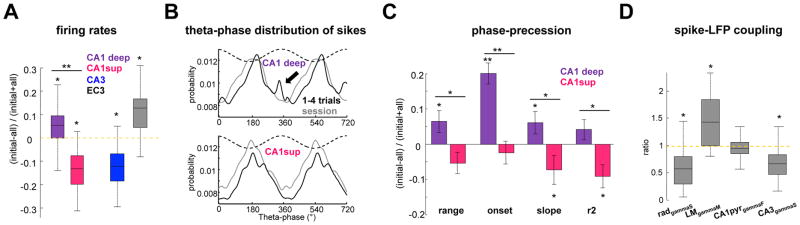
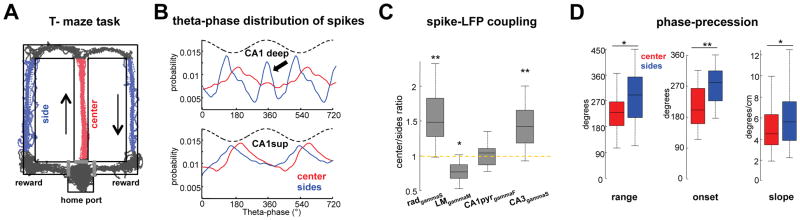
Theta-gamma phase coupling and spike timing within theta oscillations are prominent features of the hippocampus and are often related to navigation and memory. However, the mechanisms that give rise to these relationships are not well understood. Using high spatial resolution electrophysiology, we investigated the influence of CA3 and entorhinal inputs on the timing of CA1 neurons. The theta-phase preference and excitatory strength of the afferent CA3 and entorhinal inputs effectively timed the principal neuron activity, as well as regulated distinct CA1 interneuron populations in multiple tasks and behavioral states. Feedback potentiation of distal dendritic inhibition by CA1 place cells attenuated the excitatory entorhinal input at place field entry, coupled with feedback depression of proximal dendritic and perisomatic inhibition, allowing the CA3 input to gain control toward the exit. Thus, upstream inputs interact with local mechanisms to determine theta-phase timing of hippocampal neurons to support memory and spatial navigation.

Keywords: cross-frequency coupling; high-density recordings; inhibition; memory encoding; memory recall; oscillations; phase coupling; phase precession; place coding; temporal coding.


Figures

Figure 1
Figure 1. CA3 and entorhinal inputs control CA1 spiking
(A) Entorhinal layer 3 (EC3) gammaM input (60–100 Hz) modulates distal dendrites in str. LM at the positive peak of CA1 pyramidal layer theta (CA1pyr), followed by CA3 gammaS (30–60 Hz) input in str. radiatum (rad) on the descending theta phase (Schomburg et al., 2014). Deep sublayer CA1 pyramidal cells receive stronger EC3 input than superficial ones. (B) The relative strengths of phase-separated CA3 and EC3 are hypothesized to determine the theta phase of pyramidal cell spikes. During exploration (RUN), CA3 drive is stronger and EC3 is weaker relative to REM. As a result, the preferred phase of spikes moves towards the peak during REM. (C) At the entrance of the place field, place cells fire near the theta peak (EC3 excitation) and the spikes move to earlier phases as the rat transverses the place field due to increasing CA3 drive. Reference theta LFP for (B) and (C) correspond to the CA1 pyramidal layer.
Figure 2
Figure 2. Theta-gamma inputs to hippocampal subregions determines phase-precession magnitude
(A) Depth profile of theta-nested gamma oscillations. Red arrows indicate gammaM (60–110 Hz) oscillations in str. LM and local current sinks, coinciding with theta peaks (dashed lines). Blue arrows denote str. rad gammaS (30–60 Hz) oscillations and local sinks on the descending theta phase. Yellow arrow marks gamma oscillations in the str. moleculare of the dentate gyrus (DG) near theta through. (B) Schema of anatomical pathways. CA3 pyramidal cells send their main axons (blue) to the str. rad of CA3, CA2 and CA1. Medial EC3 (MEC3) and lateral EC3 (LEC3) axons target the proximal CA1 and distal segments, respectively. MEC2 and LEC2 (yellow) innervate CA3, CA2 and DG. (C) Dual-input model predicts that the range of phase-precession depends on the excitatory strength and magnitude of phase separation of theta inputs. (D) Theta phase-precession in different subregions. Mean and 95% confidence intervals are shown at 10% increments of distance from the beginning of the field. Arrows show the preferred theta phases of EC3, EC2 and CA3 driving populations. Only place fields with significant phase precession were considered for these analyses (histogram ;p < 0.05; circular-linear correlation). (E) Range of phase-position correlation, theta phase of spikes at the onset of the place field, , and slope respectively. See also Figure S1–4.
Figure 3
Figure 3. Phase-precession and spike-gamma coupling differs for deep and superficial CA1 subpopulations
(A) Plot illustrates mean theta phase and 95% confidence intervals along the place field for deep and superficial CA1 place cells. Deep CA1 cells have a wider phase range, fire closer to the theta peak at the place field onset. A larger proportion of deep layer cells have place fields significant phase-position correlation and steeper slope, compared to superficial neurons. (B) Ratio of spike-LFP phase modulation in LM gammaM and rad gammaS during RUN and REM was calculated for each cell and averaged for superficial (n = 221) and deep (n = 266) layer CA1 place cells. (*/**/*** p < 0.05/0.01/0.001; rank-sum test or one-way Kruskall-Wallis for intra CA1 comparisons). Note that gammaS spike modulation is stronger than gammaM for superficial cells during both RUN and REM but for deep neurons gammaM spike modulation becomes stronger during REM, suggesting an increased control of this subpopulation by EC3 input. See also Figure S2–4.
Figure 4
Figure 4. Place fields with and without phase-precession
(A) Firing rate plot (upper panel) and theta phase-position spike density map (middle) for an example place cell. Red line represents linear-circular regression. Bottom: Trials with strong (P < 0.05 and r2 > 0.1; blue dots) and weak (p > 0.05; black) spike phase-position correlation. (B) Left: Average normalized phase-position correlation density plots for all CA1 place cells (n = 487 cells, 6 rats) constructed separately for trials with strong and weak phase-position correlation. Right: Correlation of spike phase in n versus n + 1 theta waves. (C) Proportion of significantly phase-precessing trials for deep and superficial place cells (top), and for neurons in CA1 subregions (bottom). (D) Running speed, theta amplitude and in-field firing rate during strongly (blue) and weakly (grey) precessing trials. (E) Spike–LFP coupling of place cell spikes for strongly and weakly precessing trials (normalized to the entire session), shown separately for gamma sub-bands. (**/*** p < 0.01/0.001, rank-sum test or one-way Kruskall-Wallis for intra CA1 comparison). See also Figure S5.
Figure 5
Figure 5. Intra-place field dynamics of layer-specific gamma inputs
(A) Illustration of the procedure to identify gamma inputs to individual pyramidal cells. Different gamma components were isolated from the LFP by ICA and their specific activities were reconstructed for all 256-electrode sites (Methods). Spike-gamma phase modulation of each neuron was calculated by wavelet spectral decomposition and aligned with the neuron’s putative anatomical location. (B) Instantaneous gamma power (left) and spike-LFP gamma phase modulation strength (middle) for place cell spikes in an example session. Right, proportion of all place fields with significant (P < 0.01 Rayleigh test) spike-gamma oscillations phase-coupling. Striped bar, place fields with significant phase modulation by both gammaS and gammaM. Only place fields with significant phase-position correlation (n = 308; P < 0.05, circular-linear correlation) were included. (C) Example trial to illustrate gammaM and gammaS change across place field transversal. Spike sampled instantaneous power (bottom left) and spike-phase modulation strength (bottom right) for gammaS and gammaM in each of 5 bins of the place field. All place fields (n = 527) from all sessions (n = 16 from 6 rats) were normalized and their spikes pooled together. Only significantly phase precessing place trials were included in these analyses. Note increasing and decreasing spike-LFP modulation strength and power of gammaM and gammaS at the beginning and end of the place field, respectively. (D) CA1 place cell spike-sampled gamma power in EC3 (n = 4 rats) and CA3 pyramidal layer (n = 6 rats) in each of 5 bins of the place field. Shaded areas are mean ± SD. See also Figure S6 and S7.
Figure 6
Figure 6. Switching somato-dentric inhibition and gamma inputs
(A) CA1 putative interneurons were divided into PV-like and SOM-like subgroups, according to their proportion of burst spiking and refractory period (Royer et al., 2012: see Methods). Middle: Distribution of theta phase discharge probability for both groups. Right: Peri-ripple firing histogram for both groups. (B) Left panel: Autocorrelogram of pyramidal cell (top), PV-like interneuron (bottom) and their cross-correlogram (middle), indicating that they are monosynaptically connected. Second panel: spike versus theta phase plots of the neuron pair on the track. Note spike phase-precession of both neurons. Third panel: Example cross-correlograms for two representative pyramidal cell-interneuron pairs in the five bins of the place field. Right panel: Spike-transmission probability between CA1 place cells and the two classes of interneurons, shown in five bins of the place field (n = 256 place cell-PV-like pairs; n = 35 place cell-SOM-like pairs). Spike transmission probability between pyramidal cells and PV-like interneurons was high at the entrance of the field and decreased afterward. In contrast, the spike transmission between pyramidal cells and SOM-like interneurons gradually increased as the rat crossed the field. (C) Spike transmission probability as a function of pyramidal cell firing rate in 10 firing rate bins during RUN and REM epochs. Spike transmission probability between pyramidal cells and PV-like interneurons is high at low firing rates and rapidly decreases with rate increase of the driving pyramidal cell, whereas spike transmission to SOM-like interneurons increases with firing rate. Shaded areas mean ± SEM. (D) Spike-transmission probability during RUN and REM shown separately for CA1 deep layer pyramidal cell-interneuron and superficial layer pyramidal cell-interneuron pairs. See also Figure S8.
Figure 7
Figure 7. Entorhinal input drives CA1 deep layer neurons cells during early exploration of a familiar environment
(A) Firing rate and theta-phase firing probability distribution (B) changes from early (trials 1–4) to late (mean of entire session) trials. Arrow indicates bump in the firing probability at the theta peak for deep CA1 cells in early trials. (C) Differences in range, onset, slope and strength of phase-position correlation for deep and superficial CA1 place cells. (D) Changes in spike-LFP phase coupling from early to late trials. Spike-gamma phase coupling was quantified for each neuron as a mean vector length ratio of the first 4 trials and the whole session, and averaged across the population. (*/**/*** p < 0.05/0.01/0.001, Wilcoxon signed-rank test for within-group and rank-sum test for across-group comparisons).
Figure 8
Figure 8. Task-specific gamma inputs and phase-precession during memory guided navigation
(A) Delayed alternation task. Black lines, trajectory of the rat in a single session. Highlighted red and blue segments show sampled areas. (B) Theta phase distribution of deep and superficial CA1 pyramidal neurons in central and side arms. Note that many deep neurons fire at theta peak in the side arm (C) Central/side arms ratios for spike-gamma phase coupling. Place cell spikes are more strongly coupled to CA3 gammaS in the center (memory retrieval) arm while in the side arms they are preferentially entrained by EC3 gammaM. (D) Range, onset and slope of phase precession for place fields in the center and side arms. Note more limited phase-precession span and earlier theta-phase onset in the central arm, likely due to an increased CA3 input strength. (*/**/*** p < 0.05/0.01/0.001, Wilcoxon signed-rank for within-group and rank-sum test for across-group comparisons).

References

    1. Agarwal G, Stevenson IH, Berenyi A, Mizuseki K, Buzsaki G, Sommer FT. Spatially distributed local fields in the hippocampus encode rat position. Science. 2014;344:626–630. - PMC - PubMed
    1. Aghajan ZM, Acharya L, Moore JJ, Cushman JD, Vuong C, Mehta MR. Impaired spatial selectivity and intact phase precession in two-dimensional virtual reality. Nat Neurosci. 2015;18:121–128. - PubMed
    1. Ainge JA, van der Meer MA, Langston RF, Wood ER. Exploring the role of context-dependent hippocampal activity in spatial alternation behavior. Hippocampus. 2007;17:988–1002. - PubMed
    1. Amarasingham A, Harrison MT, Hatsopoulos NG, Geman S. Conditional modeling and the jitter method of spike resampling. J Neurophysiol. 2012;107:517–531. - PMC - PubMed
    1. Bartho P, Hirase H, Monconduit L, Zugaro M, Harris KD, Buzsaki G. Characterization of neocortical principal cells and interneurons by network interactions and extracellular features. J Neurophysiol. 2004;92:600–608. - PubMed