

Probabilistic forecasts of trachoma transmission at the district level: A statistical model comparison
- PMID: 28279456
- PMCID: PMC5340843
- DOI: 10.1016/j.epidem.2017.01.007
Probabilistic forecasts of trachoma transmission at the district level: A statistical model comparison
Abstract
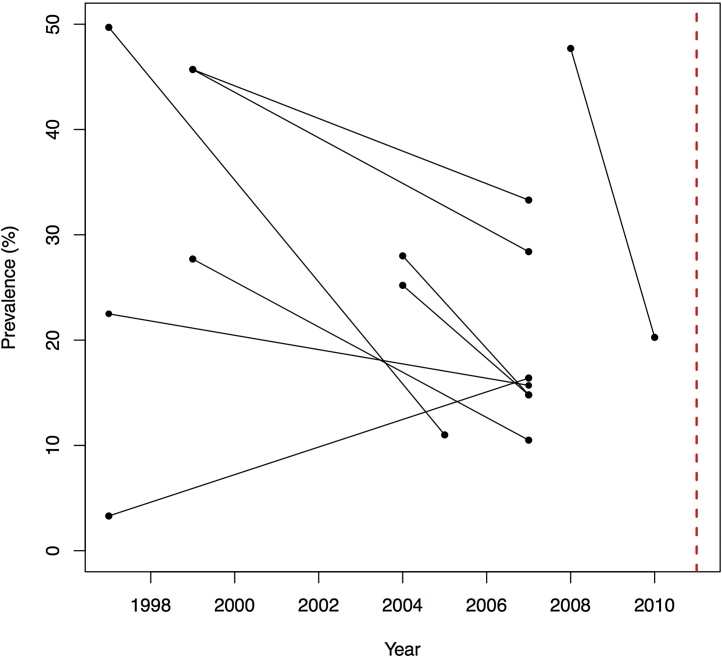
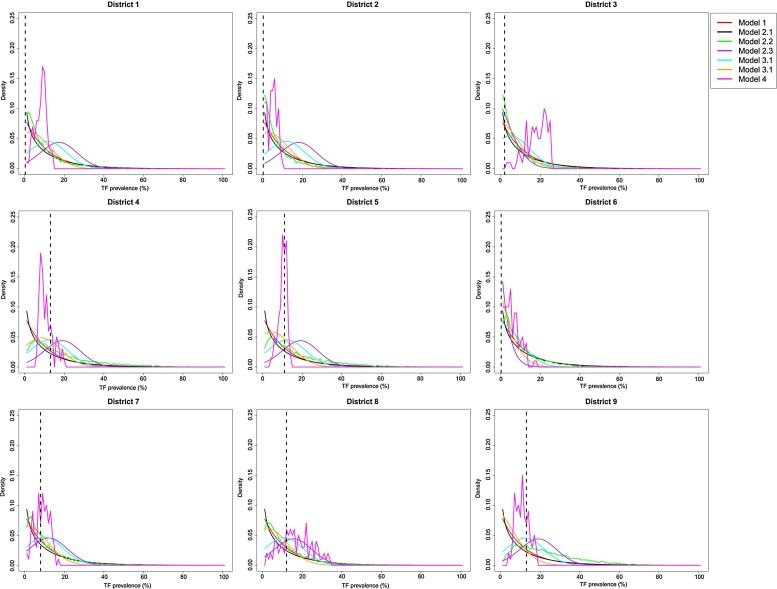
The World Health Organization and its partners are aiming to eliminate trachoma as a public health problem by 2020. In this study, we compare forecasts of TF prevalence in 2011 for 7 different statistical and mechanistic models across 9 de-identified trachoma endemic districts, representing 4 unique trachoma endemic countries. We forecast TF prevalence between 1-6 years ahead in time and compare the 7 different models to the observed 2011 data using a log-likelihood score. An SIS model, including a district-specific random effect for the district-specific transmission coefficient, had the highest log-likelihood score across all 9 districts and was therefore the best performing model. While overall the deterministic transmission model was the least well performing model, although it did comparably well to the other models for 8 of 9 districts. We perform a statistically rigorous comparison of the forecasting ability of a range of mathematical and statistical models across multiple endemic districts between 1 and 6 years ahead of the last collected TF prevalence data point in 2011, assessing results against surveillance data. This study is a step towards making statements about likelihood and time to elimination with regard to the WHO GET2020 goals.
Keywords: Elimination; Forecasting; Model comparison; Trachoma.
Copyright © 2017 The Authors. Published by Elsevier B.V. All rights reserved.
Figures
References
-
- Anon . World Health Organization; Geneva, Switzerland: 2012. Accelerating Work to Overcome the Global Impact of Neglected Tropical Diseases: a Roadmap for Implementation.
-
- Bates D., Maechler M., Bolker B., Walker B. Fitting linear mixed-effects models using lme4? J. Stat. Softw. 2015;67(1):1–48.
-
- Bröcker J., Smith L.A. Scoring probabilistic forecasts: the importance of being proper. Weather Forecasting. 2007;22(2):382–388.
-
- Carney M., Cunningham P. Evaluating density forecasting models. Tech. Rep. 2006
Publication types
MeSH terms
Grants and funding
LinkOut - more resources
Full Text Sources
Other Literature Sources
Molecular Biology Databases
Miscellaneous
