

Synchronism in mitochondrial ROS flashes, membrane depolarization and calcium sparks in human carcinoma cells
- PMID: 28279675
- PMCID: PMC5972832
- DOI: 10.1016/j.bbabio.2017.03.001
Synchronism in mitochondrial ROS flashes, membrane depolarization and calcium sparks in human carcinoma cells
Abstract
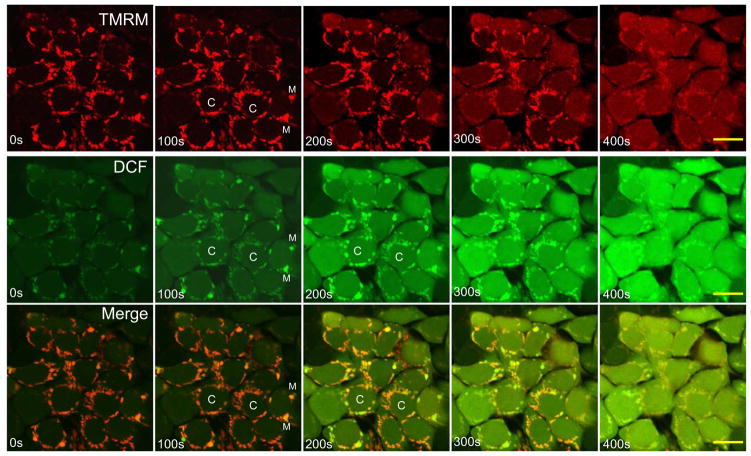
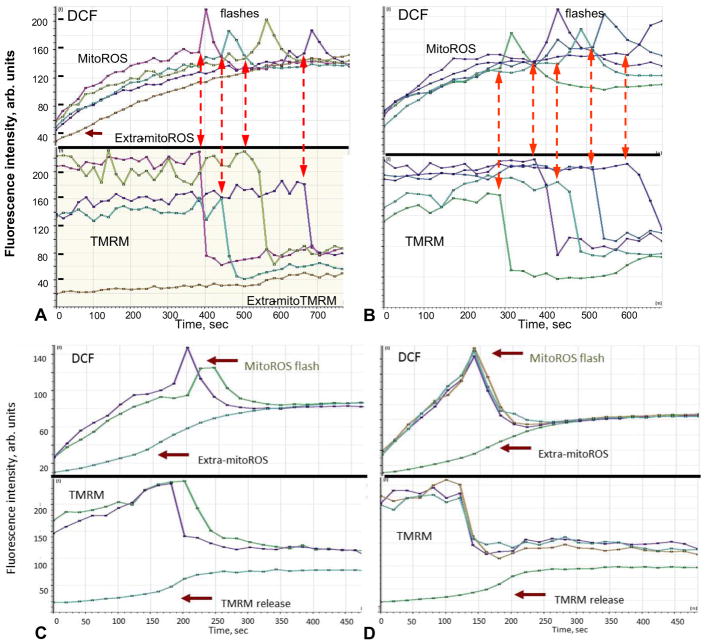
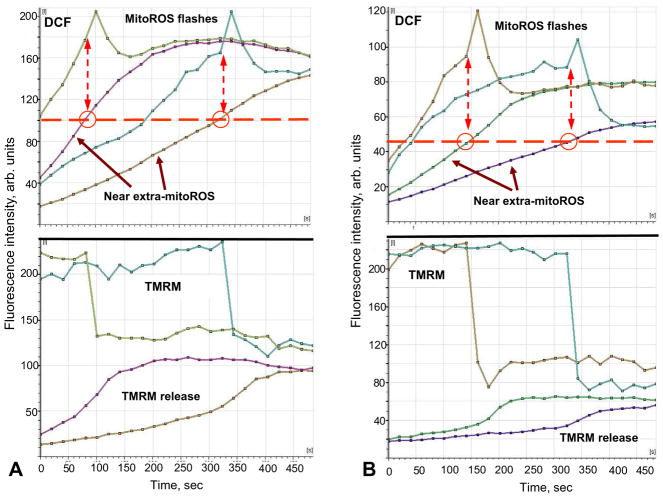
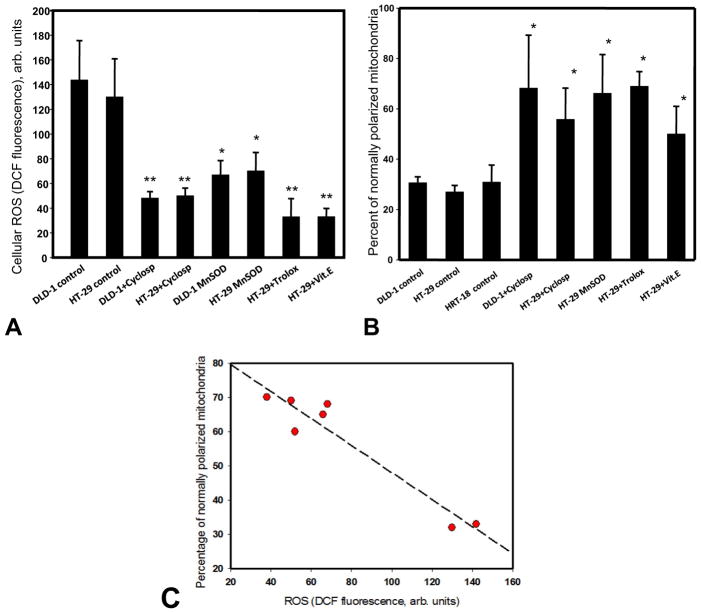
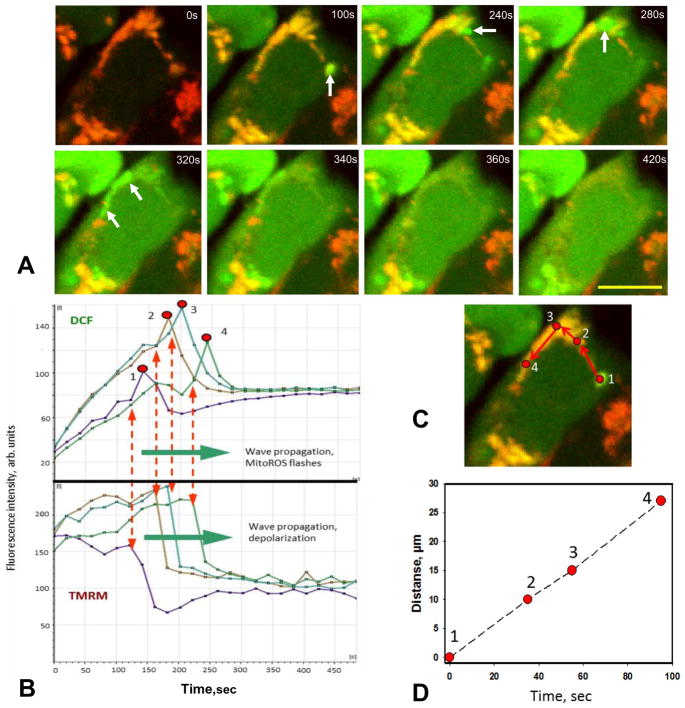
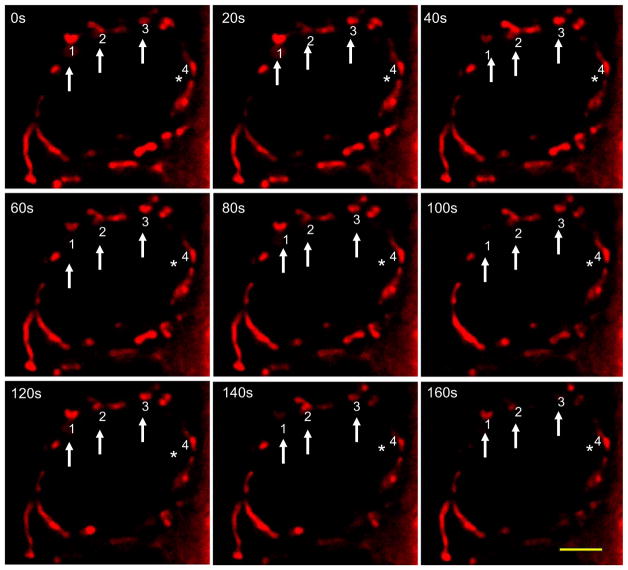
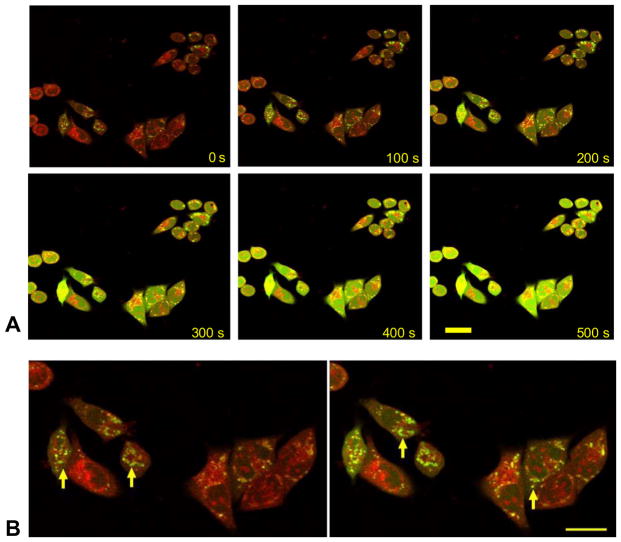
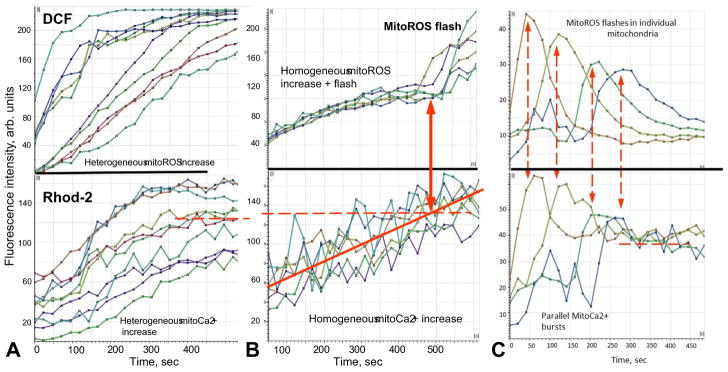
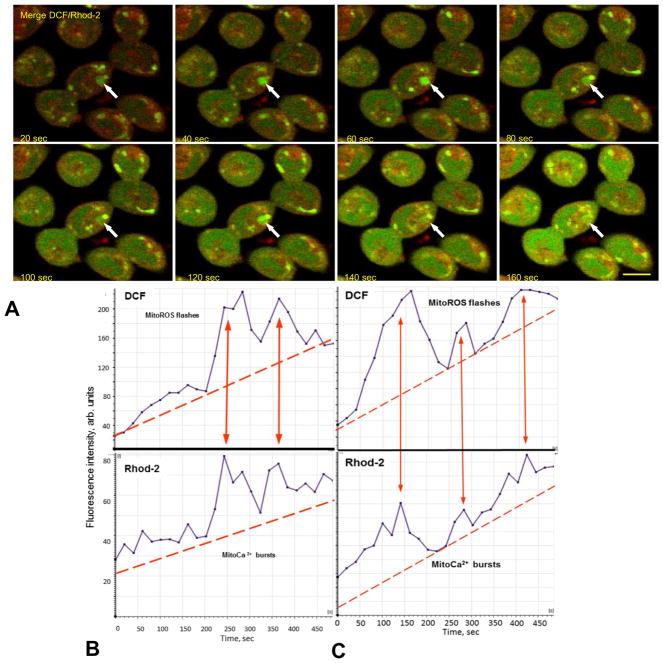
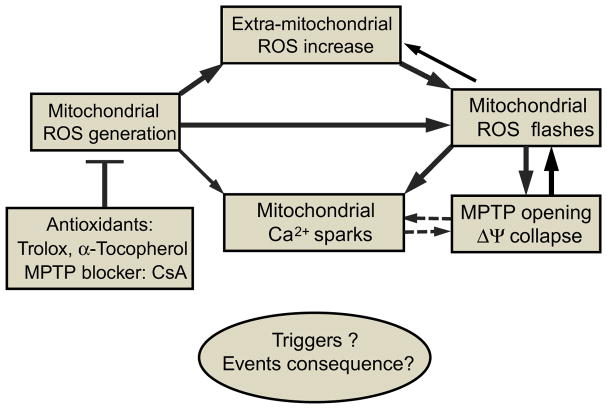
Mitochondria are major producers of reactive oxygen species (ROS) in many cells including cancer cells. However, complex interrelationships between mitochondrial ROS (mitoROS), mitochondrial membrane potential (ΔΨm) and Ca2+ are not completely understood. Using human carcinoma cells, we further highlight biphasic ROS dynamics: - gradual mitoROS increase followed by mitoROS flash. Also, we demonstrate heterogeneity in rates of mitoROS generation and flash initiation time. Comparing mitochondrial and near-extra-mitochondrial signals, we show that mechanisms of mitoROS flashes in single mitochondria, linked to mitochondrial permeability transition pore opening (ΔΨm collapse) and calcium sparks, may involve flash triggering by certain levels of external ROS released from the same mitochondria. In addition, mitochondria-mitochondria interactions can produce wave propagations of mitoROS flashes and ΔΨm collapses in cancer cells similar to phenomena of ROS-induced ROS release (RIRR). Our data suggest that in cancer cells RIRR, activation of mitoROS flashes and mitochondrial depolarization may involve participation of extramitochondrial-ROS produced either by individual mitochondria and/or by neighboring mitochondria. This could represent general mechanisms in ROS-ROS signaling with suggested role in both mitochondrial and cellular physiology and signaling.
Keywords: Ca(2+) sparks; Carcinoma cells; Membrane potential; Mitochondria; ROS flashes.
Copyright © 2017 Elsevier B.V. All rights reserved.
Conflict of interest statement
The authors declare no conflict of interest.
Figures
Similar articles
-
Synergistic triggering of superoxide flashes by mitochondrial Ca2+ uniport and basal reactive oxygen species elevation.J Biol Chem. 2013 Feb 15;288(7):4602-12. doi: 10.1074/jbc.M112.398297. Epub 2013 Jan 2. J Biol Chem. 2013. PMID: 23283965 Free PMC article.
-
Superoxide flashes: elemental events of mitochondrial ROS signaling in the heart.J Mol Cell Cardiol. 2012 May;52(5):940-8. doi: 10.1016/j.yjmcc.2012.02.007. Epub 2012 Mar 1. J Mol Cell Cardiol. 2012. PMID: 22405973 Review.
-
Mitochondrial permeability transition increases reactive oxygen species production and induces DNA fragmentation in human spermatozoa.Hum Reprod. 2015 Apr;30(4):767-76. doi: 10.1093/humrep/dev015. Epub 2015 Feb 5. Hum Reprod. 2015. PMID: 25662811
-
The effect of permeability transition pore opening on reactive oxygen species production in rat brain mitochondria.Ukr Biokhim Zh (1999). 2011 Nov-Dec;83(6):46-55. Ukr Biokhim Zh (1999). 2011. PMID: 22364018
-
Mitochondrial reactive oxygen species (ROS) and ROS-induced ROS release.Physiol Rev. 2014 Jul;94(3):909-50. doi: 10.1152/physrev.00026.2013. Physiol Rev. 2014. PMID: 24987008 Free PMC article. Review.
Cited by
-
Mitochondrial Metabolic Signatures in Hepatocellular Carcinoma.Cells. 2021 Jul 27;10(8):1901. doi: 10.3390/cells10081901. Cells. 2021. PMID: 34440674 Free PMC article. Review.
-
Bioelectricity in dental medicine: a narrative review.Biomed Eng Online. 2024 Jan 3;23(1):3. doi: 10.1186/s12938-023-01189-6. Biomed Eng Online. 2024. PMID: 38172866 Free PMC article. Review.
-
Functionality of Reactive Oxygen Species (ROS) in Plants: Toxicity and Control in Poaceae Crops Exposed to Abiotic Stress.Plants (Basel). 2024 Jul 26;13(15):2071. doi: 10.3390/plants13152071. Plants (Basel). 2024. PMID: 39124190 Free PMC article. Review.
-
ROS systems are a new integrated network for sensing homeostasis and alarming stresses in organelle metabolic processes.Redox Biol. 2020 Oct;37:101696. doi: 10.1016/j.redox.2020.101696. Epub 2020 Aug 27. Redox Biol. 2020. PMID: 32950427 Free PMC article. Review.
-
An amplification mechanism for weak ELF magnetic fields quantum-bio effects in cancer cells.Sci Rep. 2025 Jan 23;15(1):2964. doi: 10.1038/s41598-025-87235-w. Sci Rep. 2025. PMID: 39849096 Free PMC article.
References
-
- Andrienko T, Kuznetsov AV, Kaambre T, Usson Y, Orosco A, Appaix F, Tiivel T, Sikk P, Vendelin M, Margreiter R, Saks VA. Metabolic consequences of functional complexes of mitochondria, myofibrils and sarcoplasmic reticulum in muscle cells. J Exp Biol. 2003;206:2059–2072. - PubMed
-
- Aon MA, Cortassa S, Marban E, O’Rourke B. Synchronized whole cell oscillations in mitochondrial metabolism triggered by a local release of reactive oxygen species in cardiac myocytes. J Biol Chem. 2003;278:44735–44744. - PubMed
-
- Balaban RS, Nemoto S, Finkel T. Mitochondria, oxidants, and aging. Cell. 2005;120:483–495. - PubMed
-
- Batandier C, Leverve X, Fontaine E. Opening of the mitochondrial permeability transition pore induces reactive oxygen species production at the level of the respiratory chain complex I. J Biol Chem. 2004;279:17197–17204. - PubMed
Publication types
MeSH terms
Substances
Grants and funding
LinkOut - more resources
Full Text Sources
Other Literature Sources
Miscellaneous
