. 2017 May 1;77(9):2292-2305.
doi: 10.1158/0008-5472.CAN-16-2832. Epub 2017 Mar 9.

Local Activation of p53 in the Tumor Microenvironment Overcomes Immune Suppression and Enhances Antitumor Immunity

Affiliations

Local Activation of p53 in the Tumor Microenvironment Overcomes Immune Suppression and Enhances Antitumor Immunity

Gang Guo et al. Cancer Res. .

Abstract

Mutations in tumor suppressor p53 remain a vital mechanism of tumor escape from apoptosis and senescence. Emerging evidence suggests that p53 dysfunction also fuels inflammation and supports tumor immune evasion, thereby serving as an immunological driver of tumorigenesis. Therefore, targeting p53 in the tumor microenvironment (TME) also represents an immunologically desirable strategy for reversing immunosuppression and enhancing antitumor immunity. Using a pharmacological p53 activator nutlin-3a, we show that local p53 activation in TME comprising overt tumor-infiltrating leukocytes (TILeus) induces systemic antitumor immunity and tumor regression, but not in TME with scarce TILeus, such as B16 melanoma. Maneuvers that recruit leukocytes to TME, such as TLR3 ligand in B16 tumors, greatly enhanced nutlin-induced antitumor immunity and tumor control. Mechanistically, nutlin-3a-induced antitumor immunity was contingent on two nonredundant but immunologically synergistic p53-dependent processes: reversal of immunosuppression in the TME and induction of tumor immunogenic cell death, leading to activation and expansion of polyfunctional CD8 CTLs and tumor regression. Our study demonstrates that unlike conventional tumoricidal therapies, which rely on effective p53 targeting in each tumor cell and often associate with systemic toxicity, this immune-based strategy requires only limited local p53 activation to alter the immune landscape of TME and subsequently amplify immune response to systemic antitumor immunity. Hence, targeting the p53 pathway in TME can be exploited to reverse immunosuppression and augment therapeutic benefits beyond tumoricidal effects to harness tumor-specific, durable, and systemic antitumor immunity with minimal toxicity. Cancer Res; 77(9); 2292-305. ©2017 AACR.


Figures

Fig. 1
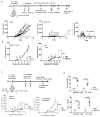
Fig. 1. Local p53 activation in the EL4 TME promotes systemic antitumor immunity and tumor regression
A. 1 X 10⁶ EL4 tumor cells were injected s.c. in the right flank of WT mice. When tumors reached 100 – 300 mm3, they were treated i.t. with 100 μl of 20 μM nutlin-3a or PBS twice, usually on day 6 and day 8. Tumor size was measured every day. When tumor diameters exceeded 15 mm, tumor bearing mice were euthanized. Nutlin-3a treated mice that experienced complete tumor elimination were re-challenged with1 X 106 EL4 cells on day 20. Tumor growth was assessed every other day till day 40. Individual EL4 tumor growth in WT mice treated with either PBS (left) or nutlin-3a (center and right) was plotted (n = 17–20). B. EL4 tumor growth in Rag1null and WT mice that were established s.c. and treated i.t. with 100 μl of 20 μM nutlin-3a or PBS (n = 5). C & D. 2 X 10⁵ EL4 tumor cells were injected s.c. in both the right and left flanks of WT mice. When tumors reached 100 – 300 mm3, usually in 10 days, tumors only in the right flank received i.t. treatment of 100 μl of 20 μM nutlin-3a or PBS twice, one day apart. C. Tumors in both flanks were measured every day. The size of tumor at the side of treatment (top panel) and side contralateral to the treatment (right panel) was plotted. (n = 5). D. The percentages of tumor infiltrating (TILeus) CD8 T cells (left panel) and IFN-γ producing CD8 cells (right panel) were determined via flow cytometry. (n =5). The experiments were repeated at least 2–3 times with similar results. Data are presented as mean ± SEM of 5 – 20 mice. B and C. *** p < 0.001, two-way ANOVA; D. ** p < 0.01, *** p < 0.001, two-sided Student’s t-test.
Fig. 2
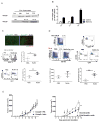
Fig. 2. Nutlin-3a-induced p53-dependent EL4 death is required for activation of antitumor immunity
A and B. EL4 cells were cultured in the presence of varying concentration of nutlin-3a and supernatant was harvested at 20, 24, and 30 hours post-treatment. A. Western blotting examination of HMGB1 release following 10 μM nutlin-3a treatment at various times (top) and various concentration of nutlin-3a at 30 hours post-treatment. B. Extracellular release of ATP following 10 μM of nutlin-3a treatment at various times was determined via ATPLite assay. C. and D. GFP expressing EL4 tumors (EL4-GFP) were established s.c. in WT mice and treated with PBS or 20 μM of nutlin-3a. C. Two days post-treatment, tumors were harvested and processed for immunofluorescence staining of CD11c (top panel) and flow cytometry analyses of MHC II expression (middle panel) and the percentage of GFP+ cells among CD11c+CD103+ dendritic cells (bottom panel). D. TDLNs from treated EL4-GFP tumors were analyzed for CD11c+CD103+ dendritic cells and GFP expression among them, using LNs from the contralateral side as non-TDLN control. The total number of TDLN-CD11c+CD103+ cells and the percentage of GFP+ cells were summarized. E. EL4 derivatives, EL4sip53, transduced with a lentiviral vector carrying p53shRNA, or EL4-si-Scramble, with a lentiviral vector carrying Scramble shRNA, were established s.c. in WT mice and treated with nutlin or PBS as described previously. Tumor size was measured every other day. (n = 5). The experiments were repeated at least 2–3 times with similar results. Data are presented as mean ± SEM. n = 3–6. The p value from statistical analysis is presented above each graph. C. and D. * p < 0.05, ** p < 0.01, Student’s t-test. E. ** p < 0.01, two-way ANOVA.
Fig. 3
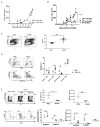
Fig. 3. Nutlin-induced activation of antitumor immunity also relies on an intact p53 pathway in the leukocytes of the TME
A. EL4 tumors were established s.c. in p53null mice and treated with nutlin-3a or PBS twice, one day apart. Tumor size was measured every day. (n = 5) B. EL4 tumors established s.c. in WT, p53null, and p53Fl-Vav mice were treated with nutlin-3a or PBS twice. Tumor size was measured every other day. (n = 5). C to E. EL4 tumors established s.c. in WT mice were treated with nutlin-3a or PBS twice. Six days after the last treatment, tumors and TDLNs were harvested for FACS analysis of total TILeus (C) and the composition of immune cell subsets in the PBS- and nutlin-treated tumors (D). E. The percentages of CD11b+Gr-1+ MDSCs and Ly6Chi M-MDSCs vs. Ly6Ghi G-MDSCs and their absolute numbers in the TDLNs were analyzed and compared to those from non-TDLNs of the same animal. Representative FACS plots (left panel) and summary of TDLN-MDSC subsets in the PBS and nutlin-treated mice. B. *** p < 0.001, two-way ANOVA; C to E. * p < 0.05, ** p < 0.01, *** p < 0.001, two-sided Student’s t-test.
Fig. 4
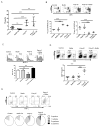
Fig. 4. Nutlin-3a reveres immune suppression by alleviating the immunosuppressive function of MDSCs
BM-MDSCs were cultured in the presence of various doses of nutlin-3a for 24 hours. Ly6Ghi G-MDSC and Ly6Chi M-MDSC composition (A) and the percentage of CD11c+ and CD80+ populations among the remaining cells (B) was determined via flow cytometry. n = 3. C. The immunosuppressive ability of nutlin-treated MDSCs was evaluated via T cell proliferation assay. Representative FACS plots of CFSE labeled naïve CD4 T cells and T cells activated by anti-CD3/CD28 beads. The difference in CFSE levels between naïve and activated T cells were set as relative proliferation of 100%. D. Summary of dose-dependent effects of nutlin-mediated alleviation of MDSC suppression on CD4 and CD8 T cell proliferation were shown. E. Tumor infiltrating G-MDSCs and M-MDSCs in PBS or nutlin-3a-treated WT mice were purified via FACSorting. The effects of these purified MDSCs on T proliferation of activation CD4 T cells were examined and summarized. Representative results of at least three independent experiments. Data are presented as mean ± SEM. n = 3–6. Experiments were repeated at least 3 times with similar results.
Fig. 5
Fig. 5. Nutlin-3a induces immunogenic cell death of B16 melanomas but is unable to control B16 progression in WT mice
A and B. B16 melanoma cells were treated with various concentrations of nutlin-3a and supernatant was harvested at 20, 24, and 30 hours post-treatment for Western blotting examination of HMGB1 (A) and ATP release via ATPLite assay (B) following 10 μM of nutlin-3a treatment. C. 1 X 10⁶ of B16 tumor cells were established s.c. in WT mice. When tumors reached 100 – 300 mm3, they were treated i.t. with 100 μl of 20 μM nutlin-3a or PBS twice, one day apart. Tumor size was measured every day. (n = 10). D to F. EL4 and B16 were established s.c. in WT mice. When both EL4 and B16 tumors reach ~ 4000 mm3, they were harvested. D. The total percentage of TILeus was examined via FACS. E. The abundance and distribution of TILeu-CD3+ T cells and CD11b+ myeloid cells was examined via IHC. F. The immune cell subset composition and relative percentage was analyzed via FACS. (n=5). Data are presented as mean ± SEM. Experiments were repeated at least 3 times with similar results. D and F. * p < 0.05, ** p < 0.01, *** p < 0.001, Student’s t-test.
Fig. 6
Fig. 6. Poly-IC enhances leukocyte recruitment to the B16 TME and amplifies the nutlin-3a-induced tumor cell death leading to significant tumor regression
A. B16 tumors established s.c. in WT mice were treated i.t. with 50 μg of poly-ICLC in 50 μl PBS or PBS alone as a control. Two days post-treatment, TILeus were examined via FACS. B to D. B16 tumors established s.c. in WT mice were treated i.t. with 50 μg of poly-ICLC in 50 μl PBS or PBS when tumors reached 100 – 300 mm3. Two days later, nutlin-3a or PBS was injected i.t. twice, one day apart. B. The size of B16 tumors in various treatment groups were measured every day. (n = 10 – 20). Representative images of tumor size comparison at the end of the experiment (top, C = control, N = nutlin-3a, P = Poly-IC, P+N = poly-IC + nutlin-3a). C. Representative B16 histology analysis (H&E, top) and TUNEL staining of dying cells (bottom) in different treatment groups. Scale bars = 50 μm. D. Representative images of immunofluorescence staining of TILeu-CD11b+ myeloid cells, CD3+ and CD8+ T cells. Scale bars = 50 μm. B. ** p < 0.01, two-way ANOVA.
Fig. 7
Fig. 7. Synergistic effects of poly-IC and nutlin-3a in B16 treatment are mediated through reversing immunosuppression and augmenting polyfunctional CTLs in the TME
B16 tumors established s.c. in WT mice were first treated i.t. with poly-IC or PBS, followed with nutlin-3a or PBS. At 16 days post-tumor inoculation, mice were euthanized and immune cell composition, activation status, and effector function among all treatment groups of the B16 TME were analyzed. A. TILeus were examined via FACS. B. MDSC subset composition of M-MDSCs and G-MDSCs in different treatment groups was examined via FACS. C. MHC II+ cell percentage and relative MHC II expression among CD11b+ myeloid cells in different treatment groups were determined via FACS. D. TILeus-CD8 and CD4 T cell composition in different treatment group of the B16 TME was determined via FACS. E. Effector cytokine producing TILeu-CD8+ T cells were determined via FACS following intracellular staining and presented in pie chart showing the composition of cytokine producing cells among total TILeu-CD8 cells. Data are presented as mean ± SEM. n = 3–6. Experiments were repeated 2–3 times with similar results. ** p < 0.01, *** p < 0.001, Student’s t-test.

Similar articles

Cited by

References

    1. Levine AJ. p53, the cellular gatekeeper for growth and division. Cell. 1997;88(3):323–31. - PubMed
    1. Olivier M, Hollstein M, Hainaut P. TP53 mutations in human cancers: origins, consequences, and clinical use. Cold Spring Harbor perspectives in biology. 2010;2(1):a001008. - PMC - PubMed
    1. Vazquez A, Bond EE, Levine AJ, Bond GL. The genetics of the p53 pathway, apoptosis and cancer therapy. Nature reviews Drug discovery. 2008;7(12):979–87. - PubMed
    1. Guo G, Marrero L, Rodriguez P, Del Valle L, Ochoa A, Cui Y. Trp53 inactivation in the tumor microenvironment promotes tumor progression by expanding the immunosuppressive lymphoid-like stromal network. Cancer Res. 2013;73(6):1668–75. - PMC - PubMed
    1. Zhang S, Zheng M, Kibe R, Huang Y, Marrero L, Warren S, et al. Trp53 negatively regulates autoimmunity via the STAT3-Th17 axis. Faseb J. 2011;25(7):2387–98. - PMC - PubMed

MeSH terms