

Ventilation heterogeneity measured by multiple breath inert gas testing is not affected by inspired oxygen concentration in healthy humans
- PMID: 28280107
- PMCID: PMC5494431
- DOI: 10.1152/japplphysiol.01013.2016
Ventilation heterogeneity measured by multiple breath inert gas testing is not affected by inspired oxygen concentration in healthy humans
Abstract
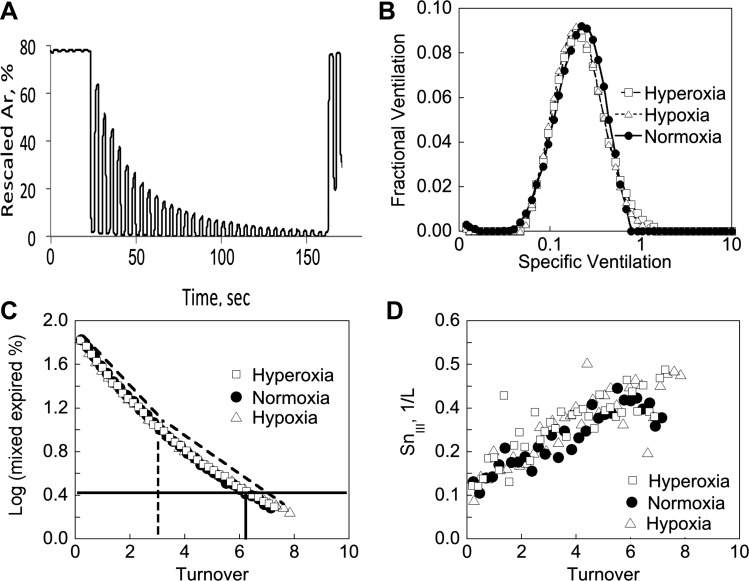
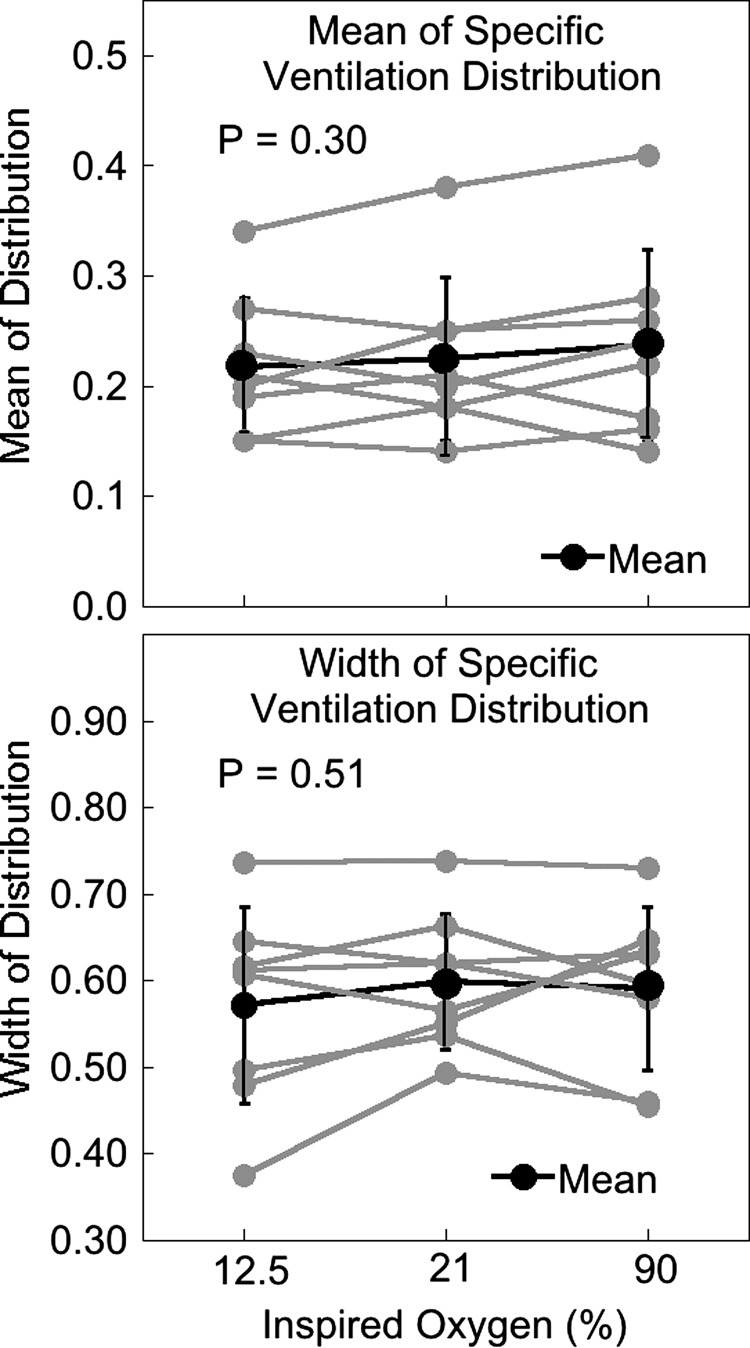
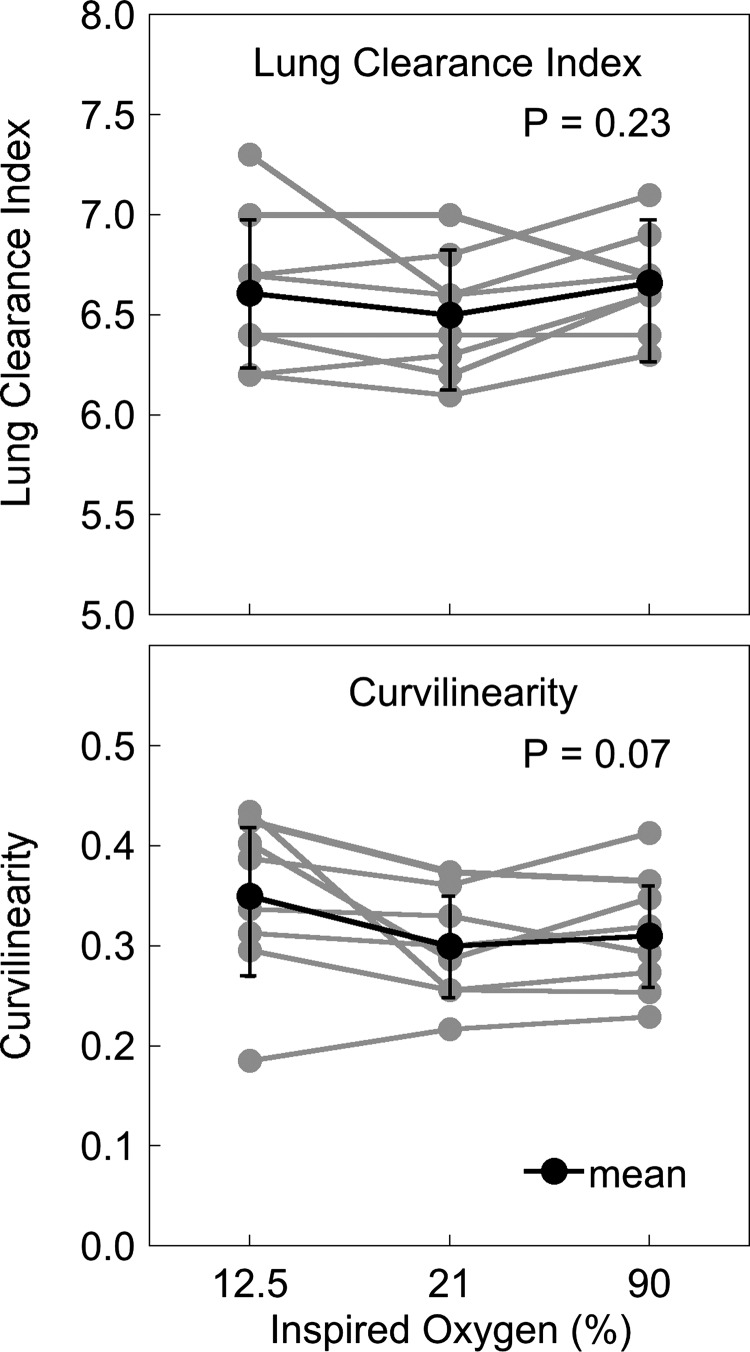
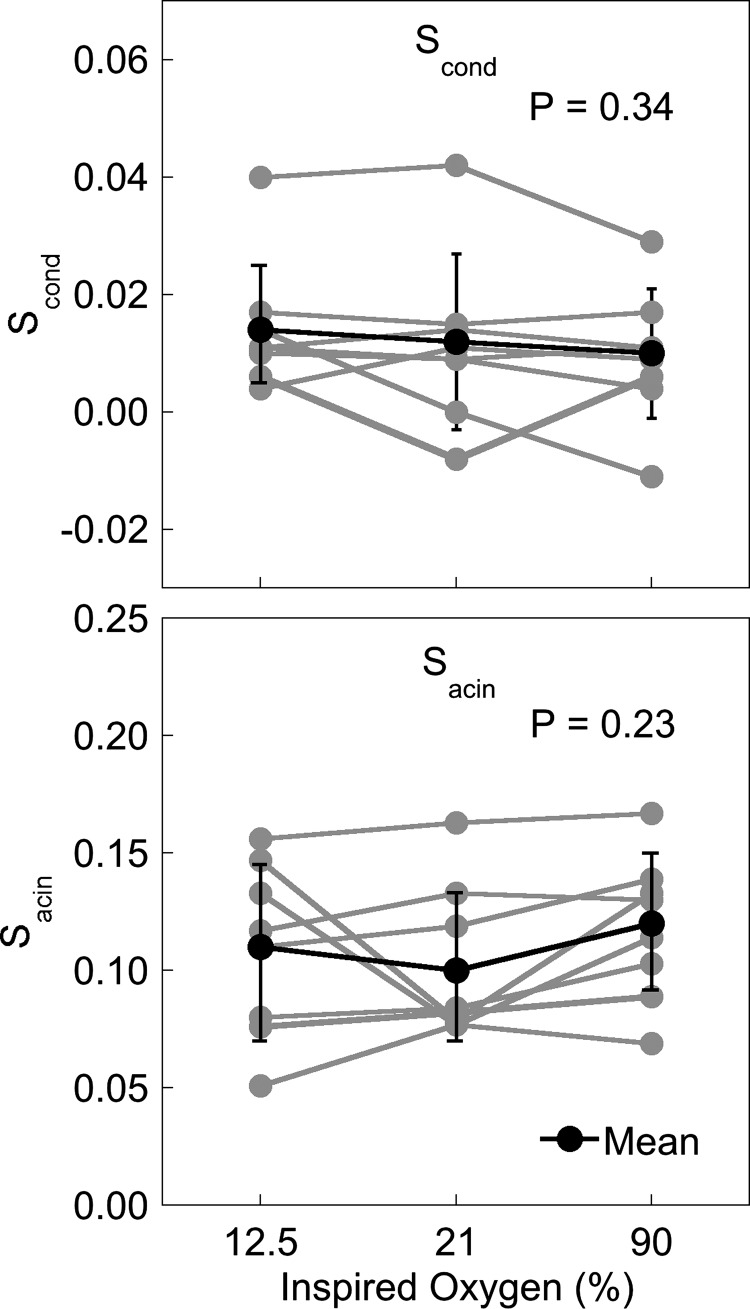
Multiple breath washout (MBW) and oxygen-enhanced MRI techniques use acute exposure to 100% oxygen to measure ventilation heterogeneity. Implicit is the assumption that breathing 100% oxygen does not induce changes in ventilation heterogeneity; however, this is untested. We hypothesized that ventilation heterogeneity decreases with increasing inspired oxygen concentration in healthy subjects. We performed MBW in 8 healthy subjects (4 women, 4 men; age = 43 ± 15 yr) with normal pulmonary function (FEV1 = 98 ± 6% predicted) using 10% argon as a tracer gas and oxygen concentrations of 12.5%, 21%, or 90%. MBW was performed in accordance with ERS-ATS guidelines. Subjects initially inspired air followed by a wash-in of test gas. Tests were performed in balanced order in triplicate. Gas concentrations were measured at the mouth, and argon signals rescaled to mimic a N2 washout, and analyzed to determine the distribution of specific ventilation (SV). Heterogeneity was characterized by the width of a log-Gaussian fit of the SV distribution and from Sacin and Scond indexes derived from the phase III slope. There were no significant differences in the ventilation heterogeneity due to altered inspired oxygen: histogram width (hypoxia 0.57 ± 0.11, normoxia 0.60 ± 0.08, hyperoxia 0.59 ± 0.09, P = 0.51), Scond (hypoxia 0.014 ± 0.011, normoxia 0.012 ± 0.015, hyperoxia 0.010 ± 0.011, P = 0.34), or Sacin (hypoxia 0.11 ± 0.04, normoxia 0.10 ± 0.03, hyperoxia 0.12 ± 0.03, P = 0.23). Functional residual capacity was increased in hypoxia (P = 0.04) and dead space increased in hyperoxia (P = 0.0001) compared with the other conditions. The acute use of 100% oxygen in MBW or MRI is unlikely to affect ventilation heterogeneity.NEW & NOTEWORTHY Hyperoxia is used to measure the distribution of ventilation in imaging and MBW but may alter the underlying ventilation distribution. We used MBW to evaluate the effect of inspired oxygen concentration on the ventilation distribution using 10% argon as a tracer. Short-duration exposure to hypoxia (12.5% oxygen) and hyperoxia (90% oxygen) during MBW had no significant effect on ventilation heterogeneity, suggesting that hyperoxia can be used to assess the ventilation distribution.
Keywords: hyperoxia; multiple breath washout; oxygen enhanced imaging; ventilation heterogeneity.
Copyright © 2017 the American Physiological Society.
Figures
References
-
- Arai TJ, Henderson AC, Dubowitz DJ, Levin DL, Friedman PJ, Buxton RB, Prisk GK, Hopkins SR. Hypoxic pulmonary vasoconstriction does not contribute to pulmonary blood flow heterogeneity in normoxia in normal supine humans. J Appl Physiol (1985) 106: 1057–1064, 2009. doi: 10.1152/japplphysiol.90759.2008. - DOI - PMC - PubMed
-
- Astin TW, Penman RW. Airway obstruction due to hypoxemia in patients with chronic lung disease. Am Rev Respir Dis 95: 567–575, 1967. - PubMed
MeSH terms
Substances
Grants and funding
LinkOut - more resources
Full Text Sources
Other Literature Sources