. 2017 Mar 10;355(6329):eaaf4597.
doi: 10.1126/science.aaf4597.

3D organization of synthetic and scrambled chromosomes

Affiliations

3D organization of synthetic and scrambled chromosomes

Guillaume Mercy et al. Science. .

Abstract

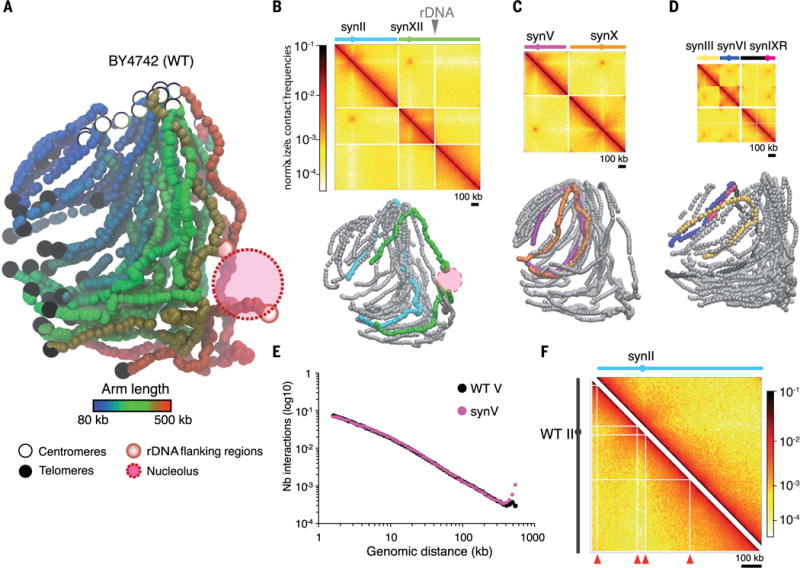
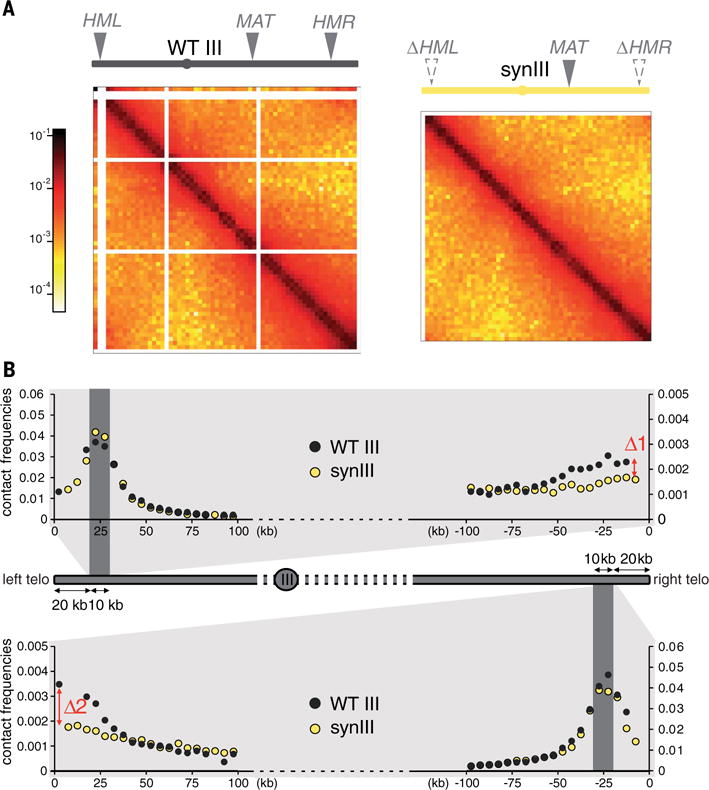
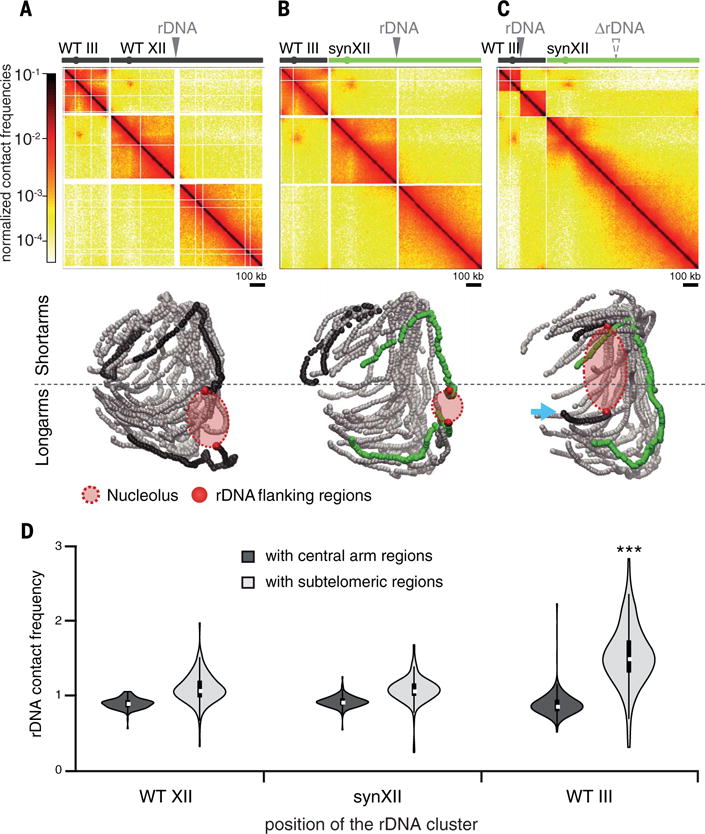
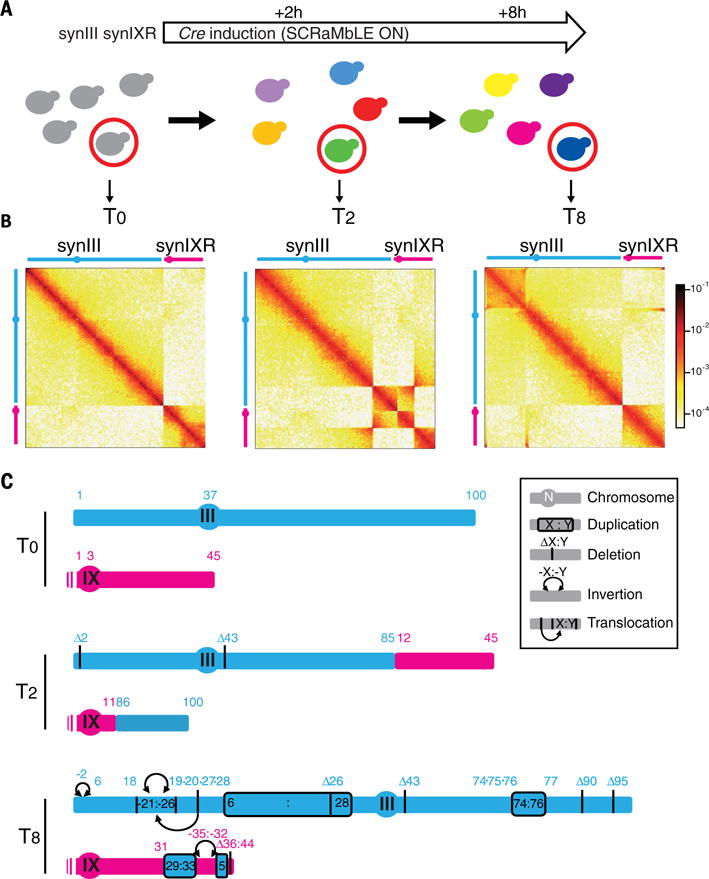
Although the design of the synthetic yeast genome Sc2.0 is highly conservative with respect to gene content, the deletion of several classes of repeated sequences and the introduction of thousands of designer changes may affect genome organization and potentially alter cellular functions. We report here the Hi-C-determined three-dimensional (3D) conformations of Sc2.0 chromosomes. The absence of repeats leads to a smoother contact pattern and more precisely tractable chromosome conformations, and the large-scale genomic organization is globally unaffected by the presence of synthetic chromosome(s). Two exceptions are synIII, which lacks the silent mating-type cassettes, and synXII, specifically when the ribosomal DNA is moved to another chromosome. We also exploit the contact maps to detect rearrangements induced in SCRaMbLE (synthetic chromosome rearrangement and modification by loxP-mediated evolution) strains.


Conflict of interest statement

These arrangements are reviewed and managed by the committees on conflict of interest at the New York University Langone Medical Center (J.D.B.) and Johns Hopkins University (J.S.B.).

Figures

Fig. 1
Fig. 1. 3D genome organization of native and synthetic chromosomes
(A) 3D representation of the native (wild-type, WT) yeast chromosomes, inferred from the Hi-C contact map displayed in fig. S1 (27). Each bead represents a 5-kb chromosome segment. Centromeres, telomeres, and rDNA-flanking regions are indicated with white, black, and red beads, respectively. Each chromosomal arm has been colored according to its length. (B to D) Contact maps and corresponding 3D representations of synthetic chromosomes in three different strains: JDY512 (synII and synXII) (B), yXZX573 (synV and synX) (C), and yLM896 (synIII, synVI, and synIXR) (D). The top panels are normalized contact maps of the seven synthetic chromosomes (bin size, 5 kb). Normalized contact frequencies (27) are indicated in a log10 scale ranging from white (few contacts) to dark red (many contacts). Filtered bins are set to zero (white vectors). The solid gray triangle points to the position of the rDNA cluster. The bottom panels show whole-genome 3D representations of the contact maps displayed above, with synthetic and native chromosomes represented with colored and gray beads, respectively. (E) Distribution of the number of contacts as a function of the genomic distance for synV (pink) and native chromosome V (black). (F) Side-by-side comparison of synII (strain YS031) and native chromosome II (strain BY4742) normalized contact maps. Nonmappable, repeated regions are highlighted with red arrowheads on the native map.
Fig. 2
Fig. 2. Loss of subtelomeric contacts in synIII
(A) Normalized contact maps (bin size, 5 kb) of native (WT) chromosome III (left; strain BY4742) and synIII (right; strain yLM896). The color scale is as in Fig. 1. Mating-type sequences are indicated along the top x axis with solid gray triangles (MAT, mating-type locus; HML and HMR, left and right silent mating cassettes). The positions of deleted loci are indicated with gray dashed triangles. (B) Quantitative analysis of subtelomeric contacts in native chromosome III (black dots) and synIII (yellow dots) by means of a bait chromosome capture approach. Contacts of 10-kb subtelomeric regions positioned at 20 kb from the left (top) or right (bottom) telomeres (dark gray areas) are shown. The y axis shows normalized contact frequencies; the x axis shows the distance (in kilobases) from the left and right telomeres. Each point represents the mean contact frequency for the bait region, computed for each chromosome from three independent experiments (on strains BY4742, YS031, and JDY512 for native chromosome III and yLM896, yLM539, and JDY452 for synIII). Δ1 and Δ2 mark the normalized contacts discrepancies between both ends of synIII relative to native chromosome III.
Fig. 3
Fig. 3. Repositioning of rDNA affects the overall genomic organization
(A to C) The top panels are normalized contact maps of strains BY4742 (A), JDY465 (B), and JDY449 (C) carrying the rDNA cluster at different positions. Solid gray triangles point to the position of the rDNA cluster in each strain. The position of the deleted rDNA cluster is indicated with a gray dashed triangle. The bottom panels show the 3D representations of the corresponding contact maps. The nucleolus and the rDNA cluster–flanking regions are represented on each structure. Chromosome coloring is the same as in Fig. 1. The blue arrow points to the chromosome III right arm that is displaced after rDNA insertion. (D) Violin plot of the contact frequencies between the rDNA cluster and either subtelomeric (light gray) or intra-arm (dark gray) chromosomal regions. ***P < 0.001.
Fig. 4
Fig. 4. SCRaMbLE induction of synthetic chromosomes results in multiple types of genome rearrangements
(A) Illustration of the time course induction of the SCRaMbLE system in strain yLM539 carrying two synthetic chromosomes, synIII and synIXR. (B) Normalized contact maps (bin size, 2 kb) of the parental strain yLM539 (at T0; carrying synIII and synIXR) and two SCRaMbLE clones isolated after 2 hours (T2; HMSY029) and 8 hours (T8; HMSY030) of Cre induction. All Hi-C reads are mapped against the reference genome of the parental strain yLM539. (C) Schematic representations of the duplications, deletions, inversions, and translocations identified from these maps and the coverage analysis. DNA segments between two loxPsym sites are numbered from left to right (in blue for synIII and pink for synIX). The schematic representation shows the rearranged synIII and synIX by using numbering of the segments from the parental strain. Details are shown in fig. S18.

Comment in

References

    1. Sharp PM, Lloyd AT. Regional base composition variation along yeast chromosome III: Evolution of chromosome primary structure. Nucleic Acids Res. 1993;21:179–183. doi: 10.1093/nar/21.2.179. - DOI - PMC - PubMed
    1. Bradnam KR, Seoighe C, Sharp PM, Wolfe KH. G+C content variation along and among Saccharomyces cerevisiae chromosomes. Mol Biol Evol. 1999;16:666–675. doi: 10.1093/oxfordjournals.molbev.a026149. - DOI - PubMed
    1. Cohen BA, Mitra RD, Hughes JD, Church GM. A computational analysis of whole-genome expression data reveals chromosomal domains of gene expression. Nat Genet. 2000;26:183–186. doi: 10.1038/79896. - DOI - PubMed
    1. Louis EJ, Vershinin AV. Chromosome ends: Different sequences may provide conserved functions. BioEssays. 2005;27:685–697. - PubMed
    1. Burgess SM, Kleckner N. Collisions between yeast chromosomal loci in vivo are governed by three layers of organization. Genes Dev. 1999;13:1871–1883. doi: 10.1101/gad.13.14.1871. - DOI - PMC - PubMed

Publication types

MeSH terms