. 2017 May 5;292(18):7407-7422.
doi: 10.1074/jbc.M116.763060. Epub 2017 Mar 9.

Metabolic fate of glucose and candidate signaling and excess-fuel detoxification pathways in pancreatic β-cells

Affiliations

Metabolic fate of glucose and candidate signaling and excess-fuel detoxification pathways in pancreatic β-cells

Yves Mugabo et al. J Biol Chem. .

Abstract

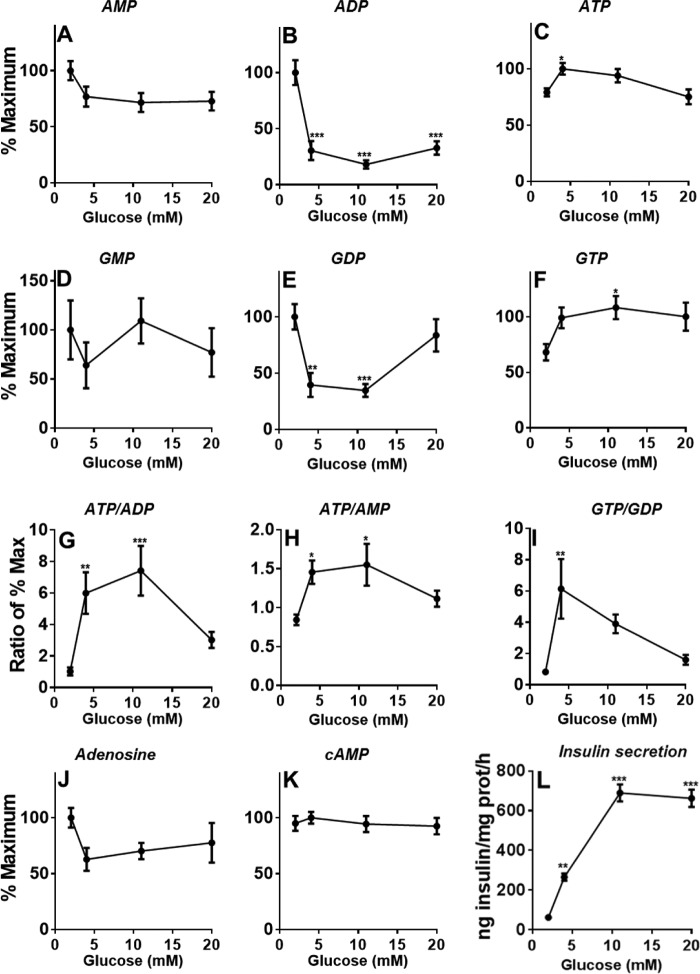
Glucose metabolism promotes insulin secretion in β-cells via metabolic coupling factors that are incompletely defined. Moreover, chronically elevated glucose causes β-cell dysfunction, but little is known about how cells handle excess fuels to avoid toxicity. Here we sought to determine which among the candidate pathways and coupling factors best correlates with glucose-stimulated insulin secretion (GSIS), define the fate of glucose in the β-cell, and identify pathways possibly involved in excess-fuel detoxification. We exposed isolated rat islets for 1 h to increasing glucose concentrations and measured various pathways and metabolites. Glucose oxidation, oxygen consumption, and ATP production correlated well with GSIS and saturated at 16 mm glucose. However, glucose utilization, glycerol release, triglyceride and glycogen contents, free fatty acid (FFA) content and release, and cholesterol and cholesterol esters increased linearly up to 25 mm glucose. Besides being oxidized, glucose was mainly metabolized via glycerol production and release and lipid synthesis (particularly FFA, triglycerides, and cholesterol), whereas glycogen production was comparatively low. Using targeted metabolomics in INS-1(832/13) cells, we found that several metabolites correlated well with GSIS, in particular some Krebs cycle intermediates, malonyl-CoA, and lower ADP levels. Glucose dose-dependently increased the dihydroxyacetone phosphate/glycerol 3-phosphate ratio in INS-1(832/13) cells, indicating a more oxidized state of NAD in the cytosol upon glucose stimulation. Overall, the data support a role for accelerated oxidative mitochondrial metabolism, anaplerosis, and malonyl-CoA/lipid signaling in β-cell metabolic signaling and suggest that a decrease in ADP levels is important in GSIS. The results also suggest that excess-fuel detoxification pathways in β-cells possibly comprise glycerol and FFA formation and release extracellularly and the diversion of glucose carbons to triglycerides and cholesterol esters.

Keywords: glucodetoxification; glucose metabolism; insulin secretion; lipid metabolism; metabolomics; mitochondrial metabolism; pancreatic β cells.


Conflict of interest statement

The authors declare that they have no conflicts of interest with the contents of this article

Figures

Figure 1.
Figure 1.
Glucose-induced insulin secretion in isolated rat islets and its correlation with various parameters of glucose and energy metabolism. A, insulin secretion measured in islets incubated at 4 (4G), 10 (10G), 16 (16G), and 25 (25G) mm glucose for 1 h. Glucose utilization (B) and oxidation (C) in islets incubated for 1 h with d-[U-14C] glucose and d-[5-3H] glucose are shown. D–F, respiration and mitochondrial function. Oxygen consumption rate, ATP production, and proton leak were calculated from individual traces. Superoxide (O2˙̄) (G and J) and H2O2 production (H and K) in dispersed rat islet cells incubated for 1 h are shown. J and K, ROS data with ROS inhibitor N-acetyl-l-cysteine (NAC; 0.4 mm) and the positive controls H2O2 (10 μm) and 16 mm glucose (16G) + rotenone (Rot; 1 μm). Glycerol release (I) and islet glycogen content (L) after 1 h incubation are shown. Error bars represent means ± S.E. of six to nine islet incubations in three separate experiments except for glycogen determinations, which were performed in two experiments. *, p < 0.05; **, p < 0.01; ***, p < 0.001 versus 4 mm glucose; one way-ANOVA.
Figure 2.
Figure 2.
Glucose dose-dependently enhances FFA release and causes FFA, triglyceride, and cholesterol deposition in isolated rat islets without saturation at concentrations maximal for secretion. A and B, cellular content and release of total FFA by islets at 4 (4G), 10 (10G), 16 (16G), and 25 (25G) mm glucose. C, TG content. D and E, cellular content and release of different FFA species. Total cholesterol (Total Chol) (F), cholesterol ester (Chol Esters) (G), and free cholesterol (Free Chol) (H) contents are shown. Error bars represent means ± S.E. of six to nine islet incubations from of two to three independent experiments. Incubation time, 1 h. C14:0, myristic acid; C16:0, palmitic acid; C18:1, oleic acid; C18:0, stearic acid. *, p < 0.05; **, p < 0.01; ***, p < 0.001 versus 4 mm glucose; one way-ANOVA.
Figure 3.
Figure 3.
A major fate of glucose metabolism in islets is glycerol release and lipid molecules. A and B, changes in the flux of metabolic pathways and in the levels of various metabolites compared with lower glycolysis in isolated islets following glucose stimulation from 4 to 16 mm (A) and from 16 to 25 mm (B). C and D, transformation in carbon equivalents, taking into account the number of carbons of each molecule, of the changes in the levels of various metabolites found in A and B following glucose stimulation from 4 to 16 mm (C) and from 16 to 25 mm (D). E and F report the same data of carbon equivalents expressed as percentages of calculated glycolysis. Carbon equivalents were calculated as described under “Experimental procedures.” The terms lower glycolysis, upper glycolysis, and calculated glycolysis are explained under “Experimental procedures” and the corresponding “Results” section. Incubation time, 1 h. Error bars represent means ± S.E. of six to 12 islets incubations in two to four independent experiments. Chol, cholesterol.
Figure 4.
Figure 4.
Insulin secretion and its correlation with the levels of glycolysis-related metabolites and citric acid cycle intermediates in response to increasing glucose concentrations in INS-1(832/13) cells. A, insulin secretion at 2, 4, 12, and 20 mm glucose. At the end of the 1-h incubation, the following metabolites were extracted from the cells and analyzed by LC-MS/MS: DHAP (B), Gro-3-P (C), pyruvate (D), lactate (E), isocitrate + citrate (F), α-ketoglutarate (G), succinate (H), fumarate (I), and malate (J). n.d., not detected. Error bars represent means ± S.E. of 12 cell incubations in four independent experiments. **, p < 0.01; ***, p < 0.001 versus 2 mm glucose; one way-ANOVA.
Figure 5.
Figure 5.
Changes in the levels of some amino acids and short-chain CoA derivatives in response to increasing glucose concentrations in INS-1(832/13) cells. Experimental conditions are those of Fig. 4. A, glutamine. B, glutamate. C, aspartate. D, leucine. E, alanine. F, acetoacetyl-CoA. G, acetyl-CoA. H, malonyl-CoA. I, HMG-CoA. J, insulin secretion (the data are the same data as shown in Fig. 4A and are used for comparison of the dose dependence of metabolites levels with insulin release). Error bars represent means ± S.E. of 12 cell incubations in four independent experiments. ***, p < 0.001 versus 2 mm glucose; one way-ANOVA.
Figure 6.
Figure 6.
Effect of increasing glucose concentrations on the levels of nicotinamide adenine dinucleotides and glutathione derivatives in INS-1(832/13) cells. Experimental conditions are those of Fig. 4. A, NAD+. B, NADH. C, NADP+. D, NADPH. E, GSH. F, GSSG. G, NADH/NAD. H, NADPH/NADP. I, GSH/GSSG. J, DHAP/Gro-3-P. K, pyruvate/lactate. L, insulin secretion (the data shown are the same data shown in Fig. 4A and are used for comparison of the dose dependence of metabolites levels with insulin release). n.d., not detected. Error bars represent means ± S.E. of 12 cell incubations in four independent experiments. *, p < 0.05; **, p < 0.01; ***, p < 0.001 versus 2 mm glucose; one way-ANOVA.
Figure 7.
Figure 7.
Effect of increasing glucose concentrations on the levels of adenine, guanine, and cyclic nucleotides in INS-1(832/13) cells. Experimental conditions are those of Fig. 4. A, AMP. B, ADP. C, ATP. D, GMP. E, GDP. F, GTP. G, ATP/ADP. H, ATP/AMP. I, GTP/GDP. J, adenosine. K, cAMP. L, insulin secretion (the data shown are the same data shown in Fig. 4A and are used for comparison of the dose dependence of metabolites levels with insulin release). Error bars represent means ± S.E. of 12 cell incubations in four independent experiments. *, p < 0.05; **, p < 0.01; ***, p < 0.001 versus 2 mm glucose; one way-ANOVA.

References

    1. Prentki M., Matschinsky F. M., and Madiraju S. R. (2013) Metabolic signaling in fuel-induced insulin secretion. Cell Metab. 18, 162–185 - PubMed
    1. Henquin J. C. (2011) The dual control of insulin secretion by glucose involves triggering and amplifying pathways in β-cells. Diabetes Res. Clin. Pract. 93, Suppl. 1, S27–S31 - PubMed
    1. Aguilar-Bryan L., Nichols C. G., Wechsler S. W., Clement J. P. 4th, Boyd A. E. 3rd, González G., Herrera-Sosa H., Nguy K., Bryan J., and Nelson D. A. (1995) Cloning of the β cell high-affinity sulfonylurea receptor: a regulator of insulin secretion. Science 268, 423–426 - PubMed
    1. Ashcroft F. M., Harrison D. E., and Ashcroft S. J. (1984) Glucose induces closure of single potassium channels in isolated rat pancreatic β-cells. Nature 312, 446–448 - PubMed
    1. Straub S. G., and Sharp G. W. (2002) Glucose-stimulated signaling pathways in biphasic insulin secretion. Diabetes Metab. Res. Rev. 18, 451–463 - PubMed

Publication types

Grants and funding

LinkOut - more resources