. 2017 Mar 31;355(6332):1428-1433.
doi: 10.1126/science.aaf1292. Epub 2017 Mar 9.

T cell costimulatory receptor CD28 is a primary target for PD-1-mediated inhibition

Affiliations

T cell costimulatory receptor CD28 is a primary target for PD-1-mediated inhibition

Enfu Hui et al. Science. .

Abstract

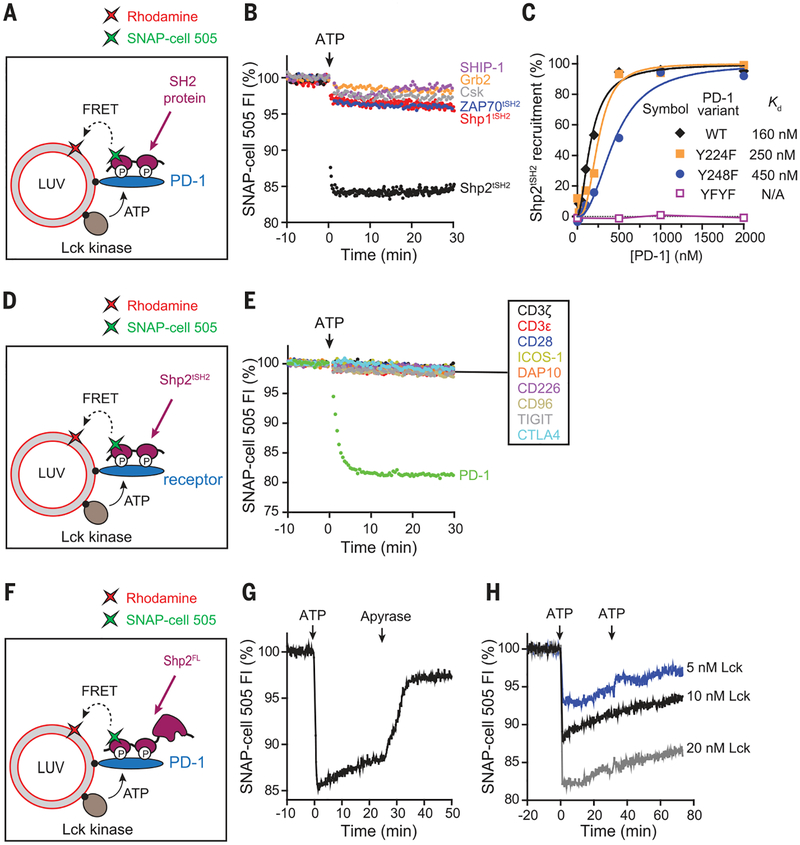
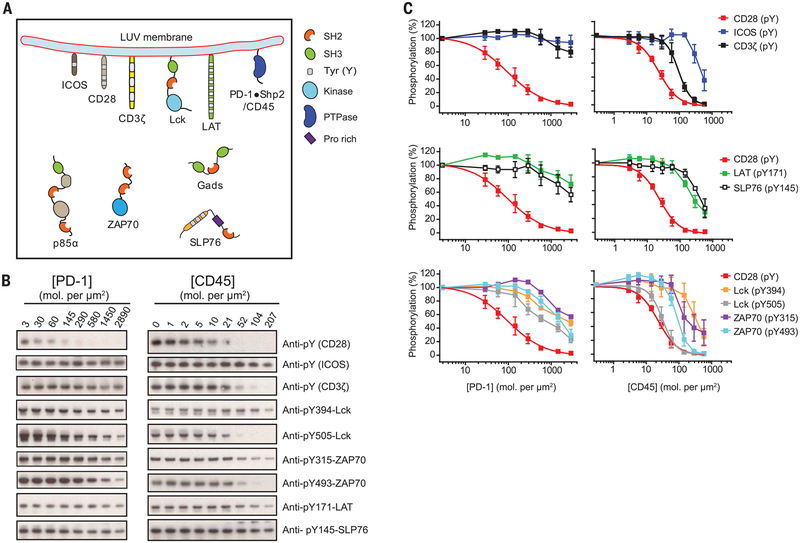
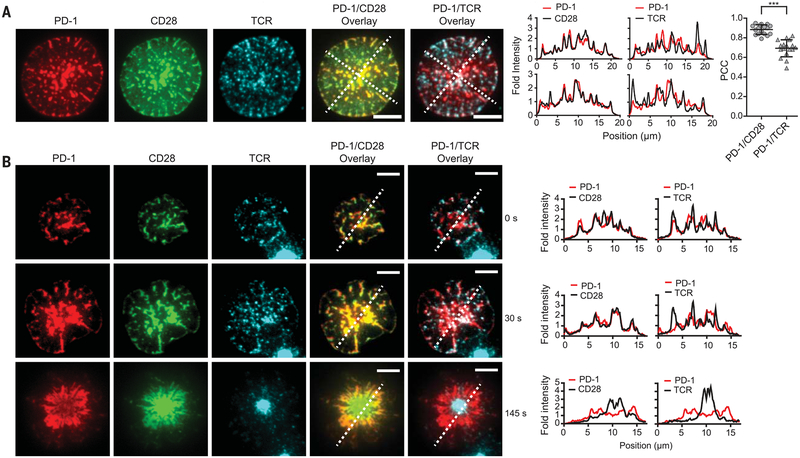
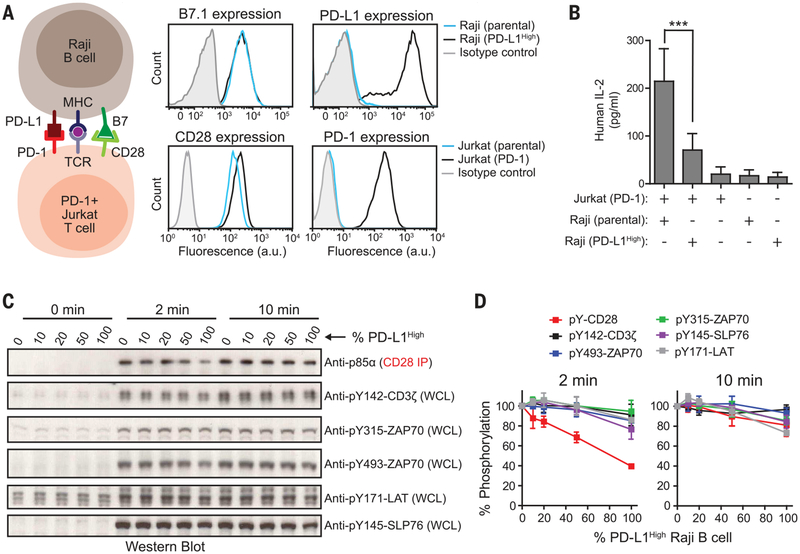
Programmed cell death-1 (PD-1) is a coinhibitory receptor that suppresses T cell activation and is an important cancer immunotherapy target. Upon activation by its ligand PD-L1, PD-1 is thought to suppress signaling through the T cell receptor (TCR). By titrating PD-1 signaling in a biochemical reconstitution system, we demonstrate that the co-receptor CD28 is strongly preferred over the TCR as a target for dephosphorylation by PD-1-recruited Shp2 phosphatase. We also show that CD28, but not the TCR, is preferentially dephosphorylated in response to PD-1 activation by PD-L1 in an intact cell system. These results reveal that PD-1 suppresses T cell function primarily by inactivating CD28 signaling, suggesting that costimulatory pathways play key roles in regulating effector T cell function and responses to anti-PD-L1/PD-1 therapy.


Figures

Fig. 1.
Fig. 1.. Lck sustains the formation of a highly specific PD-1–Shp2 complex.
(A) Cartoon depicting a FRET assay for measuring the interaction between a SH2 domain–containing protein and membrane-bound PD-1. LUVs bearing Rhodamine-PE (energy acceptor) were reconstituted with purified Lck kinase and the cytosolic domain of PD-1, as described in the methods (supplementary materials). The SNAP-Tag–fused SH2 protein of interest was labeled with SNAP-Cell 505 (energy donor) and presented in the extravasicular solution. Addition of ATP triggered Lck-catalyzed phosphorylation of PD-1 and caused the recruitment of certain SH2 proteins to the LUV surface, leading to FRET. (B) A comparison of the PD-1–binding activities of a panel of SH2 domain–containing proteins, using the FRET assay as described in (A). Shown are representative time courses of SNAP-Cell 505 fluorescence before and after the addition of 1 mM ATP. Concentrations of components were 300 nM PD-1, 7.2 nM Lck, and 100 nM labeled SH2 protein. tSH2, tandem SH2 domains; FI, fluorescence intensity. (C) A comparison of the relative contribution of the two tyrosines of PD-1 in recruiting Shp2. Shown is the degree of Shp2 recruitment against the concentration of LUV-bound PD-1 wild type (WT) or tyrosine mutant, measured by the FRET assay described in (A). Raw data are shown in fig. S3. Kd, dissociation constant; F, phenylalanine. (D) Cartoon depicting a FRET assay for measuring the ability of a membrane-bound receptor to recruit Shp2. The experimental setup was the same as in (A), except that PD-1 was replaced with another receptor of interest, using the tandem SH2 domains of Shp2 as a fixed donor bearer. (E) A comparison of the Shp2-binding activities of the designated LUV-bound receptors, using the FRET assay shown in (D). Concentrations were 300 nM receptor, 7.2 nM Lck, and 100 nM labeled Shp2tSH2. (F) Cartoon showing a FRET assay for measuring the localization dynamics of full-length Shp2 (Shp2FL). LUVs bearing Rhodamine-PE (energy acceptor) were reconstituted with purified Lck kinase and the cytosolic domain of PD-1, as described in the methods. SNAP-Tag–fused Shp2FL was labeled with SNAP-Cell 505 (energy donor) and presented in the extravesicular solution. (G) Time course of the fluorescence of Shp2FL in response to sequential addition of ATP (2 mM) and the ATP scavenger apyrase (80 mg/ml) to the reaction shown in (F). Concentrations of components were 300 nM PD-1, 10 nM Lck, and 50 nM Shp2FL. (H) Time course of the Shp2FL fluorescence, showing the dynamics of Shp2 at indicated Lck concentrations. The assay was set up as in (F), and 2 mM ATP was added twice, at 0 and 30 min.
Fig. 2.
Fig. 2.. CD28 is distinctively sensitive to PD-1–bound Shp2.
(A) Cartoon depicting a LUV reconstitution system for assaying the sensitivities of different targets to PD-1–Shp2. Purified cytosolic domains of plasma membrane–bound receptors (CD3z, CD28, and PD-1), the adaptor LAT, and the kinase Lck were reconstituted onto LUVs at their physiological molecular densities (table S1). Cytosolic factors (ZAP70, p85a, Gads, SLP76, and Shp2) were presented in the extravesicular solution at their physiological concentrations (table S1). In a parallel experiment, PD-1 and Shp2 were replaced with the liposome-attached cytoplasmic por tion of CD45. Addition of ATP triggered a cascade of enzymatic reactions and protein-protein interactions. PTPase, protein tyrosine phosphatase; Pro, proline. (B) Shp2-containing reactions with increasing concentrations of PD-1 and CD45-containing reactions with increasing concentrations of CD45, terminated at 30 min and subjected to SDS–polyacrylamide gel electrophoresis and phosphotyrosine Western blots, as described in the methods. (C) The optical density of each band in (B) was quantified by ImageJ. The 50% inhibitory concentrations (IC50) of PD-1 and CD45 on different targets were determined by using Graphpad Prism 5.0 to fit the dose response data in (B), or estimated from the dose response plots if the inhibition was incomplete even at the highest PD-1 or CD45 concentration (summarized in table S2). Error bars, SD from three independent experiments.
Fig. 3.
Fig. 3.. PD-1 coclusters with costimulatory receptor CD28 but partially segregates with TCR.
(A) On the left are representative TIRF images of PD-1, CD28, and TCR of an OT-I CD8+ Tcell 10 s after landing on a supported lipid bilayer functionalized with recombinant ligands (100 to 250 molecules/μm2), which included pMHC (H2Kb;TCR ligand), B7.1 (CD28 ligand), and ICAM-1 (integrin LFA1 ligand). Cells were retrovirally transduced with PD-1‒mCherry and CD28‒ mGFP (monomeric green fluorescent protein), and the TCR was labeled with an Alexa Fluor647–conjugated antibody against TCR (see the methods). Scale bars, 5 μm. The experiment shown is representative of five independent experiments. In the plots to the right, intensities were calculated from the raw fluorescence intensities along the two diagonal lines in the overlaid images (see the methods). On the far right is a column scattered plot summarizing the Pearson’s correlation coefficient (PCC) values for the PD-1/CD28 overlay(0.89 ± 0.05, mean ± SD) and PD-1/TCR overlay (0.69 ± 0.09) of 17 fully spread cells, with each symbol representing a different cell. Statistical significance was evaluated by a two-tailed Student’s t test; P < 0.0001. (B) On the left are TIRF images showing the time course of the development of a PD-1–CD28–TCR immunological synapse, starting from initial contact with the supported lipid bilayer (0 s) and continuing to full spreading (30 s) and a bull’s eye pattern (145 s). Scale bars, 5 μm. The experiment is representative of four independent experiments. At right are histograms from the respective line scan quantifications.
Fig. 4.
Fig. 4.. Intact cell assays confirm CD28 as the preferential target of PD-1–mediated inhibition.
(A) The cartoon on the left illustrates an intact cell assay in which CD28+, PD-1–transduced Jurkat T cells were stimulated with B7.1+, PD-L1–transduced (PD-L1High) Raji B cells pre-loaded with antigen. On the right are FACS (fluorescence-activated cell sorting) histograms showing the expression of B7.1 and PD-L1 in parental or PD-L1High Raji B cells and the expression of CD28 and PD-1 in parental or PD-1–transduced Jurkat T cells. a.u., arbitrary units. (B) Bar graph summarizing IL-2 release from a 24-hour Jurkat-Raji coculture with or without PDL1–PD-1 signaling and from each type of cell alone (see the methods). Data are presented as means ± SD from four independent measurements, with each run in triplicates. ***P < 0.0001; two-way ANOVA (analysis of variance). (C) A representative Western blot experiment showing the phosphorylation of CD28 and TCR signaling components in Jurkat Tcells in response to PD-L1 titration on antigen-presenting Raji B cells; the time after the initial contact of the two cell populations is indicated (see the methods). Different ratios of PD-L1High to PD-L1 Raji B cells (both containing pMHC and B7.1) were used to vary the PD-L1 stimulation to the Jurkat cells. Each condition con tained an identical number of Raji B cells (Raji to Jurkat ratio, 0.75). The phosphorylation states of CD3ζ, ZAP70, and LAT were immunoblotted with phosphospecific antibodies. Because of the lack of CD28-specific phosphotyrosine antibodies, CD28 was coprecipitated with p85α (see the methods), which is dependent on CD28 phosphorylation. WCL, whole cell lysate. (D) Quantification of phosphorylation data, incorporating results from three independent experiments (means ± SD).

Comment in

Similar articles

Cited by

References

    1. Chen L, Flies DB, Nat. Rev. Immunol 13, 227–242 (2013). - PMC - PubMed
    1. Chen DS, Mellman I, Immunity 39, 1–10 (2013). - PubMed
    1. Keir ME, Butte MJ, Freeman GJ, Sharpe AH, Annu. Rev. Immunol 26, 677–704 (2008). - PMC - PubMed
    1. Freeman GJ et al., J. Exp. Med 192, 1027–1034 (2000). - PMC - PubMed
    1. Dong H et al., Nat. Med 8, 793–800 (2002). - PubMed

Publication types