. 2017 Feb 23:11:9.
doi: 10.3389/fnana.2017.00009. eCollection 2017.

The Role of Glia in the Peripheral and Central Auditory System Following Noise Overexposure: Contribution of TNF-α and IL-1β to the Pathogenesis of Hearing Loss

Affiliations

The Role of Glia in the Peripheral and Central Auditory System Following Noise Overexposure: Contribution of TNF-α and IL-1β to the Pathogenesis of Hearing Loss

Verónica Fuentes-Santamaría et al. Front Neuroanat. .

Abstract

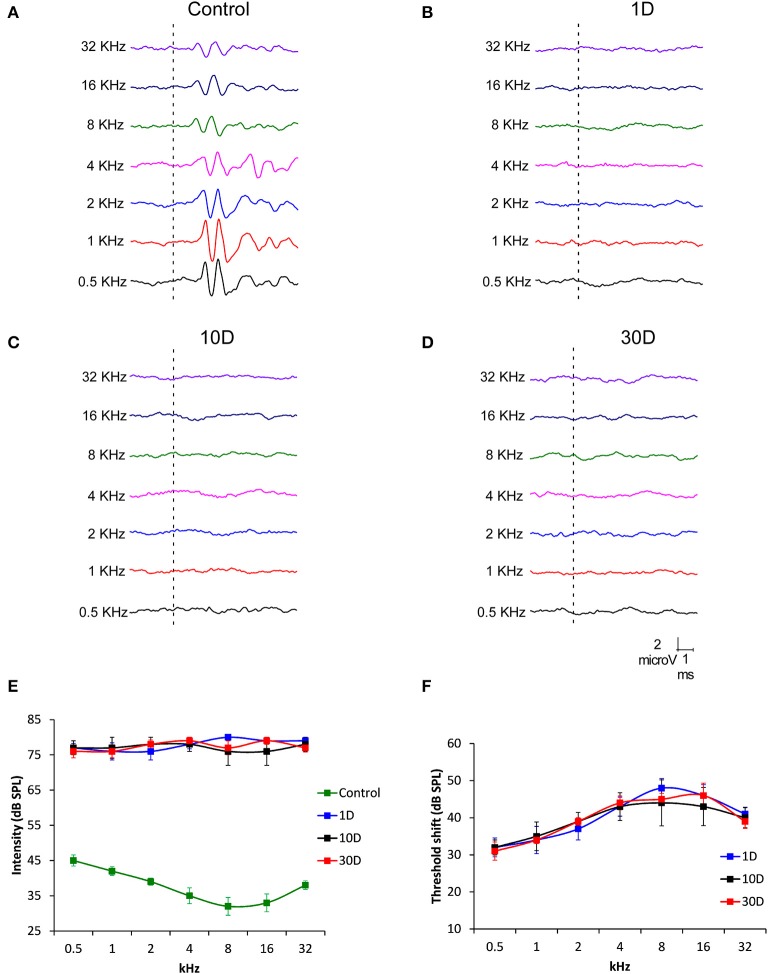
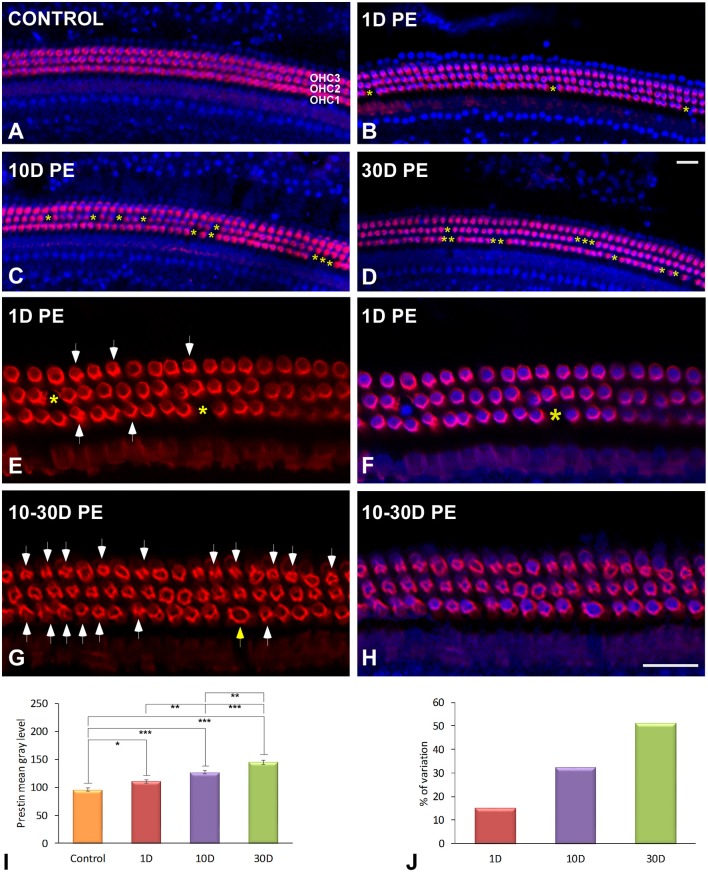
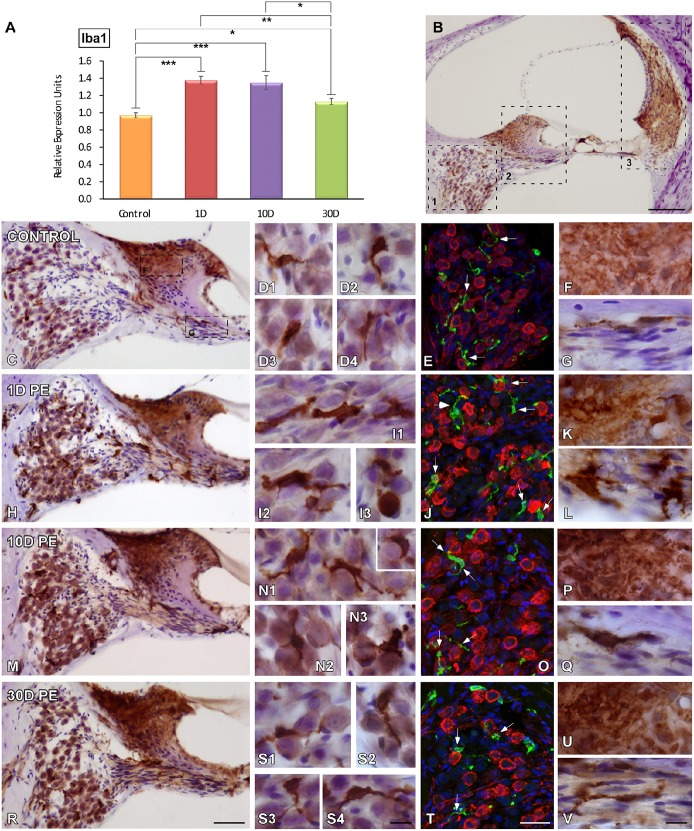
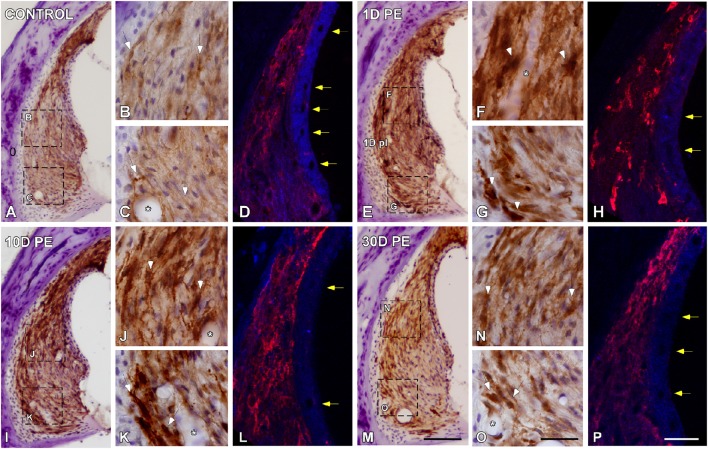
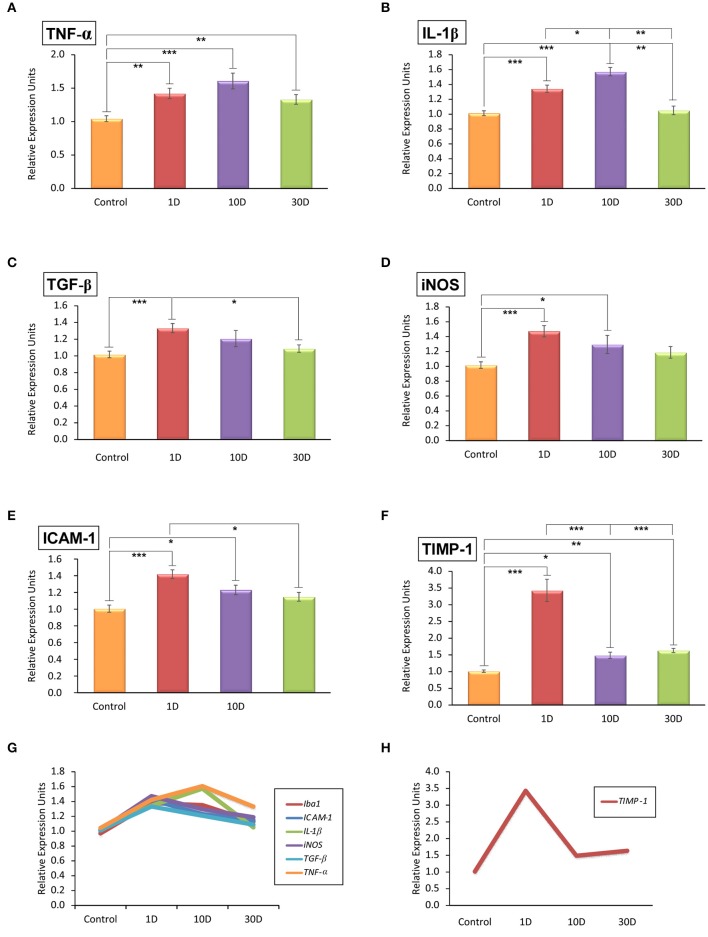
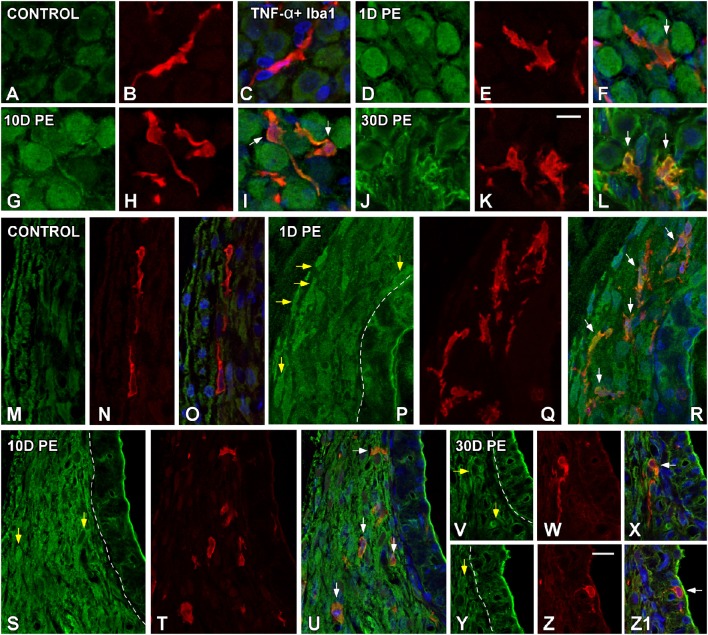
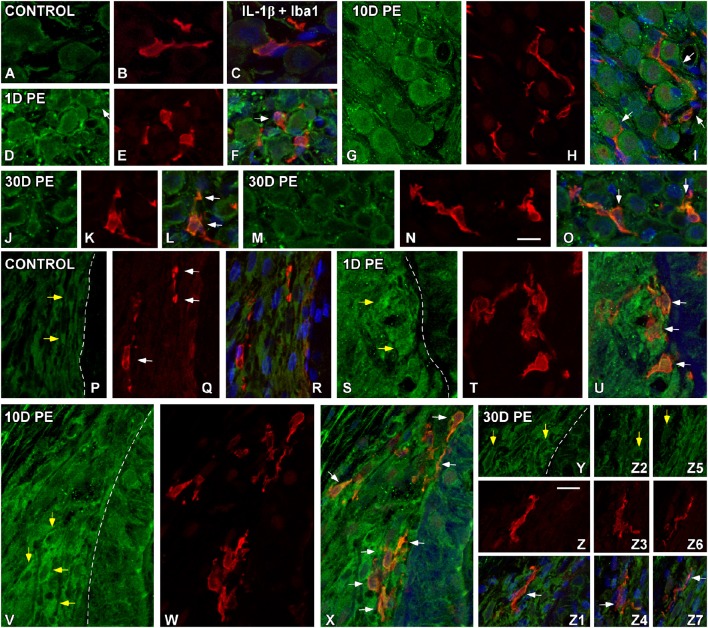
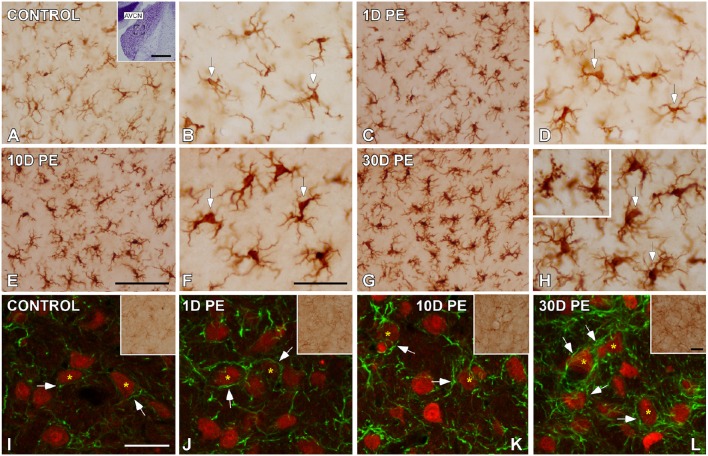
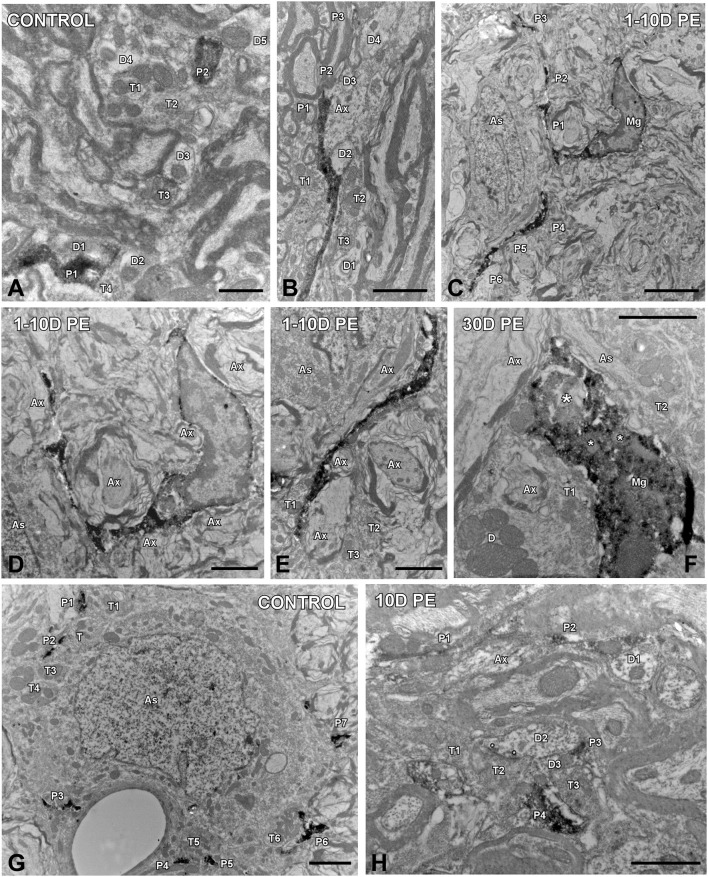
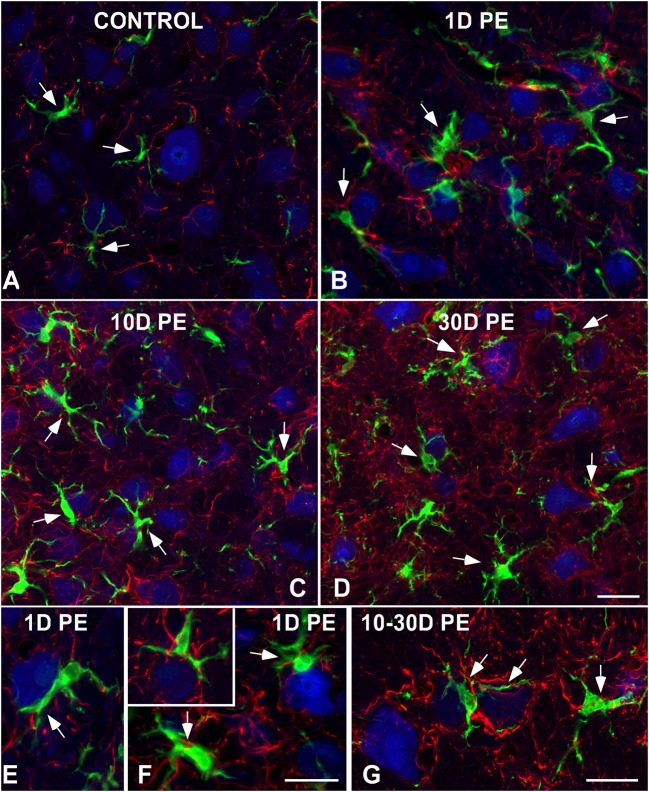
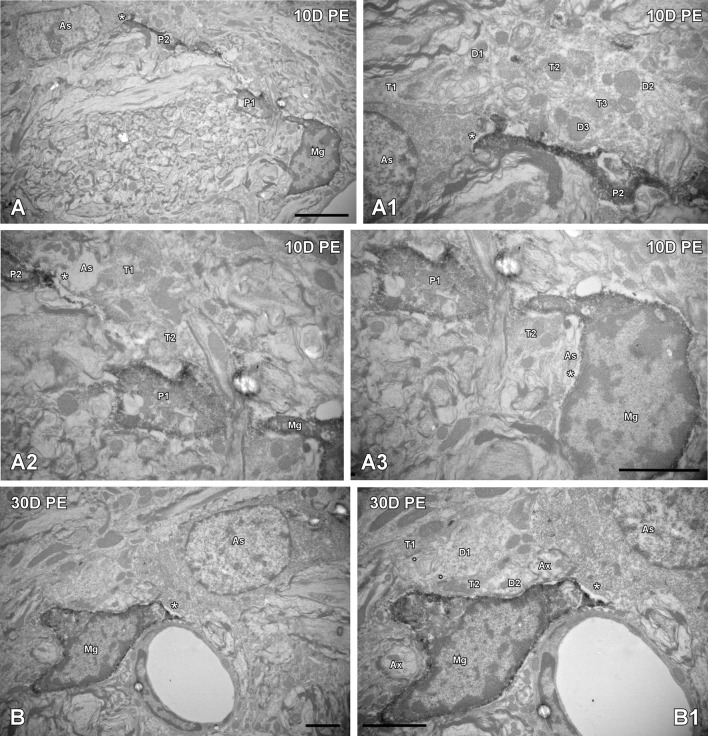
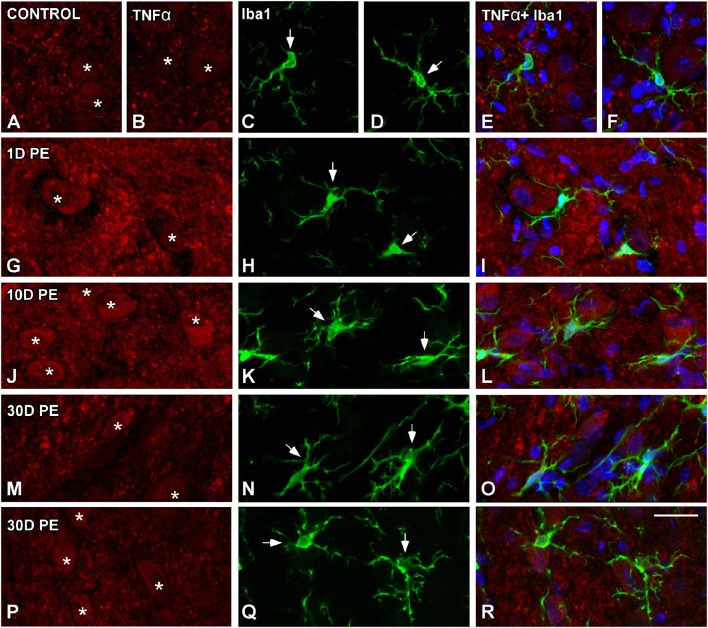
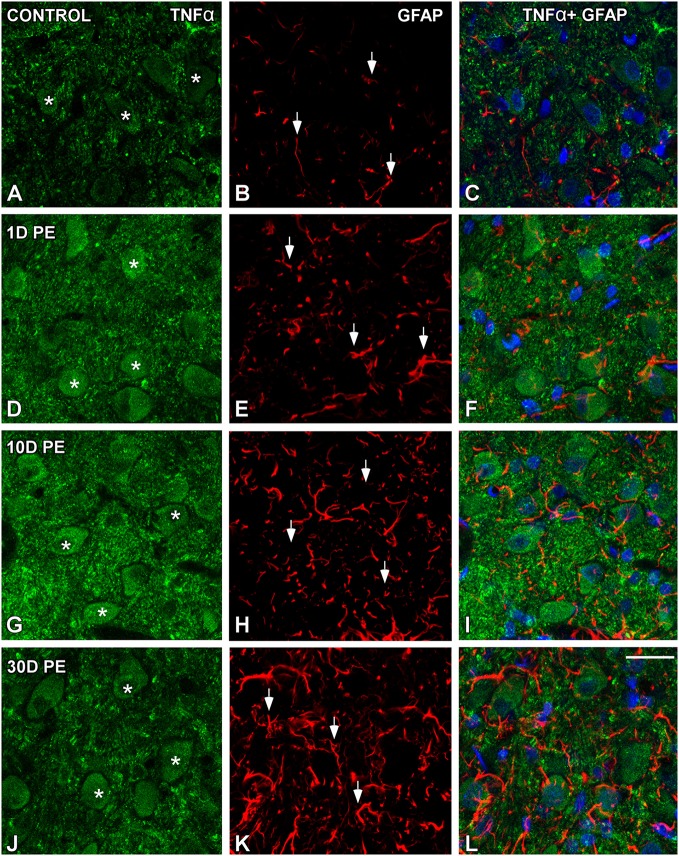
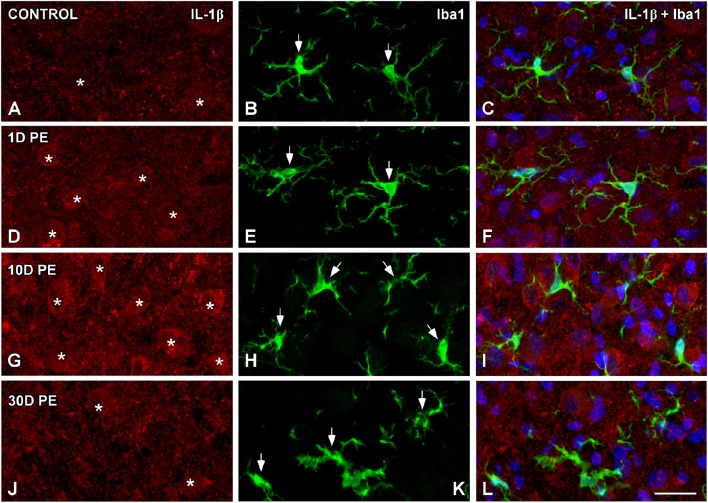
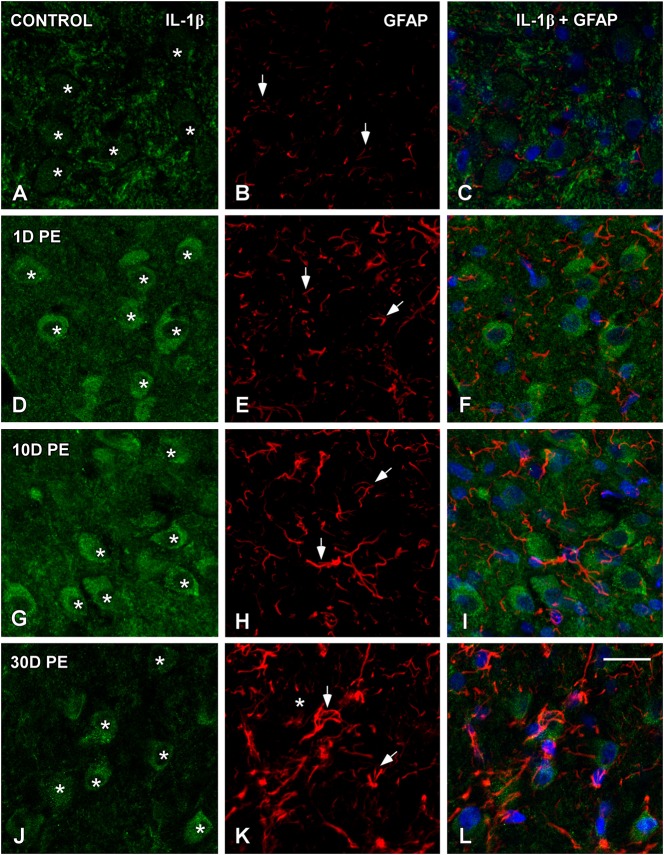
Repeated noise exposure induces inflammation and cellular adaptations in the peripheral and central auditory system resulting in pathophysiology of hearing loss. In this study, we analyzed the mechanisms by which noise-induced inflammatory-related events in the cochlea activate glial-mediated cellular responses in the cochlear nucleus (CN), the first relay station of the auditory pathway. The auditory function, glial activation, modifications in gene expression and protein levels of inflammatory mediators and ultrastructural changes in glial-neuronal interactions were assessed in rats exposed to broadband noise (0.5-32 kHz, 118 dB SPL) for 4 h/day during 4 consecutive days to induce long-lasting hearing damage. Noise-exposed rats developed a permanent threshold shift which was associated with hair cell loss and reactive glia. Noise-induced microglial activation peaked in the cochlea between 1 and 10D post-lesion; their activation in the CN was more prolonged reaching maximum levels at 30D post-exposure. RT-PCR analyses of inflammatory-related genes expression in the cochlea demonstrated significant increases in the mRNA expression levels of pro- and anti-inflammatory cytokines, inducible nitric oxide synthase, intercellular adhesion molecule and tissue inhibitor of metalloproteinase-1 at 1 and 10D post-exposure. In noise-exposed cochleae, interleukin-1β (IL-1β), and tumor necrosis factor α (TNF-α) were upregulated by reactive microglia, fibrocytes, and neurons at all time points examined. In the CN, however, neurons were the sole source of these cytokines. These observations suggest that noise exposure causes peripheral and central inflammatory reactions in which TNF-α and IL-1β are implicated in regulating the initiation and progression of noise-induced hearing loss.

Keywords: auditory system; cochlear nucleus; cytokines; inflammation; inner ear.


Figures

Figure 1
Figure 1
Line graphs showing ABR recordings (A–D) in control (n = 12) and noise-exposed (n = 36) rats at 80 dB SPL for frequencies between 0.5 and 32 kHz. When compared to the ABR pattern of unexposed rats (A), noise exposure (118 dB SPL) for 4 h/day during 4 consecutive days resulted in an almost complete absence of the typical ABR waves at all frequencies and time points assessed following the exposure (B–D). Progression of the auditory thresholds (E,F) indicated that noise-exposed rats at all survival times had higher values than those observed in unexposed animals (E). The threshold shift values fluctuated between 32 and 42 dB (F). Recordings in (A–D) are represented at 80 dB SPL.
Figure 2
Figure 2
Surface preparation images illustrating double-labeling of prestin (red) and DAPI (blue) in the middle cochlear turn in control (A) and noise-exposed (B–H) rats. The survival of OHC was significantly decreased with longer time points post-exposure. Loss of OHC are indicated by yellow asterisks. Arrows in (E,G) indicate disrupted OHC stained with prestin protein. The yellow arrow in (G) indicates a swollen nucleus. Quantification of the mean gray levels indicated noise-induced increases in prestin staining when compared to control cochleae (I). The percentage of variation of the immunostaining in noise-exposed (n = 5 for each group) animals relative to control (n = 5) is shown in (J). The time of sacrifice following exposure (PE) is indicated in the upper left of each image. Significant differences in prestin immunostaining among animal groups (I) are indicated by asterisks (*p < 0.05; **p < 0.01, ***p < 0.001). Scale bars: 20 μm in (D,H).
Figure 3
Figure 3
Iba1 mRNA expression and protein levels in the cochlea of control and noise-exposed rats. mRNA levels in the noise-exposed cochleae were elevated at all time points post-exposure (A). The time course of MLC activation was examined in noise-vulnerable cochlear regions including the spiral ganglion (B1), the spiral limbus and cochlear nerve (B2), and the spiral ligament (B3) at 1, 10, and 30D post-exposure. As compared to control rats (C–G), noise produced increases in MLC activation were observable on day 1, when cells had larger cell bodies and thickened and shortened processes (H–L). Although these cells remained active by 10D post-exposure (M–Q), with longer time points (30D) Iba1-stained cells recovered their ramified appearance (R–V). Confocal images showing close appositions between microglia (green) and SGN (red) are indicated by arrows in (E,J,O,T; n = 5 for each group). Significant differences in Iba1 mRNA levels among control and noise-exposed animals (A) are indicated by asterisks (*p < 0.05; **p < 0.01, ***p < 0.001). Scale bars: 200 μm in (B); 50 μm in (R); 10 μm in (S4,V) and 25 μm in (T).
Figure 4
Figure 4
Digital images showing Iba1-immunostaining in the spiral ligament of control (n = 5) and noise-exposed (n = 5 for each group) rats. When compared to the control condition (A–C), Iba1-immunostaining at all time points post-exposure evaluated was markedly increase in MLC located in type I and IV fibrocytes regions (white arrows in E–G,I–K,M–O). Particularly on day 1, cells were darkly stained and had expanded cell bodies and thickened processes (arrows in F,G). Asterisks indicate the association of MLC with blood vessels. Yellow arrows in (H,L) point to noise-decreases in blood vessels diameter at 1 and 10D after the exposure in comparison to 30D post-exposure (arrows in P) and control (arrows in D) rats. Scale bars: 100 μm in M; 20 μm in O; and 25 μm in (P).
Figure 5
Figure 5
Quantitative RT-qPCR analyses of inflammatory-related genes expression in the noise-exposed cochlea (n = 4 for each group). Significant elevations in the mRNA expression levels of TNF(A), IL-1β (B), TGF(C), iNOS (D), and ICAM-1 (E) were detected after noise-exposure at all time points evaluated. TIMP-1 expression levels (F) were increased transiently on day 1 and quickly downregulated at longer time points post-exposure but without reaching normal levels. The overlapping distribution of genes expressed in response to noise exposure is shown in (G) while the particular progression of TIMP-1 expression is shown in (H). Significant differences among animal groups are indicated by asterisks (*p < 0.05; **p < 0.01, ***p < 0.001).
Figure 6
Figure 6
Confocal images depicting the colocalization between TNF-α (green) and the microglial marker, Iba1 (red), in the SG (A–L), and SL (M–Z1) in control (n = 5) and noise-exposed (n = 5 for each group) rats. In the SG, TNF-α producing cells in response to noise-exposure were neurons (D,G,J) and MLC (E,H,K) while in the SL, TNF-α protein was synthesized by MLC (Q,T,W,Z) and fibrocytes (yellow arrows in P,S,V,Y). White arrows point to double-stained cells in the SG and SL. Scale bars: 10 μm in (K,Z).
Figure 7
Figure 7
Confocal images depicting the colocalization between IL-1β (green) and Iba1 (red) in the SG (A–O) and SL (P–Z7) in control (n = 5) and noise-exposed (n = 5 for each group) rats. In the SG, IL-1β producing cells in response to noise-exposure were neurons (D,G,J,M) and MLC (E,H,K,N) while in the SL, IL-1β producing cell types were MLC (T,W,Z,Z3,Z6) and fibrocytes (yellow arrows in S,V,Y,Z2,Z5). White arrows point to double-stained cells in the SG and SL. Scale bars: 10 μm in (N,Z).
Figure 8
Figure 8
Digital images showing the time course of glial activation in the AVCN in control (n = 5) and noise-exposed (n = 5 for each group) rats. Microglial (A–H) and astroglial (I–L) activation responses increased progressively over time reaching maximum levels on day 30 post-exposure (H,L). Microglia are indicated by arrows in (A–H) while appositions between cochlear nucleus neurons (red) and astrocytes (green) are designated by arrows in (I–L). The inset in (A) shows the location of the AVCN, and the square box indicates the approximate locations of the fields represented in (A–L). Scale bars: 50 μm in (A; inset); 100 μm in (E); 50 μm in (F,L; inset); and 40 μm in (I).
Figure 9
Figure 9
Ultrastructure of microglia (A–F) and astrocytes (G,H) in the AVCN in control (n = 4) and noise-exposed (n = 4 for each group) rats. In the control condition, microglial processes spread through the neuropil contacting multiple cellular elements (A). Between 1 and 10D post-exposure (C–E), dynamic microglia quickly associated with nearby elements preferentially axons and terminals in the vicinity. On day 30, a few microglial cells transformed into a phagocytic phenotype in which inclusion bodies (small asterisks) and engulfed material (large asterisk) were observed (F). Note that this microglial cell was in close association with terminals, axons, dendrites and astrocytic processes. When compared to the control condition (G), reactive astrocytic processes (P1–P4) on day 10 juxtaposed synapses (asterisks in H) and axons and terminals in the adjacent neuropil. As, astrocyte; Ax, Axon; D, D1-D5, dendrites; Mg, microglia, P1–P6, microglial/astroglial processes; T1–T6, terminals. Scale bars: 1 μm in (A,H); 2 μm in (B,D–G); 5 μm in (C).
Figure 10
Figure 10
Interactions between glia and neurons in the AVCN in control (A;n = 5) and noise-exposed (n = 5 for each group) rats (B–G). Microglial processes (green) and astrocytes (red) made multiple contacts simultaneously with cochlear nucleus neurons (blue) which increase in occurrence with longer time points post-exposure. Appositions between glial elements and neurons are indicated by arrows. Scale bars: 25 μm in (D); 20 μm in (F,G).
Figure 11
Figure 11
Ultrastructural interactions among microglia, astrocytes and neurons in the AVCN are regulated by noise (n = 4 for each group). In response to noise-exposure, reactive microglial processes came into close proximity with astrocytes, terminals, and synapse-associated elements at all time points evaluated (A,B). Note that the perivascular microglial cell in (B,B1) is in close contact with an astrocyte (large asterisk) and is wrapping around a dendrite making synapses with multiple terminals (small asterisks). Although interactions among microglia, astrocytes and neuronal elements were observed at all time points post-exposure (A–A3), they increased in frequency particularly on day 30 (B,B1). Appositions between microglia and astrocytes are indicated by large asterisks while the small asterisks in (B1) point to synapses. Higher magnification images of (A,B) are represented in (A1–A3, B1); respectively. As, astrocyte; Ax, axon; D1–D3, dendrites; Mg, microglia, P1–P2, microglial processes; T1–T3, terminals. Scale bars: 5 μm in (A, B1); 2.5 μm in (A3; it also applies to A1,A2); 2 μm in (B).
Figure 12
Figure 12
Confocal images depicting the lack of colocalization between TNF-α and Iba1 in control (A–F) and noise-exposed (G–R) AVCN. Note that TNF-α (red) was only expressed by auditory neurons (asterisks) and not by activated microglia (green) at all time points post-exposure (n = 5 for each group). Asterisks indicate TNF-α-containing neurons while arrows point to microglia. Scale bar: 25 μm in (R).
Figure 13
Figure 13
Confocal images depicting the lack of colocalization between TNF-α and the astroglial marker, GFAP, in control (A–C) and noise-exposed (D–L) AVCN. TNF-α (green) neither colocalized with GFAP (red) at any of the time points analyzed (n = 5 for each group). Asterisks indicate TNF-α-containing neurons while arrows point to astrocytes. Scale bar: 25 μm in (L).
Figure 14
Figure 14
Absence of colocalization between IL-1β and Iba1 in the AVCN in control rats (A–C) and following noise-exposure (D–L). Microglial (green) production of IL-1β (red) was not observed at any of the time points post-exposure (n = 5 for each group). Cochlear nucleus neurons were the sole source of this cytokine. Asterisks indicate TNF-α-containing neurons while arrows point to microglia. Scale bar: 25 μm in (L).
Figure 15
Figure 15
Absence of colocalization between IL-1β and GFAP in the AVCN in control rats (A–C) and following noise-exposure (D–L). Astroglial (red) production of IL-1β (green) was not observed at any of the time points post-exposure (n = 5 for each group). IL-1β was primarily synthesized by cochlear nucleus neurons after the exposure. Asterisks indicate TNF-α-containing neurons while arrows point to astrocytes. Scale bar: 25 μm in (L).

Similar articles

Cited by

References

    1. Abi-Hachem R. N., Zine A., Van De Water T. R. (2010). The injured cochlea as a target for inflammatory processes, initiation of cell death pathways and application of related otoprotectives strategies. Recent Patents CNS Drug Discov. 5, 147–163. 10.2174/157488910791213121 - DOI - PubMed
    1. Alvarado J. C., Fuentes-Santamaría V., Gabaldón-Ull M. C., Blanco J. L., Juiz J. M. (2014). Wistar rats: a forgotten model of age-related hearing loss. Front. Aging Neurosci. 6:29. 10.3389/fnagi.2014.00029 - DOI - PMC - PubMed
    1. Alvarado J. C., Fuentes-Santamaría V., Gabaldón-Ull M. C., Jareño-Flores T., Miller J. M., Juiz J. M. (2016). Noise-induced “toughening” effect in wistar rats: enhanced auditory brainstem responses are related to calretinin and nitric oxide synthase upregulation. Front. Neuroanat. 10:19. 10.3389/fnana.2016.00019 - DOI - PMC - PubMed
    1. Alvarado J. C., Fuentes-Santamaría V., Henkel C. K. (2009a). Rapid modifications in calretinin immunostaining in the deep layers of the superior colliculus after unilateral cochlear ablation. Hear. Res. 247, 78–86. 10.1016/j.heares.2008.10.005 - DOI - PubMed
    1. Alvarado J. C., Fuentes-Santamaría V., Henkel C. K., Brunso-Bechtold J. K. (2004). Alterations in calretinin immunostaining in the ferret superior olivary complex after cochlear ablation. J. Comp. Neurol. 470, 63–79. 10.1002/cne.11038 - DOI - PubMed

LinkOut - more resources