. 2017 Jan 18;4(1):160695.
doi: 10.1098/rsos.160695. eCollection 2017 Jan.

A full lifespan model of vertebrate lens growth

Affiliations

A full lifespan model of vertebrate lens growth

Hrvoje Šikić et al. R Soc Open Sci. .

Abstract

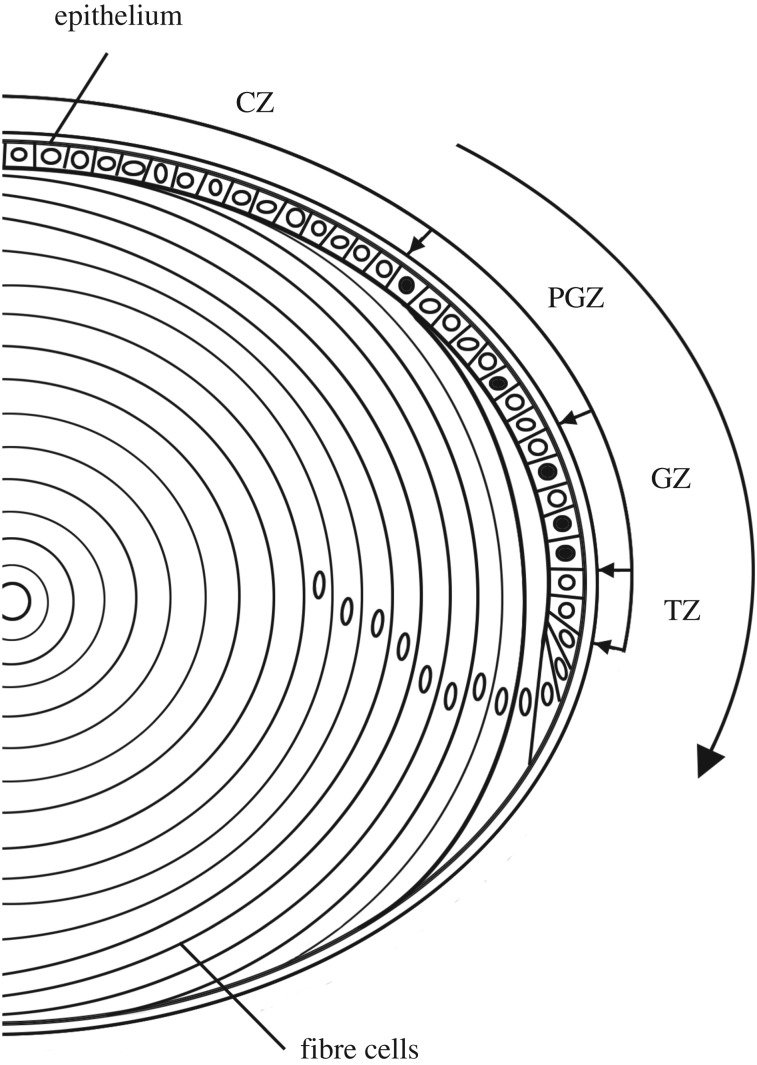
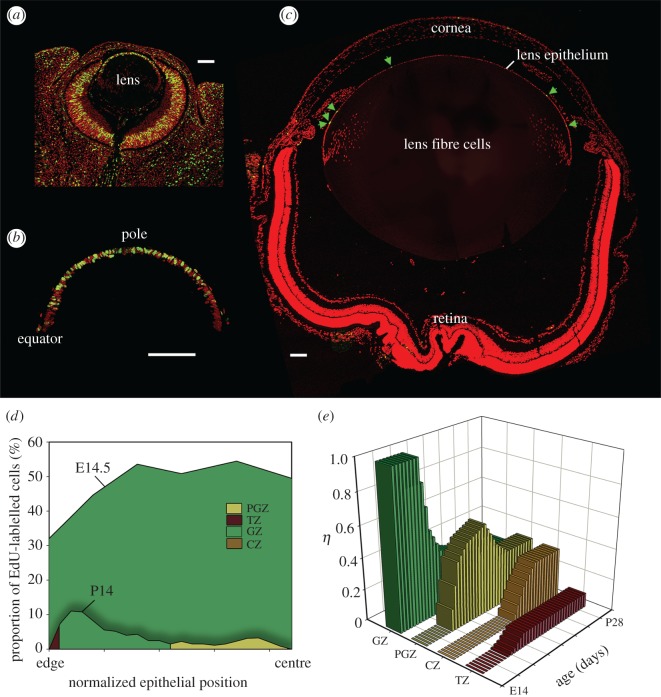
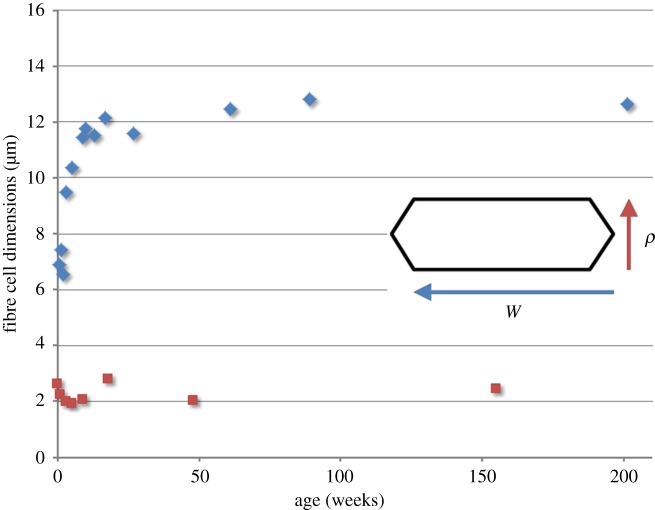
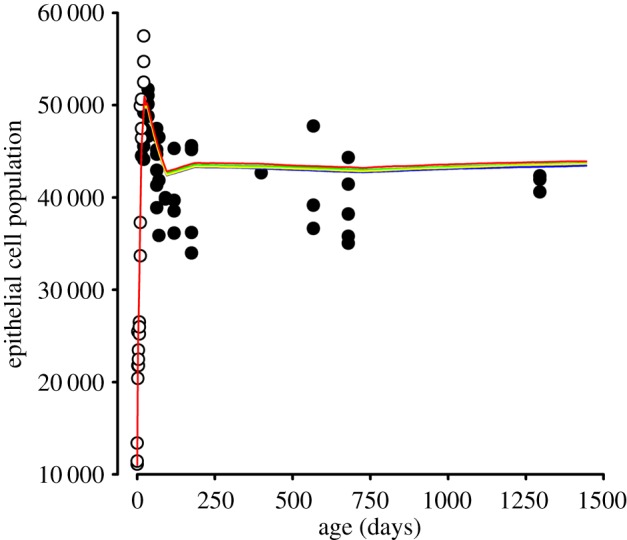
The mathematical determinants of vertebrate organ growth have yet to be elucidated fully. Here, we utilized empirical measurements and a dynamic branching process-based model to examine the growth of a simple organ system, the mouse lens, from E14.5 until the end of life. Our stochastic model used difference equations to model immigration and emigration between zones of the lens epithelium and included some deterministic elements, such as cellular footprint area. We found that the epithelial cell cycle was shortened significantly in the embryo, facilitating the rapid growth that marks early lens development. As development progressed, epithelial cell division becomes non-uniform and four zones, each with a characteristic proliferation rate, could be discerned. Adjustment of two model parameters, proliferation rate and rate of change in cellular footprint area, was sufficient to specify all growth trajectories. Modelling suggested that the direction of cellular migration across zonal boundaries was sensitive to footprint area, a phenomenon that may isolate specific cell populations. Model runs consisted of more than 1000 iterations, in each of which the stochastic behaviour of thousands of cells was followed. Nevertheless, sequential runs were almost superimposable. This remarkable degree of precision was attributed, in part, to the presence of non-mitotic flanking regions, which constituted a path by which epithelial cells could escape the growth process. Spatial modelling suggested that clonal clusters of about 50 cells are produced during migration and that transit times lengthen significantly at later stages, findings with implications for the formation of certain types of cataract.

Keywords: branching process; lens; model; organ growth; stochastic.


Figures

Figure 1.
Figure 1.
Anatomy of lens growth. The lens is composed of two cell types: epithelial cells and fibre cells. The epithelium can be divided into four zones with respect to regional proliferation rates. S-phase cells (black nuclei) are not observed in the central zone (CZ), but are detected occasionally in the pre-germinative zone (PGZ) and are most numerous in the germinative zone (GZ). At the edge of the epithelium, in the transition zone (TZ), cells exit the cell cycle. Driven by mitotic activity in the PGZ and GZ, epithelial cells are displaced toward the equator in the direction shown by the large arrow. Cell division and differentiation are ongoing, resulting in continuous formation of fibre cells and lifelong macroscopic growth of the lens.
Figure 2.
Figure 2.
Formation of proliferative zones. S-phase cells (green) were visualized in sections of developing mouse eye. At E14.5 (a,b), S-phase cells are distributed uniformly but, by P14 (c), they are most numerous in the peripheral epithelium (green arrows). Labelling index profiles were computed (d). For the examples shown (E14.5 and P14), the proliferation rate is higher throughout the epithelium at the earlier stage. By P14, three zones (TZ, GZ and PGZ) are discernible, the fourth (CZ) appears a few days later. The fractional contribution (η) of each zone to the surface area varies initially but, by P28, values have stabilized (e). Scale bar (a–c) = 100 µm.
Figure 3.
Figure 3.
Age-dependent variation in fibre cell cross-sectional shape. In the equatorial plane, fibre cells have a flattened hexagonal profile. The broad faces of the hexagons are oriented parallel to the lens surface. Variations in cross-sectional area (the product of width (w, blue diamond) and thickness (ρ, orange square)) were incorporated into the lens growth model. Note that fibre cell width increases significantly over the first few months of age, whereas cell thickness is relatively constant across the lifespan.
Figure 4.
Figure 4.
Population dynamics in the mouse lens epithelium from E14.5 (model day 0) until the end of life. Population data were determined directly (open circles) or adapted from published values (filled circles; [4]). Results of five independent model simulations are shown (coloured lines). Note the concordance between model runs.
Figure 5.
Figure 5.
Fibre cell production and accumulation. (a) Early in development, fibre cells are produced at a rapid rate (more than 15 000 cells per day at E14.5 (model day 0)). Later, the rate of production falls to 100–200 cells per day (inset). The number of fibres increases throughout life, rapidly in the young lens, more slowly at later time points (b). By the end of the lifespan, the lens contains nearly half a million fibre cells.
Figure 6.
Figure 6.
Growth in lens radius modelled across the lifespan. Empirical measurements were collected as described (open circles), or taken from the literature (closed circles) (7, 8). Growth simulations (blue lines) are shown with or without correction for fibre compaction (see the text for details).
Figure 7.
Figure 7.
The projected effect of contraction or expansion in the footprint area of CZ cells (aCZ) on population dynamics in the period 60–150 days. Contraction of aCZ results in a modest increase in the CZ cell population but has little effect on the populations of other zones (a). Monitoring the stochastic flow of cells from the PGZ into the CZ shows that by 60 days the net flow has fallen to zero (b). Results of five independent model runs are shown. Contraction of aCZ from day 60 ensures a net positive flow of ≈15 cells day into the CZ. If aCZ is allowed to expand in parallel to aPGZ, aGZ and aTZ (see appendix D), the net flow would remain close to zero with stochastic fluctuations ensuring that a small amount of reverse flow (CZ to PGZ) occurs.
Figure 8.
Figure 8.
Effect of a 2-day hiatus in cell proliferation on the epithelial cell population (a) and radial growth (b) of the lens. Note the significant reduction in epithelial population and lens radius when growth is interrupted early (E16–E18) in development. A 2-day pause later in development (P26–P28) has little effect on lens growth (compare with figures 4 and 6).
Figure 9.
Figure 9.
Expansion in cellular footprint area (a) of epithelial cells in the four zones (CZ, PGZ, GZ and TZ) of the lens epithelium during postnatal development (data adapted from [4]). Footprint areas increase monotonically in PGZ, GZ, and TZ. However, CZ footprint area decreases slightly (red) in the period 2 months (60 days) to 6 months (180 days), before resuming its expansion at later time points. The dashed line indicates growth behavior if the expansion of the CZ was adjusted to match that of the other zones (see figure 7b of the current manuscript).

Similar articles

Cited by

References

    1. Hariharan IK. 2015. Organ size control: lessons from Drosophila. Dev. Cell 34, 255–265. (doi:10.1016/j.devcel.2015.07.012) - DOI - PMC - PubMed
    1. Buchmann A, Alber M, Zartman JJ. 2014. Sizing it up: the mechanical feedback hypothesis of organ growth regulation. Semin. Cell Dev. Biol. 35, 73–81. (doi:10.1016/j.semcdb.2014.06.018) - DOI - PMC - PubMed
    1. Bassnett S, Shi Y. 2010. A method for determining cell number in the undisturbed epithelium of the mouse lens. Mol. Vis. 16, 2294–2300. - PMC - PubMed
    1. Shi Y, De Maria A, Lubura S, Sikic H, Bassnett S. 2015. The penny pusher: a cellular model of lens growth. Invest. Ophthalmol. Vis. Sci. 56, 799–809. (doi:10.1167/iovs.14-16028) - DOI - PMC - PubMed
    1. Sikic H, Shi Y, Lubura S, Bassnett S. 2015. A stochastic model of eye lens growth. J. Theor. Biol. 376, 15–31. (doi:10.1016/j.jtbi.2015.03.021) - DOI - PMC - PubMed

LinkOut - more resources