

Optimization and validation of cryostat temperature conditions for trans-reflectance mode FTIR microspectroscopic imaging of biological tissues
- PMID: 28280690
- PMCID: PMC5333507
- DOI: 10.1016/j.mex.2017.01.006
Optimization and validation of cryostat temperature conditions for trans-reflectance mode FTIR microspectroscopic imaging of biological tissues
Abstract
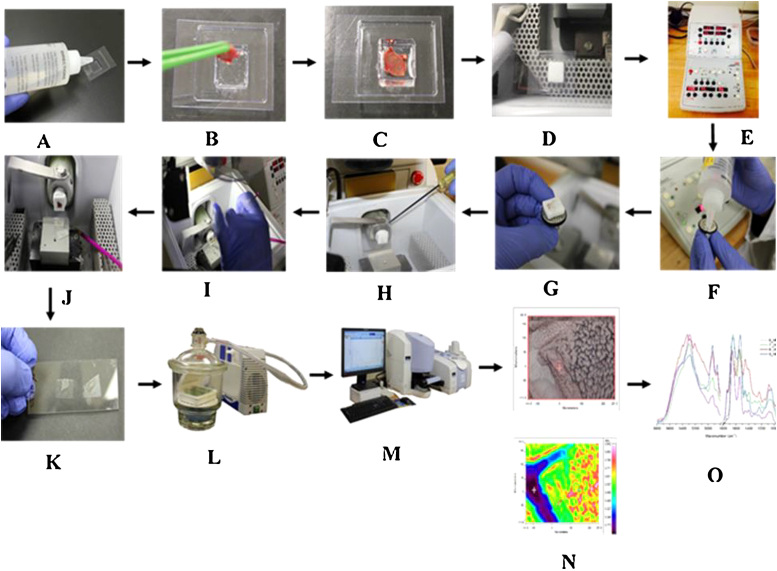
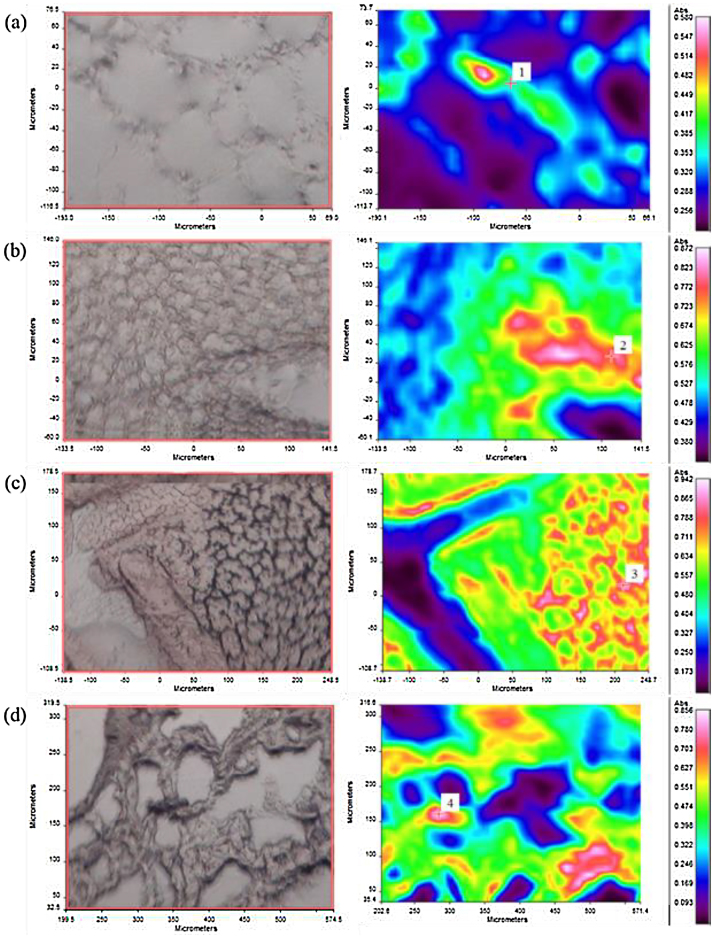
In Fourier transform infrared (FTIR) microspectrocopy, the tissue preparation method is crucial, especially how the tissue is cryo-sectioned prior to the imaging requires special consideration. Having a temperature difference between the cutting blade and the specimen holder of the cryostat greatly affects the quality of the sections. Therefore, we have developed an optimal protocol for cryo-sectioning of biological tissues by varying the temperature of both the cutting blade and the specimen holder. Using this protocol, we successfully cryo-sectioned four different difficult-to-section tissues including white adipose tissue (WAT), brown adipose tissue (BAT), lung, and liver. The optimal temperatures that required to be maintained at the cutting blade and the specimen holder for the cryo-sectioning of WAT, BAT, lung, and liver are (-25, -20 °C), (-25, -20 °C), (-17, -13 °C) and (-15, -5 °C), respectively. The optimized protocol developed in this study produced high quality cryo-sections with sample thickness of 8-10 μm, as well as high quality trans-reflectance mode FTIR microspectroscopic images for the tissue sections. •Use of cryostat technique to make thin sections of biological samples for FTIR microspectroscopy imaging.•Optimized cryostat temperature conditions by varying the temperatures at the cutting blade and specimen holder to obtain high quality sections of difficult-to-handle tissues.•FTIR imaging is used to obtain chemical information from cryo-sectioned samples with no interference of the conventional paraffin-embedding agent and chemicals.
Keywords: Cryo-sectioning and FTIR microspectroscopic imaging of biological tissues; Cryostat; FTIR; Microspectroscopic imaging; Tissue sectioning.
Figures


References
-
- Stephen R.P. Springer; New York: 2010. A Practical Guide to Frozen Section Technique; pp. 1–189.
-
- Kalupahana N.S., Claycombe K., Newman S.J., Stewart T., Siriwardhana N., Matthan N., Lichtenstein A.H., Moustaid-Moussa N. Eicosapentaenoic acid prevents and reverses insulin resistance in high-fat diet-induced obese mice via modulation of adipose tissue inflammation. J. Nutr. 2010;140:1915–1922. - PubMed
-
- Kochan K., Maslak E., Chlopicki S., Baranska M. FT-IR imaging for quantitative determination of liver fat content in non-alcoholic fatty liver. Analyst. 2015;140:4997–5002. - PubMed
-
- Kucuk B.F., Garip S., Heise S., Brockmann G., Severcan F. FTIR imaging of structural changes in visceral and subcutaneous adiposity and brown to white adipocyte transdifferentiation. Analyst. 2015;140:2205–2214. - PubMed
LinkOut - more resources
Full Text Sources
Other Literature Sources
