. 2017 Feb 23:7:53.
doi: 10.3389/fcimb.2017.00053. eCollection 2017.

Aflatoxin B1 Induces Reactive Oxygen Species-Mediated Autophagy and Extracellular Trap Formation in Macrophages

Affiliations

Aflatoxin B1 Induces Reactive Oxygen Species-Mediated Autophagy and Extracellular Trap Formation in Macrophages

Yanan An et al. Front Cell Infect Microbiol. .

Abstract

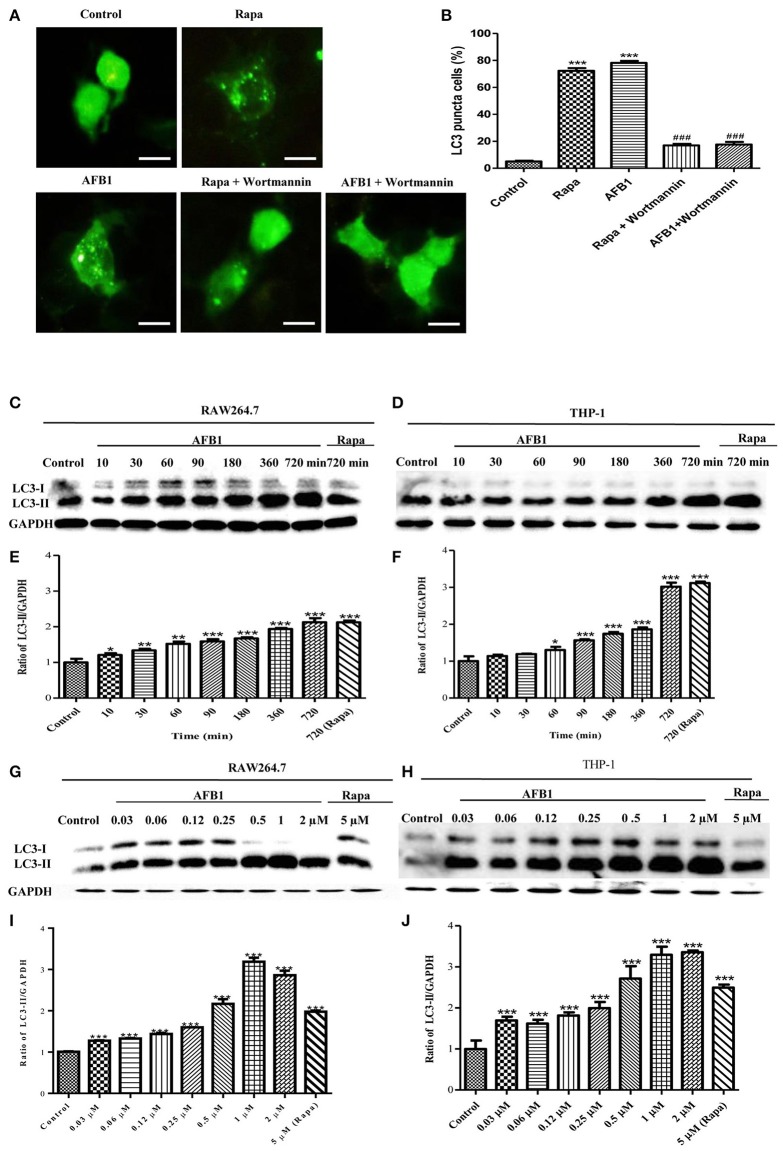
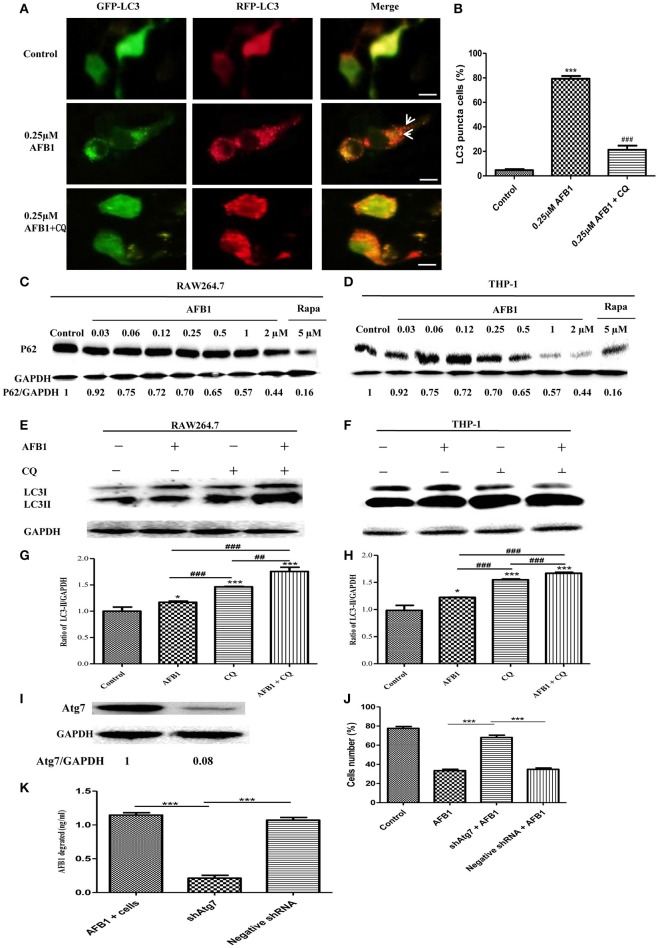
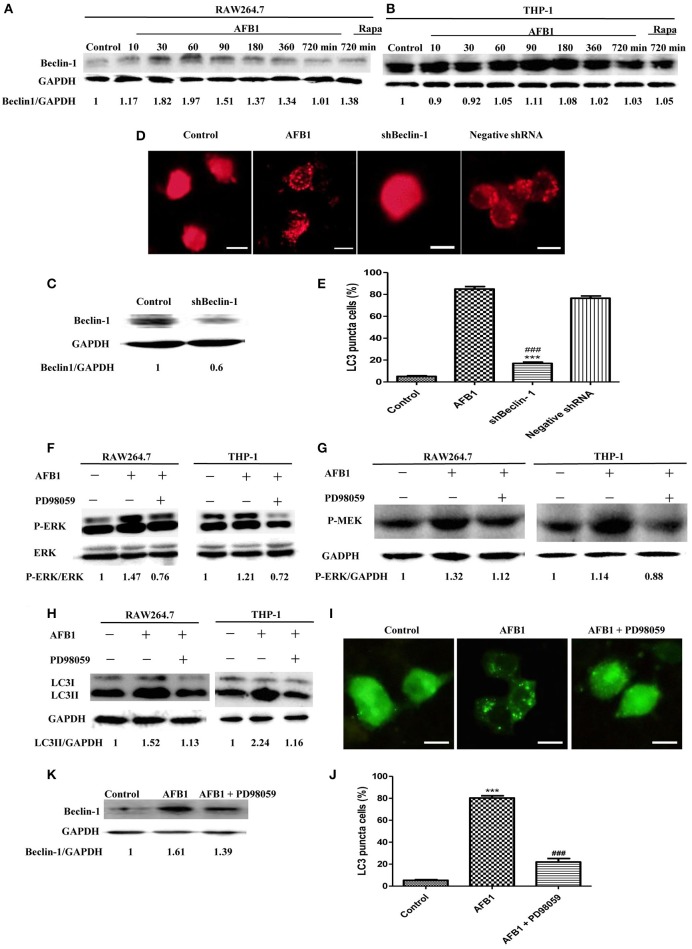
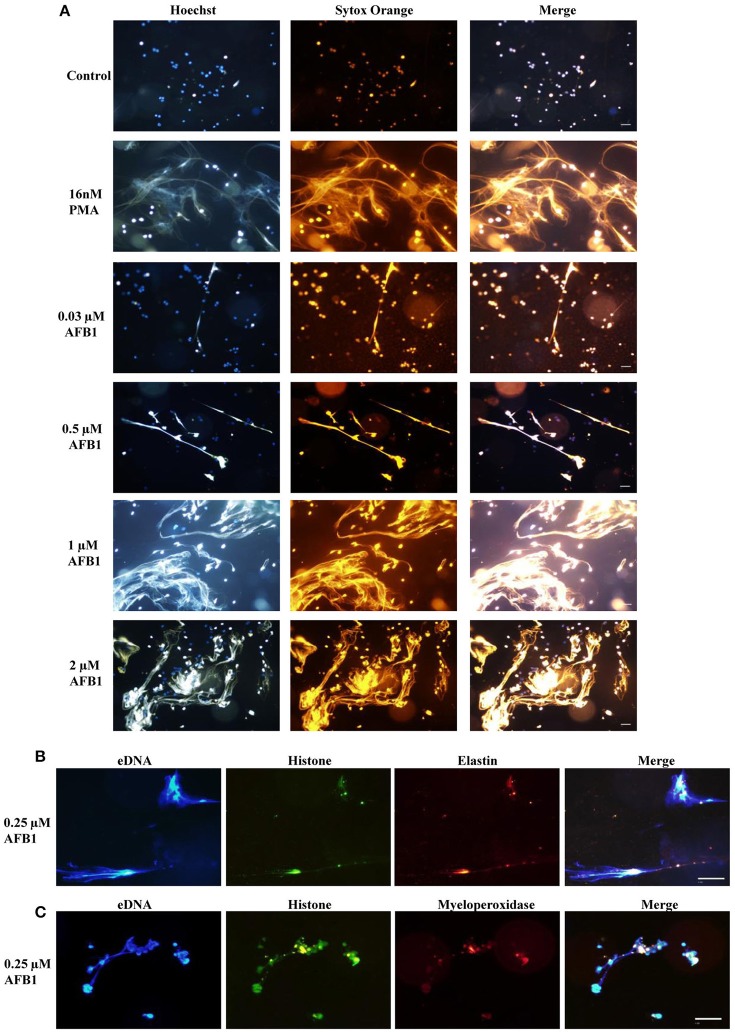
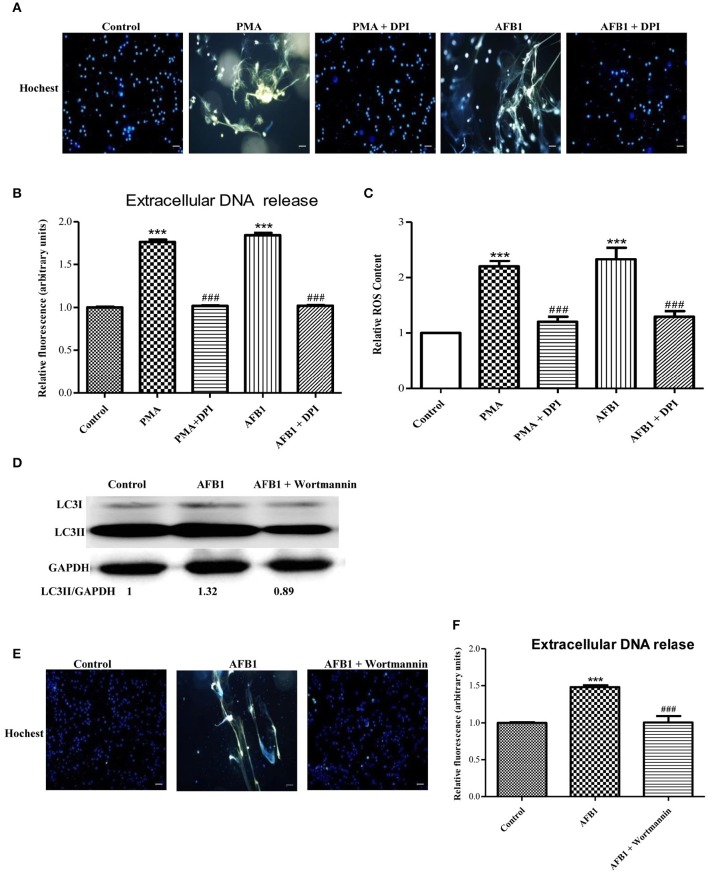
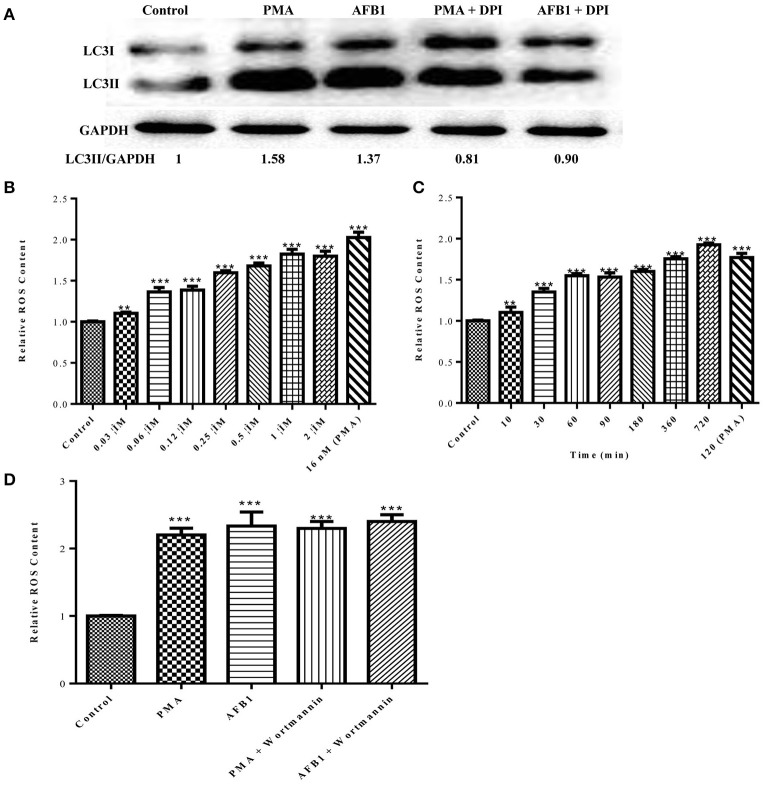
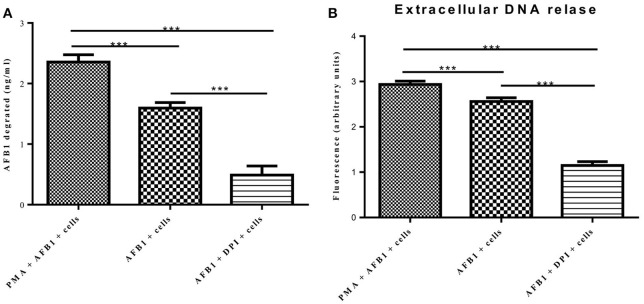
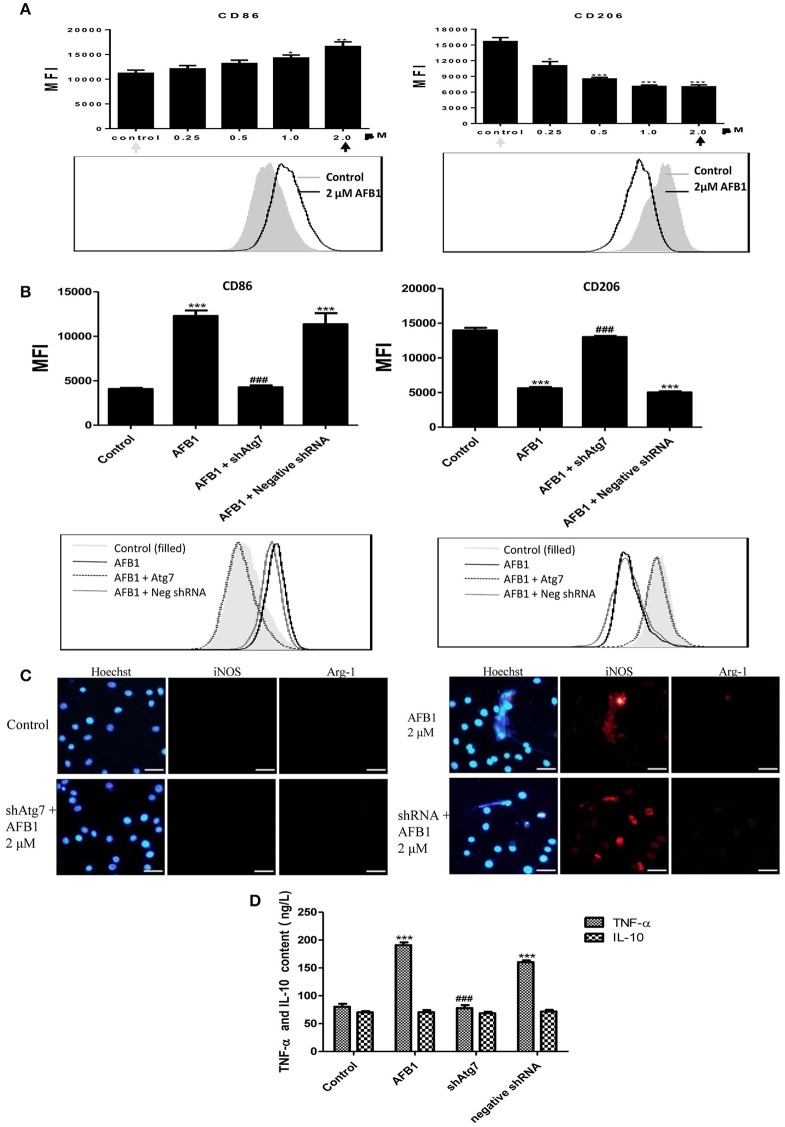
Aflatoxins are a group of highly toxic mycotoxins with high carcinogenicity that are commonly found in foods. Aflatoxin B1 (AFB1) is the most toxic member of the aflatoxin family. A recent study reported that AFB1 can induce autophagy, but whether AFB1 can induce extracellular traps (ETs) and the relationships among innate immune responses, reactive oxygen species (ROS), and autophagy and the ETs induced by AFB1 remain unknown. Here, we demonstrated that AFB1 induced a complete autophagic process in macrophages (MΦ) (THP-1 cells and RAW264.7 cells). In addition, AFB1 induced the generation of MΦ ETs (METs) in a dose-dependent manner. In particular, the formation of METs significantly reduced the AFB1 content. Further analysis using specific inhibitors showed that the inhibition of either autophagy or ROS prevented MET formation caused by AFB1, indicating that autophagy and ROS were required for AFB1-induced MET formation. The inhibition of ROS prevented autophagy, indicating that ROS generation occurred upstream of AFB1-induced autophagy. Taken together, these data suggest that AFB1 induces ROS-mediated autophagy and ETs formation and an M1 phenotype in MΦ.

Keywords: Aflatoxin B1; autophagy; extracellular traps; macrophages; reactive oxygen species.


Figures

Figure 1
Figure 1
AFB1 induced a time- and dose-dependent autophagic response. (A) RAW264.7 cells were transfected with GFP-LC3 plasmid for 12 h. The cells were pretreated with Rapa (5 μM, 12 h) and wortmannin (100 nM, 1 h) and then treated with AFB1 (0.25 μM) for 2 h. Scale bars = 20 μm. (B) The percentage of GFP-LC3 puncta cells was calculated. ***P < 0.001 compared with the control groups; ###P < 0.001 compared with Rapa and AFB1. (C,D) RAW264.7 cells and THP-1 cells were pretreated with 5 μM Rapa for 12 h and then treated with 0.25 μM AFB1 for different times. (G,H) The two cell lines were similarly treated with Rapa and subsequently exposed to different concentrations of AFB1 for 1.5 h. (E,F, I,J) Western blotting was conducted to assay the level of LC3. The ratio of LC3-II/GAPDH was calculated. *P < 0.05, **P < 0.01, ***P < 0.001 compared with the control groups in the same cell line. The data are representative of three experiments with similar results.
Figure 2
Figure 2
AFB1 induced a complete autophagic process. (A) RAW264.7 cells were transfected with tandem GFP-RFP-LC3 plasmid for 12 h. Cells were pretreated with or without CQ, followed by treatment with AFB1 (0.25 μM) for 2 h and observation by fluorescence microscopy. Scale bars = 20 μm. (B) The percentage of GFP-RFP-LC3 puncta cells was calculated. ***P < 0.001 compared with the control groups; ###P < 0.001 compared with AFB1. (C,D) RAW264.7 cells and THP-1 cells were incubated in 6-well flat-bottom plates (1 × 10⁶ cells/well) and cultured in serum-free and antibiotic-free medium for 12 h. Following treatment with Rapa (5 μM, 12 h), the cells were treated with different concentrations of AFB1 from 0.03 to 2 μM for 1.5 h. Western blotting of SQSTM1 was performed. (E,F) RAW264.7 cells and THP-1 cells were pretreated with CQ (20 μM) for 1 h and subsequently exposed to AFB1 (0.25 μM) for 1.5 h. Western blotting for LC3 was then performed. (G,H) The ratios of p62/GAPDH and LC3-II/GAPDH were calculated. *P < 0.05, ***P < 0.001 compared with the control groups of the same cell line; ##P < 0.01, ###P < 0.001. (I) Western blotting of Atg7 in RAW264.7 cells with or without knockdown treatment. (J) Cell viability was estimated using the Cell Counting Kit-8 (CCK-8) assay ***P < 0.001. (K) Non-transfected RAW264.7 cells, Atg7-silenced cells, and cells transfected with the shRNA negative control cells were incubated in 24-well plates (2 × 10⁵ cells/well) with serum-free medium for 12 h, followed by treatment with AFB1 (2 μM) for 8 h. We performed AFB1 ELISA to determine the AFB1 content using an ELISA kit. ***P < 0.001. The data are representative of three experiments with similar results.
Figure 3
Figure 3
The autophagy response induced by AFB1 was MEK/ERK-dependent and upregulated Beclin-1. (A,B) RAW264.7 cells and THP-1 cells were pretreated with Rapa (5 μM) for 12 h and then treated with AFB1 for different times. Western blotting was used for the Beclin-1 protein assay. The ratios of Beclin-1/GAPDH were calculated. (C) Western blotting of Beclin-1 in RAW264.7 cells with or without knockdown treatment was conducted. (D) RAW264.7 cells were transfected with the RFP-LC3 plasmid for 12 h and then transfected with the shRNA negative control or shBeclin-1 plasmids for 48 h before the cells were infected with AFB1 (0.25 μM) for 2 h. Fluorescence images show the induction of LC3 puncta. Scale bars = 20 μm. (E) The percentage of RFP-LC3 puncta cells was calculated. ***P < 0.001 compared with AFB1-infected cells; ###P < 0.001 compared with negative control shRNA plasmid. (F–H) RAW264.7 cells and THP-1 cells were pre-treated with the MEK/ERK inhibitor PD98059 (20 μM) for 1 h and then treated with AFB1 (0.25 μM) for P-ERK, P-MEK, and LC3 protein assays. (I) RAW264.7 cells were transfected with GFP-LC3 plasmid for 12 h. The cells were pretreated with PD98059 (20 μM, 1 h) and then treated with AFB1 (0.25 μM) for 2 h. Scale bars = 20 μm. (J) The percentage of GFP-LC3 puncta cells was calculated. ***P < 0.001 compared with the control groups; ###P < 0.001 compared with AFB1. (K) Western blotting of Beclin-1 was performed after treatment with PD98059 (20 μM, 1 h) and AFB1 (0.25 μM).
Figure 4
Figure 4
AFB1 induced the generation of METs. (A) THP-1 cells were incubated in 24-well glass-bottom plates (2 × 10⁵ cells/well) with serum-free RPMI 1640 for 12 h. Cells were treated with PMA (16 nM) and AFB1 (2 μM) at concentrations of 0.03, 0.12, 0.5, or 2 μM for 2 h. METs were stained with SYTOX Orange (5 mM) for 10 min, and nuclei were stained with Hoechst 33342 (1 μM) for 5 min. (B) Histone, elastin, and eDNA colocalized. (C) Histone, myeloperoxidase, and eDNA colocalized. The images were obtained by fluorescence microscopy with a 20 × objective lens. Scale bars = 50 μm.
Figure 5
Figure 5
Autophagy and ROS are required for AFB1-induced MET formation. (A) THP-1 cells were pre-treated with the NOX2 inhibitor DPI (50 μM) for 1 h then, PMA (16 nM) and AFB1 (0.25 μM) were added to the cells for 2 h. The cells were stained with Hoechst 33342 (1 μM) and then observed by fluorescence microscopy with a 20 × objective lens. Scale bars = 50 μm. (B) The fluorescence intensity of extracellular DNA was detected by a plate reader. (C) For the quantification of cytosolic ROS, THP-1 cells were incubated in 24-well plates (2 × 10⁵ cells/well), pre-treated with DPI (50 μM) for 1 h and then treated with PMA (16 nM) and AFB1 (0.25 μM). Cytosolic ROS were labeled by DHR 123 (1 μM) and detected by a plate reader. The data were analyzed by Graphpad prism software (GraphPad, San Diego). ***P < 0.001 compared with the control groups in the same cell line; ###P < 0.001 compared with the PMA and AFB1. The data are representative of three experiments with similar results. (D) THP-1 cells were cultured in serum-free and antibiotic-free medium for 12 h. Then, cells were pretreated with wortmannin (100 nM) for 1 h followed by AFB1 (0.25 μM) for 1.5 h. Western blotting of LC3 was performed. (E) THP-1 cells were pre-treated with the autophagy inhibitor wortmannin (100 nM) for 1 h, and then AFB1 (0.25 μM) was added to the cells for 2 h. The cells were stained with Hoechst 33342 (1 μM) and then observed by fluorescence microscopy with a 20 × objective lens. Scale bars = 50 μm. (F) The fluorescence intensity of extracellular DNA was detected by a plate reader ***P < 0.001 compared with the control groups; ###P < 0.001 compared with the AFB1.
Figure 6
Figure 6
ROS generation is required for the activation of AFB1-induced autophagy. (A) RAW264.7 cells were pre-treated with the NOX2 inhibitor DPI (50 μM) for 1 h. PMA (16 nM) and AFB1 (0.25 μM) were then added to the cells for 2 h and western blotting of LC3 was performed. (B,C) RAW264.7 cells were treated with AFB1 at different concentrations and times. Cytosolic ROS were labeled by DHR 123 (1 μM) and were detected by a plate reader, **P < 0.01, ***P < 0.001 compared with the control groups in the same cell line. (D) Cells were pretreated with wortmannin (100 nM, 1 h) after treatment with AFB1 (0.25 μM) and PMA (16 nM) for 2 h. Cytosolic ROS were detected by a plate reader, ***P < 0.001 compared with the control groups in the same cell line.
Figure 7
Figure 7
METs formation reduced the AFB1 content. (A) RAW264.7 cells were incubated in 24-well plates (2 × 10⁵ cells/well) with serum-free medium for 12 h. Only one of the wells was pretreated with DPI (50 μM) for 1 h, and then CytD was added to all of wells for 20 min, followed by treatment with AFB1 (2 μM) or PMA (16 nM) and AFB1 (2 μM) for 8 h. We used the AFB1 ELISA to determine the AFB1 content through an ELISA kit. The cells were treated with AFB1 with or without PMA, or AFB1 with or without DPI. *P < 0.05, **P < 0.01, ***P < 0.001 compared with the control groups (only cells) in the same cell line. The data are representative of three experiments with similar results. (B) The fluorescence intensity of Extracellular DNA was detected by a plate reader. The data are representative of three experiments with similar results.
Figure 8
Figure 8
AFB1 induced M1-like polarization in RAW264.7 cells. (A) The expression levels of CD86 and CD206 in RAW264.7 cells were detected by flow cytometry. The results are presented as the mean fluorescence intensity (MFI). ***P < 0.001 compared with the control groups of RAW264.7 cells. The data are representative of three experiments with similar results. The histogram figure represents the comparison of the 2 μM AFB1-treated group and control group. (B) CD86 and CD206 in RAW264.7 cells, Atg7-silenced cells and cells transfected with the shRNA negative control were detected by flow cytometry. The results are presented as the mean fluorescence intensity (MFI). ***P < 0.001 compared with the control groups of RAW264.7 cells; ###P < 0.001 compared with AFB1-infected cells and cells transfected with the negative control shRNA plasmid. The histogram figure represents the comparison of the 2 μM AFB1-treated group, Atg7-silenced cells, cells transfected with the shRNA negative control and control group. (C) iNOS, Arg-1 and eDNA colocalized, and the immunofluorescence staining shows the comparison of the 2 μM AFB1-treated Non-transfected cell group, Atg7-silenced cell group, cells transfected with the shRNA negative control group and control group. (D) TNF-α and IL-10 secretion was measured by ELISA. ***P < 0.001 compared with the control group; ###P < 0.001 compared with the AFB1-infected cells and cells transfected with the negative control shRNA plasmid.

References

    1. Aulik N. A., Hellenbrand K. M., Czuprynski C. J. (2012). Mannheimia haemolytica and its leukotoxin cause macrophage extracellular trap formation by bovine macrophages. Infect. Immun. 80, 1923–1933. 10.1128/IAI.06120-11 - DOI - PMC - PubMed
    1. Ben-Mordechai T., Palevski D., Glucksam-Galnoy Y., Elron-Gross I., Margalit R., Leor J. (2015). Targeting macrophage subsets for infarct repair. J. Cardiovasc. Pharmacol. Ther. 20, 36–51. 10.1177/1074248414534916 - DOI - PubMed
    1. Bianco G., Russo R., Marzocco S., Velotto S., Autore G., Severino L. (2012). Modulation of macrophage activity by aflatoxins B1 and B2 and their metabolites aflatoxins M1 and M2. Toxicon 59, 644–650. 10.1016/j.toxicon.2012.02.010 - DOI - PubMed
    1. Biswas S. K., Chittezhath M., Shalova I. N., Lim J. Y. (2012). Macrophage polarization and plasticity in health and disease. Immunol. Res. 53, 11–24. 10.1007/s12026-012-8291-9 - DOI - PubMed
    1. Brinkmann V., Reichard U., Goosmann C., Fauler B., Uhlemann Y., Weiss D. S., et al. (2004). Neutrophil extracellular traps kill bacteria. Science 303, 1532–1535. 10.1126/science.1092385 - DOI - PubMed

Publication types

LinkOut - more resources