

3D Clumped Cell Segmentation Using Curvature Based Seeded Watershed
- PMID: 28280723
- PMCID: PMC5340274
- DOI: 10.3390/jimaging2040031
3D Clumped Cell Segmentation Using Curvature Based Seeded Watershed
Abstract
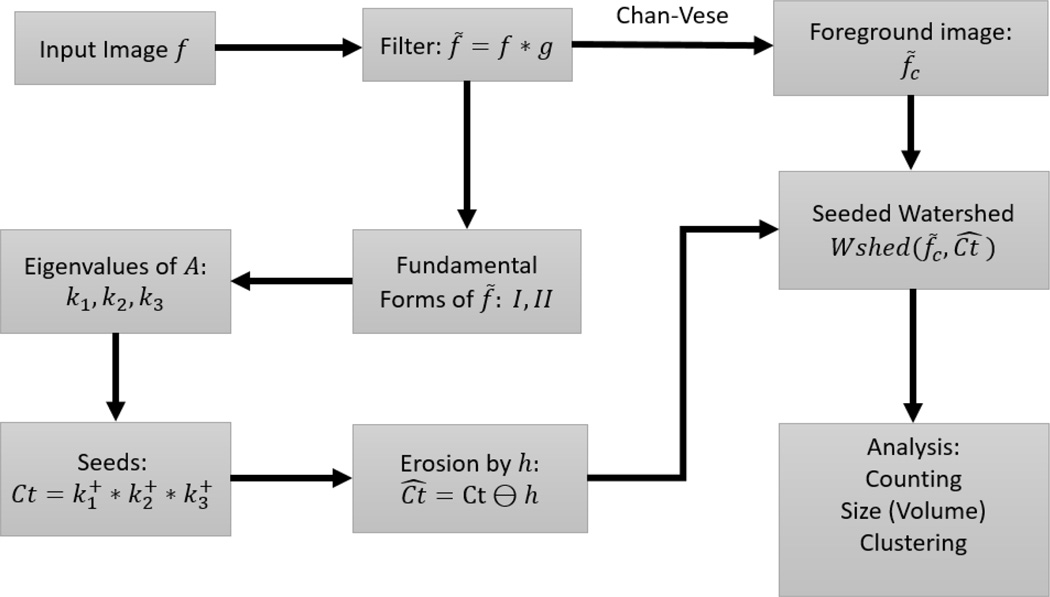
Image segmentation is an important process that separates objects from the background and also from each other. Applied to cells, the results can be used for cell counting which is very important in medical diagnosis and treatment, and biological research that is often used by scientists and medical practitioners. Segmenting 3D confocal microscopy images containing cells of different shapes and sizes is still challenging as the nuclei are closely packed. The watershed transform provides an efficient tool in segmenting such nuclei provided a reasonable set of markers can be found in the image. In the presence of low-contrast variation or excessive noise in the given image, the watershed transform leads to over-segmentation (a single object is overly split into multiple objects). The traditional watershed uses the local minima of the input image and will characteristically find multiple minima in one object unless they are specified (marker-controlled watershed). An alternative to using the local minima is by a supervised technique called seeded watershed, which supplies single seeds to replace the minima for the objects. Consequently, the accuracy of a seeded watershed algorithm relies on the accuracy of the predefined seeds. In this paper, we present a segmentation approach based on the geometric morphological properties of the 'landscape' using curvatures. The curvatures are computed as the eigenvalues of the Shape matrix, producing accurate seeds that also inherit the original shape of their respective cells. We compare with some popular approaches and show the advantage of the proposed method.
Keywords: Gaussian curvature; Weingarten map; catchment basin; manifold; mean curvature; shape operator; topographic distance; watershed; watershed transform.
Conflict of interest statement
Conflicts of Interest: The authors declare no conflict of interest.
Figures


Similar articles
-
Marker-controlled watershed with deep edge emphasis and optimized H-minima transform for automatic segmentation of densely cultivated 3D cell nuclei.BMC Bioinformatics. 2022 Jul 21;23(1):289. doi: 10.1186/s12859-022-04827-3. BMC Bioinformatics. 2022. PMID: 35864453 Free PMC article.
-
Application of an improved watershed algorithm based on distance map reconstruction in bean image segmentation.Heliyon. 2023 Apr 15;9(4):e15097. doi: 10.1016/j.heliyon.2023.e15097. eCollection 2023 Apr. Heliyon. 2023. PMID: 37128352 Free PMC article.
-
Classification-driven watershed segmentation.IEEE Trans Image Process. 2007 May;16(5):1437-45. doi: 10.1109/tip.2007.894239. IEEE Trans Image Process. 2007. PMID: 17491471
-
Marker-based watershed transform method for fully automatic mandibular segmentation from CBCT images.Dentomaxillofac Radiol. 2019 Feb;48(2):20180261. doi: 10.1259/dmfr.20180261. Epub 2018 Nov 9. Dentomaxillofac Radiol. 2019. PMID: 30379569 Free PMC article.
-
A Review of Watershed Implementations for Segmentation of Volumetric Images.J Imaging. 2022 Apr 26;8(5):127. doi: 10.3390/jimaging8050127. J Imaging. 2022. PMID: 35621890 Free PMC article. Review.
Cited by
-
Chemical and mechanical patterning of tortoise skin scales occur in different regions of the head.iScience. 2025 Jun 4;28(6):112684. doi: 10.1016/j.isci.2025.112684. eCollection 2025 Jun 20. iScience. 2025. PMID: 40612900 Free PMC article.
-
DeepSeeded: Volumetric Segmentation of Dense Cell Populations with a Cascade of Deep Neural Networks in Bacterial Biofilm Applications.Expert Syst Appl. 2024 Mar 15;238(Pt D):122094. doi: 10.1016/j.eswa.2023.122094. Epub 2023 Oct 14. Expert Syst Appl. 2024. PMID: 38646063 Free PMC article.
-
A new machine learning approach for predicting likelihood of recurrence following ablation for atrial fibrillation from CT.BMC Med Imaging. 2021 Mar 9;21(1):45. doi: 10.1186/s12880-021-00578-4. BMC Med Imaging. 2021. PMID: 33750343 Free PMC article.
-
Improved Quantification of Cell Density in the Arterial Wall-A Novel Nucleus Splitting Approach Applied to 3D Two-Photon Laser-Scanning Microscopy.Front Physiol. 2022 Jan 12;12:814434. doi: 10.3389/fphys.2021.814434. eCollection 2021. Front Physiol. 2022. PMID: 35095571 Free PMC article.
-
Graph-Theoretic Post-Processing of Segmentation With Application to Dense Biofilms.IEEE Trans Image Process. 2021;30:8580-8594. doi: 10.1109/TIP.2021.3116792. Epub 2021 Oct 15. IEEE Trans Image Process. 2021. PMID: 34613914 Free PMC article.
References
-
- Guan BX, Bhanu B, Thakoor N, Talbot P, Lin S. Automatic cell region detection by k-means with weighted entropy. Proceedings of the 2013 IEEE 10th International Symposium on Biomedical Imaging (ISBI); 7–11 April 2013; San Francisco, CA, USA. pp. 418–421.
-
- Pal SK, Ghosh A, Shankar BU. Segmentation of remotely sensed images with fuzzy thresholding, and quantitative evaluation. Int. J. Remote Sens. 2000;21:2269–2300.
-
- Chan TF, Vese LA. Active Contours without Edges. IEEE Trans. Image Process. 2001;10:266–277. - PubMed
-
- Zimmer C, Labruyere E, Meas-Yedid V, Guillen N, Olivo-Marin JC. Improving Active Contours for Segmentation and Tracking of Motile Cells in Videomicroscopy. Proceedings of the 16th International Conference on Pattern Recognition (ICPR); 11–15 August 2002; Quebec City, QC, Canada. pp. 286–289.
Grants and funding
LinkOut - more resources
Full Text Sources
Other Literature Sources
