

Proteomic Analysis of Host Cell Protein Dynamics in the Culture Supernatants of Antibody-Producing CHO Cells
- PMID: 28281648
- PMCID: PMC5345005
- DOI: 10.1038/srep44246
Proteomic Analysis of Host Cell Protein Dynamics in the Culture Supernatants of Antibody-Producing CHO Cells
Abstract
Chinese hamster ovary (CHO) cells are the most common cell line used for the production of therapeutic proteins including monoclonal antibodies (mAbs). Host cell proteins (HCPs), secreted and released from lysed cells, accumulate extracellularly during the cultures of recombinant CHO (rCHO) cells, potentially impairing product quality. In an effort to maintain good mAb quality during the cultures, HCPs accumulated extracellularly in batch and fed-batch cultures of a mAb-producing rCHO cell line were identified and quantified by nanoflow liquid chromatography-tandem mass spectrometry, followed by their gene ontology and functional analysis. Due to higher cell concentration and longer culture duration, more HCPs were identified and quantitated in fed-batch culture (2145 proteins identified and 1673 proteins quantified) than in batch culture (1934 proteins identified and 1486 proteins quantified). Clustering analysis of HCPs showed that the concentration profiles of HCPs affecting mAb quality (Lgmn, Ctsd, Gbl1, and B4galt1) correlated with changes in mAb quality attributes such as aggregation, charge variants, and N-glycosylation during the cultures. Taken together, the dataset of HCPs obtained in this study provides insights into determining the appropriate target proteins to be removed during both the cultures and purification steps for ensuring good mAb quality.
Conflict of interest statement
The authors declare no competing financial interests.
Figures
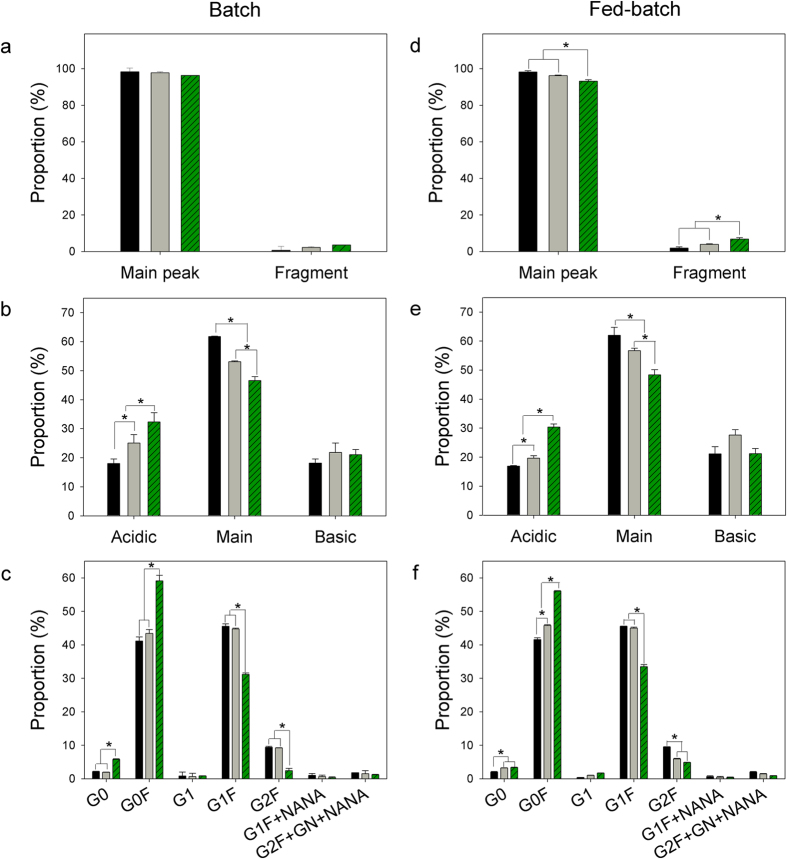
 ), and day 8 (
 ) in batch culture. Day 3 (◾), day 8 (
 ), and day 12 (
 ) in fed-batch culture. G0, agalactosylated glycan without fucose; G0F, agalactosylated glycan with fucose; G1, monogalactosylated glycan without fucose; G1F, monogalactosylated glycan with fucose; G2F, digalactosylated glycan with fucose; G1F + NANA, monogalactosylated glycan with N-acetylneuramic acid; G2F + GN + NANA, digalactosylated glycan with N-acetylglucosamine and N-acetylneuramic acid.
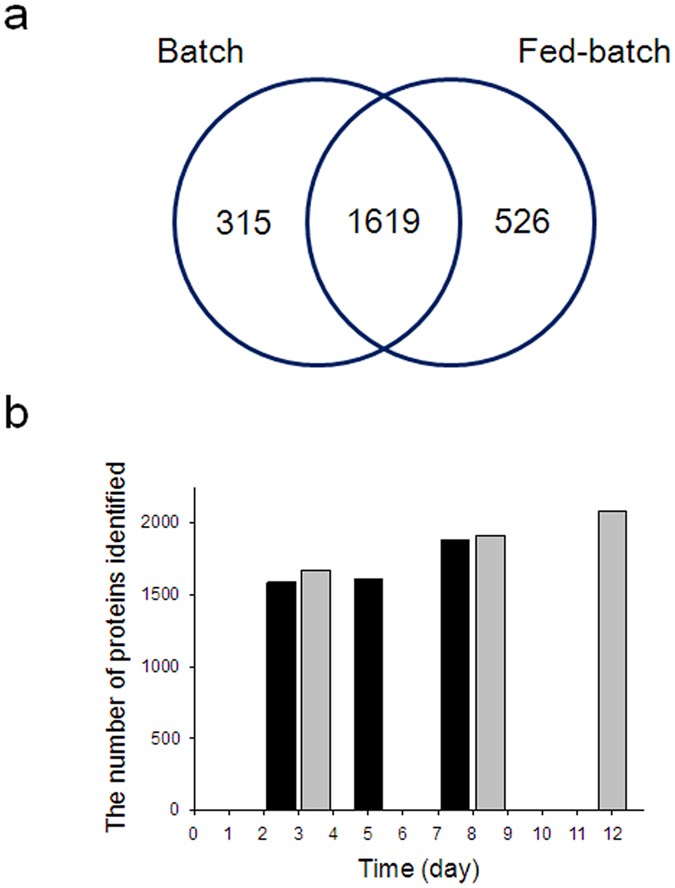
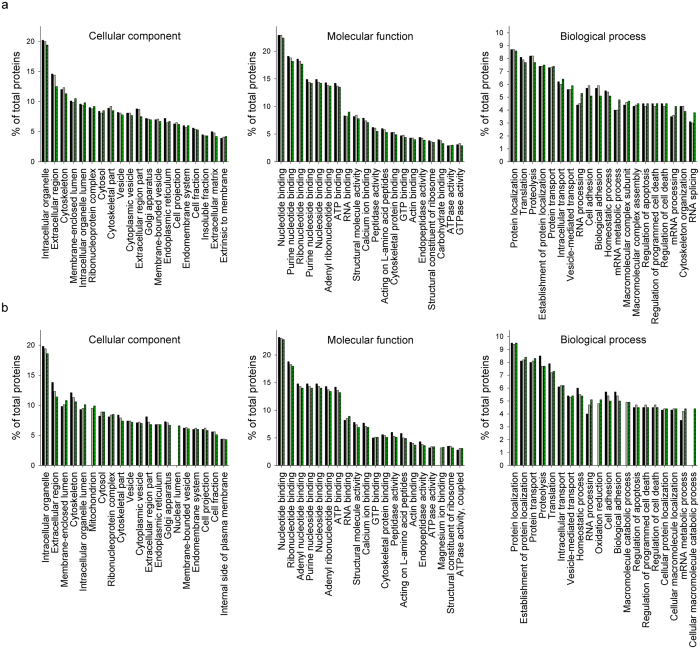
 ), and day 8 (
 ). (b) GO terms of the 1171 identified HCPs during fed-batch culture; day 3 (◾), day 8 (
 ), and day 12 (
 ).
).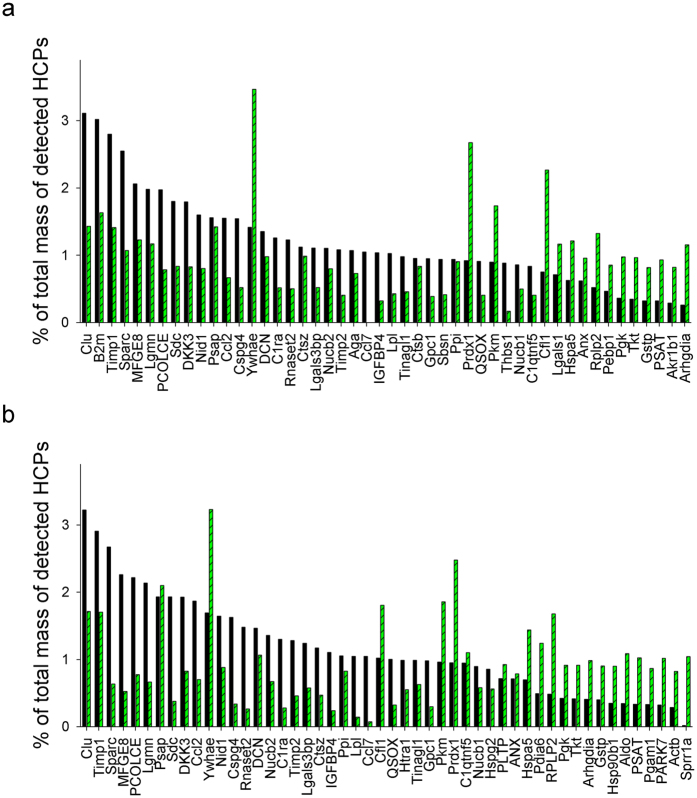
 ) in batch culture. (b) Top 30 most abundant HCPs in culture supernatants sampled on day 3 (◾) and day 12 (
 ) in fed-batch culture. The top 30 most abundant HCPs in the culture supernatants sampled in the exponential growth phase were plotted as % of total mass of detected HCPs in descending order.
 ). (b) GO terms of the top 30 most abundant HCPs during fed-batch culture; day 3 (◾) and day 12 (
 ).
).
References
-
- Chon J. H. & Zarbis-Papastoitsis G. Advances in the production and downstream processing of antibodies. Nat. Biotechnol. 28(5), 458–463 (2011). - PubMed
-
- Huang Y. M. et al. Maximizing productivity of CHO cell-based fed-batch culture using chemically defined media conditions and typical manufacturing equipment. Biotechnol. Prog. 26(5), 1400–1410 (2010). - PubMed
Publication types
MeSH terms
Substances
LinkOut - more resources
Full Text Sources
Other Literature Sources
Miscellaneous
