. 2017 Mar 10:7:44386.
doi: 10.1038/srep44386.

Visualising recalcitrance by colocalisation of cellulase, lignin and cellulose in pretreated pine biomass using fluorescence microscopy

Visualising recalcitrance by colocalisation of cellulase, lignin and cellulose in pretreated pine biomass using fluorescence microscopy

Lloyd Donaldson et al. Sci Rep. .

Abstract

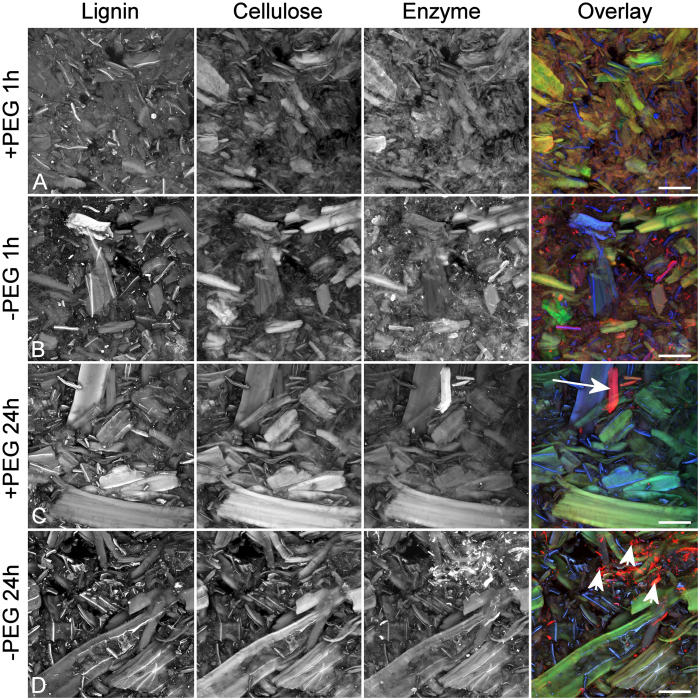
Mapping the location of bound cellulase enzymes provides information on the micro-scale distribution of amenable and recalcitrant sites in pretreated woody biomass for biofuel applications. The interaction of a fluorescently labelled cellulase enzyme cocktail with steam-exploded pine (SEW) was quantified using confocal microscopy. The spatial distribution of Dylight labelled cellulase was quantified relative to lignin (autofluorescence) and cellulose (Congo red staining) by measuring their colocalisation using Pearson correlations. Correlations were greater in cellulose-rich secondary cell walls compared to lignin-rich middle lamella but with significant variations among individual biomass particles. The distribution of cellulose in the pretreated biomass accounted for 30% of the variation in the distribution of enzyme after correcting for the correlation between lignin and cellulose. For the first time, colocalisation analysis was able to quantify the spatial distribution of amenable and recalcitrant sites in relation to the histochemistry of cellulose and lignin. This study will contribute to understanding the role of pretreatment in enzymatic hydrolysis of recalcitrant softwood biomass.


Conflict of interest statement

The authors declare no competing financial interests.

Figures

Figure 1
Figure 1
Control images for SEW (A), SEW + Congo red (CR, cellulose) (B), and SEW + Congo red + Dylight (Dy, enzyme) (C) at constant gain demonstrating the lack of bleed through as a result of sequential excitation. These images confirm that lignin autofluorescence does not contribute significantly to cellulose or enzyme detection due to the greater brightness of these components. Scale bar = 50 μm.
Figure 2
Figure 2
Component images for different combinations of PEG additive and time (AD) and their overlay images demonstrate the heterogeneity of the pretreated biomass but with no obvious visual difference among treatments. Blue = lignin, green = cellulose, red = enzyme. Some highly amenable fibres with strong binding to labelled enzyme may be unlignified parenchyma cell walls originating from resin canals or rays (long arrow). Enzyme aggregates associated with fines are also present (short arrows). Scale bar = 50 μm.
Figure 3
Figure 3. Average correlation coefficients demonstrate the difference in component associations with treatment time and presence or absence of PEG additive.
The main experimental effect is the reduced correlation between cellulose and enzyme in the absence of PEG for the 1 h treatment. The correlation between lignin and cellulose remains constant among treatments. Projections (A) show similar trends to image sequences (B) whereas partial correlations (C) indicate that most of the lignin–enzyme association is accounted for by the cellulose–lignin association in secondary cell walls. Error bars represent 95% confidence intervals.
Figure 4
Figure 4. Average frequency scatter plots for lignin, cellulose and enzyme intensity demonstrate the pattern of component association with intensity.
The enzyme shows a moderate linear correlation with cellulose (A) although this is notably weaker in the 1 h -PEG treatment. The scatterplots of enzyme vs lignin (B) show a more divergent pattern with low overall correlation. The correlation is reduced because there are two distinct associations. Low lignin points (1) represent secondary cell wall rich in cellulose and with higher affinity for the enzyme, while high lignin points (2) represent middle lamella with low cellulose and with weak affinity for the enzyme showing random scatter. The later may represent non-productive binding of the enzyme to lignin. Scatterplots show a moderate correlation of lignin and cellulose (C) which does not change with treatment. The intensity scale is 0–255 grey levels with an arbitrary frequency scale from lowest (black) to highest (red). Intensity has been thresholded at 10 grey levels.
Figure 5
Figure 5. Overlay images show the distribution of enzyme on pretreated fibre.
Example images showing details of colocalisation. Blue = lignin, green = cellulose, red = enzyme. (A) Blue structures (arrows) are highly lignified middle lamella fragments (short arrow) and a compression wood fibre (long arrow) identified by its increased lignin fluorescence and helical cavities (arrow). (B) Highly fibrillated fibre fragments show a strong affinity for labelled enzyme (arrows) while the highly lignified middle lamella forms a coating on some fibres with low enzyme affinity (asterisk). (A,B) Scale bar = 50 μm. (C) Maximum intensity projection of enzyme aggregation (arrow). (D) A surface rendered view of enzyme aggregation using depth shading. The surface rendered projection clearly shows the association between the enzyme aggregation and adjacent fines (arrow). (C,D) Scale bar = 20 μm.
Figure 6
Figure 6. Comparison of labelled enzyme interactions with holocellulose, wood and lignin substrates demonstrates different types of component interactions.
(A) In pine holocellulose, labelled enzyme (red) interacts strongly with the primary cell wall on the surface of tracheids especially at the pit border margins (arrows). (B) In SEW holocellulose, labelled enzyme interacts strongly with fines (arrows) but also infiltrates intact fibre walls. (C) In nanofibrillated cellulose, labelled enzyme interacts with most of the cellulose fibrils but infiltration is limited in larger particles. (D) In developing xylem, labelled enzyme interacts strongly with fibrillated cellulose on the lumen surface (arrow) but is excluded from most of the unlignified secondary cell wall (green) and lignified middle lamella (blue). The blue fluorescent material in the cell lumen is residual cytoplasm. (E) In wood sections, labelled enzyme shows a very weak interaction with the surface of the section in areas of cellulose-rich secondary cell wall but is excluded from the lignin-rich middle lamella (blue) (arrow). (F) Resin canal parenchyma cell walls show a strong affinity for labelled enzyme (arrow) in contrast to epithelial cell walls (EC) and ray parenchyma cell walls (RP). (G) Purified lignin autofluorescence. (H) Purified lignin (green) shows non-productive binding of labelled enzyme (red) on the surface and in cracks. Scale bars = 50 μm.

References

    1. Kamm B. & Kamm M. Biorefineries–multi-product processes. Adv. Biochem. Eng. Biotechnol. 105, 175–204 (2007). - PubMed
    1. Yang B., Dai Z., Ding S.-Y. & Wyman C. E. Enzymatic hydrolysis of cellulosic biomass. Biofuels 2, 421–450 (2011).
    1. Zhao X., Zhang L. & Liu D. Biomass recalcitrance. Part II: Fundamentals of different pretreatments to increase the enzymatic digestibility of lignocellulose. Biofuels, Bioprod. Bioref. doi: 10.1002/bbb.1350 (2012). - DOI
    1. Li J., Henriksson G. & Gellerstedt G. Lignin depolymerisation/repolymerization and its critical role for delignification of aspen wood by steam explosion. Biores. Technol. 98, 3061–3068 (2007). - PubMed
    1. Kumar P., Barrett D. M., Delwiche M. J. & Stroeve P. Methods for pretreatment of lignocellulosic biomass for efficient hydrolysis and biofuel production. Ind. Eng. Chem. Res. 48, 3713–3729 (2009).

Publication types

LinkOut - more resources