. 2017 Mar 10:6:e23013.
doi: 10.7554/eLife.23013.

Memory CD4 T cell subsets are kinetically heterogeneous and replenished from naive T cells at high levels

Affiliations

Memory CD4 T cell subsets are kinetically heterogeneous and replenished from naive T cells at high levels

Graeme Gossel et al. Elife. .

Abstract

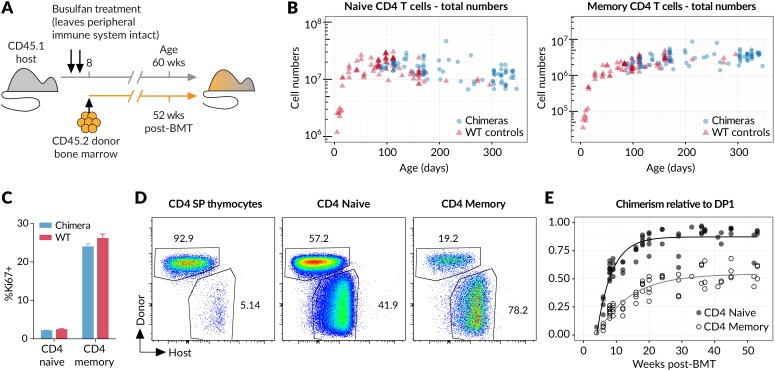
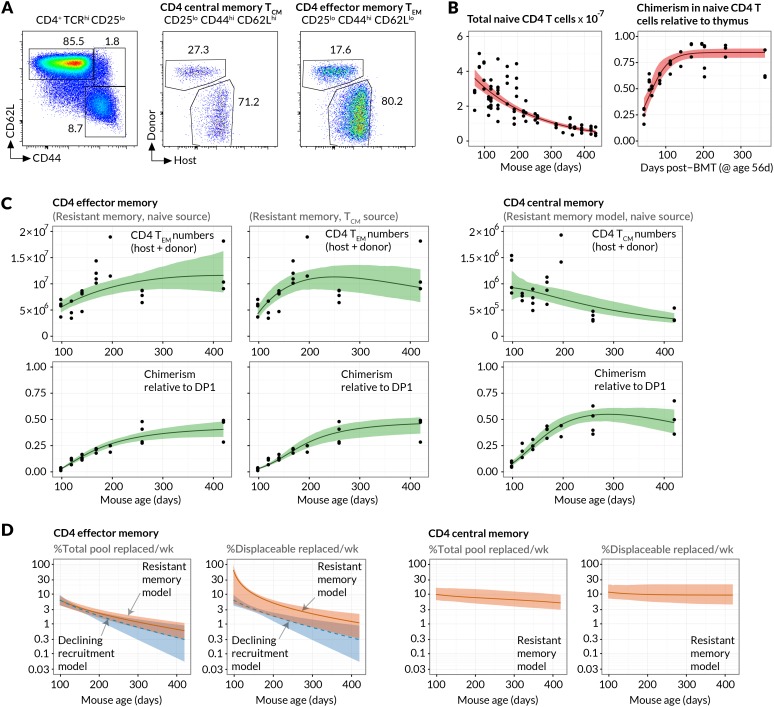
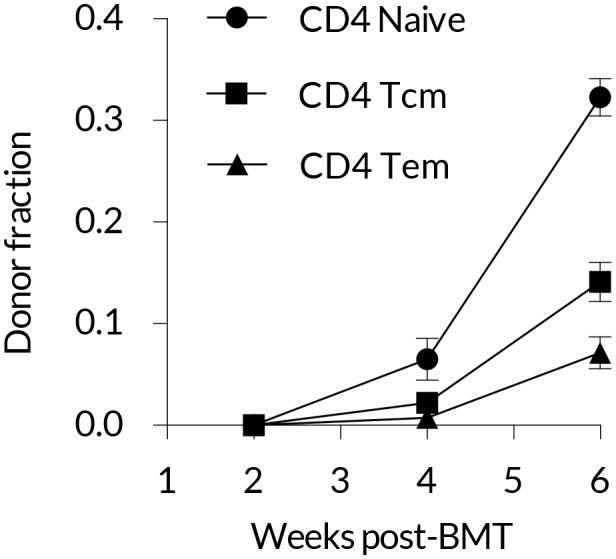
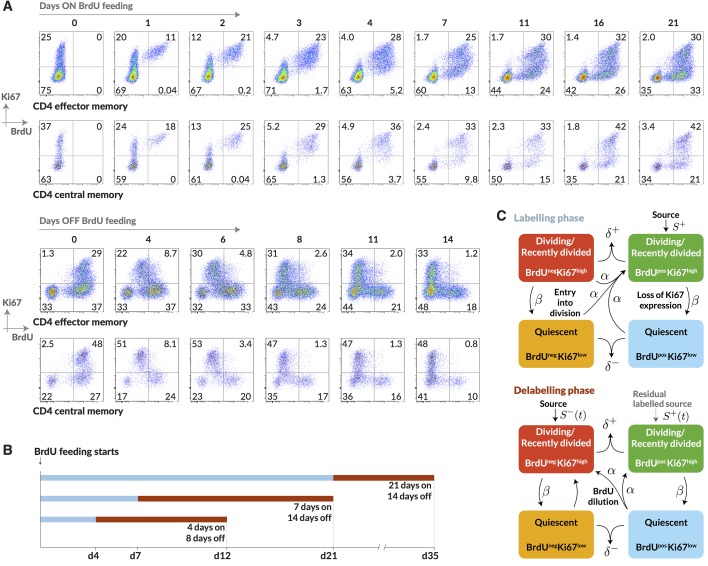
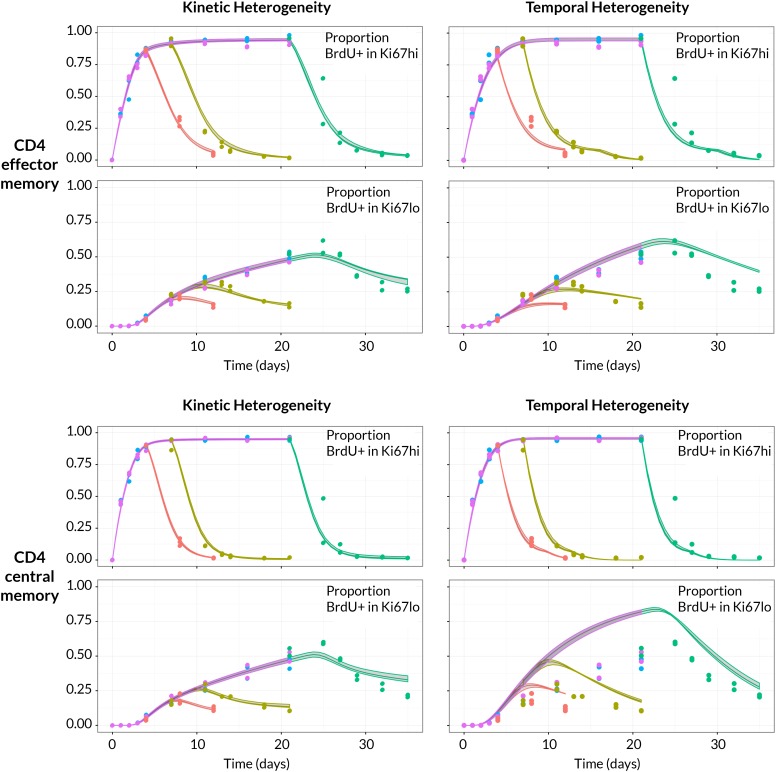
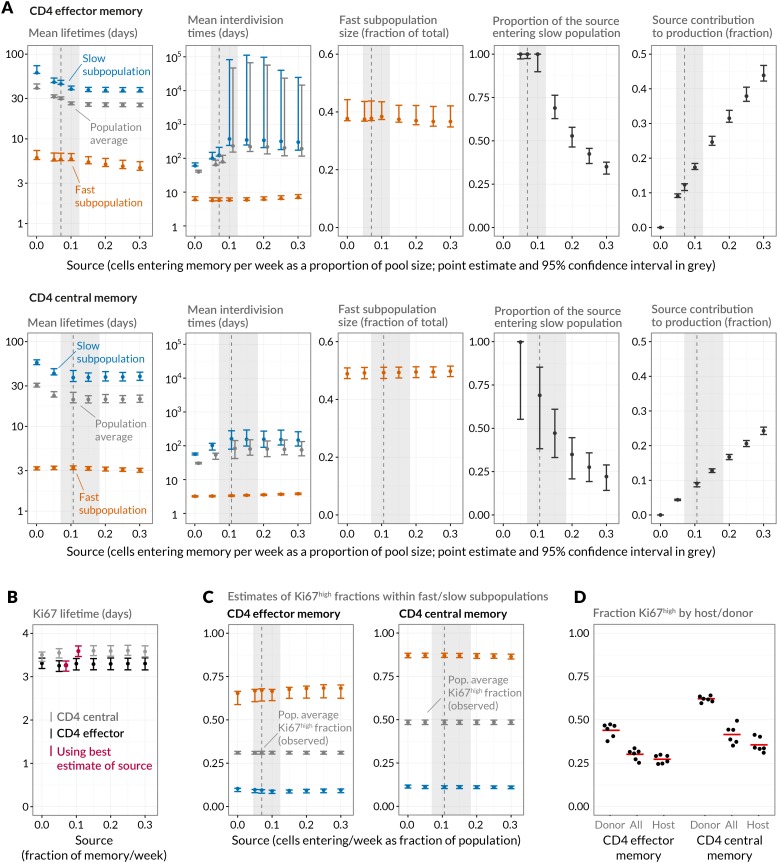
Characterising the longevity of immunological memory requires establishing the rules underlying the renewal and death of peripheral T cells. However, we lack knowledge of the population structure and how self-renewal and de novo influx contribute to the maintenance of memory compartments. Here, we characterise the kinetics and structure of murine CD4 T cell memory subsets by measuring the rates of influx of new cells and using detailed timecourses of DNA labelling that also distinguish the behaviour of recently divided and quiescent cells. We find that both effector and central memory CD4 T cells comprise subpopulations with highly divergent rates of turnover, and show that inflows of new cells sourced from the naive pool strongly impact estimates of memory cell lifetimes and division rates. We also demonstrate that the maintenance of CD4 T cell memory subsets in healthy mice is unexpectedly and strikingly reliant on this replenishment.

Keywords: BrdU labelling; Ki67; T cell homeostasis; computational biology; immunology; mathematical modelling; memory T cells; mouse; systems biology.


Conflict of interest statement

The authors declare that no competing interests exist.

Figures

Figure 1.
Figure 1.. New donor T cells differentiate into memory compartments in the absence of deliberate infection.
(A) Outline of experimental protocol. Host CD45.1 mice aged 8 weeks were treated with two doses of 10 mg/kg busulfan, followed by injection of 107 T cell-depleted bone marrow cells from CD45.2 donors. The numbers of donor and host cells in the thymus and peripheral lymphocyte compartments were evaluated by flow cytometry at various time points up to one year post bone marrow transplantation (BMT). (B) Numbers of naive and memory CD4 T cells (host + donor) recovered from spleen and lymph nodes of busulfan chimeras made at age 8 weeks, compared to numbers in WT CD45.1 controls. (C) Ki67 expression in naive and memory CD4 cells in chimeras (14 weeks post-BMT) compared to age-matched WT controls; 11 mice per group. (D) Identification of host and donor-derived cells in a representative mouse 8 weeks post-BMT. (E) Timecourses of normalised peripheral chimerism (defined as the proportion of the population that is donor-derived, divided by the proportion of the DP1 population that is donor-derived) in naive and memory CD4 T cell populations, showing steady but incomplete replacement of host cells in both. Fitted curves are empirically determined to show trends only. DOI: http://dx.doi.org/10.7554/eLife.23013.003
Figure 2.
Figure 2.. Estimating constitutive rates of generation of CD4 T cell memory.
(A) Gating strategy for CD4 central and effector memory subsets. (B) Describing the kinetics of the source. Fits of empirical descriptor functions to the timecourses of naive CD4 counts and chimerism, with 95% uncertainty envelopes (see Materials and methods). Similar curves (not shown) were used to describe CD4 TCM numbers and chimerism when modelled as the source for CD4 TEM. Estimates of the parameters defining the source functions are in Appendix 1—table 1. (C) Timecourses of total (host+donor) numbers of CD4 TCM and TEM and of chimerism, modelled from 6 weeks post-BMT (age 14 weeks/98 days). The resistant memory models with naive source described both the CD4 TCM and TEM data well (left-hand and central panels). Also shown are the statistically poorer fits to CD4 TEM kinetics using a model in which they are fed exclusively by CD4 TCM (ΔAIC = 11). Both models contained five free parameters; estimates are in Appendix 1—table 2. (D) Projections of how the rates of memory replacement change with age, assuming a naive source. Replacement is shown both as a fraction of the total pool, and as a fraction of the displaceable subset only. DOI: http://dx.doi.org/10.7554/eLife.23013.006
Figure 2—figure supplement 1.
Figure 2—figure supplement 1.. Early kinetics of peripheral replacement in busulfan chimeras made at age 8 weeks, showing that the generation of CD4 TEM cells lags that of CD4 TCM (three mice per timepoint; mean and s.e.m.).
DOI: http://dx.doi.org/10.7554/eLife.23013.009
Figure 2—figure supplement 2.
Figure 2—figure supplement 2.. Estimated sizes of memory populations resistant to displacement.
Proportions of CD4 TEM and TCM predicted to be numerically stable, self-renewing cells resistant to displacement, with age. Shaded regions indicate 95% confidence intervals. DOI: http://dx.doi.org/10.7554/eLife.23013.010
Figure 3.
Figure 3.. Quantifying the homeostatic dynamics of effector and memory CD4 T cells by combining BrdU labelling with measurements of Ki67 expression.
(A) Representative data from flow cytometric analyses of BrdU uptake and Ki67 expression in a pulse-chase experiment. Cells were recovered from lymph nodes. (B) Outline of experimental design. (C) A schematic of the core multi-compartment model used to describe the flows between the BrdU×-/+ Ki67low/high populations during and after labelling. Shown here is a model of temporal heterogeneity, in which either effector or central memory CD4 T cells are modelled as a single population entering division stochastically at per capita rate α; with quiescent (Ki67low) and recently divided (Ki67high) cells dying at rates δ- and δ+ respectively; an external source of cells feeding the BrdU± Ki67high populations at rates S+ and S-, where S++S- is a constant, S; and cells transitioning from Ki67high to Ki67low at rate β. This basic model was refined to account for multiple subpopulations (kinetic heterogeneity), different distributions of Ki67 expression times, inefficient BrdU uptake, and post-labelling dilution of BrdU within both labelled cells and within the source (S+/-(t)). See Materials and methods and Appendix 1 for details of the model formulation. DOI: http://dx.doi.org/10.7554/eLife.23013.012
Figure 4.
Figure 4.. BrdU/Ki67 dynamics in memory CD4 T cell subsets are best described by a model of kinetically distinct subpopulations.
Data and best fit predictions for two classes of model describing BrdU uptake and loss – kinetic heterogeneity (left panels) and temporal heterogeneity (right panels) – for CD4 TEM (upper panels) and CD4 TCM (lower panels). Fits were generated using the best-fit estimates of the influx into each population (for CD4 TEM, 7.0% of the pool size per week at 14 weeks of age; for CD4 TCM, 10.6% per week; these figures are 7 × the daily influx quoted in Table 1). Colours denote different BrdU feeding timecourses and shaded regions represent 95% confidence envelopes on the fits, calculated by resampling the parameters from their bootstrap distributions. The inability of the TH model to describe both the timecourses well stems from the tight coupling between the BrdU+Ki67low cells and their BrdU+Ki67high precursors, with little freedom to fit the timecourses of both simultaneously; whereas in the KH model, those two populations are enriched for the slow and fast subpopulations respectively, which are parameterised independently. DOI: http://dx.doi.org/10.7554/eLife.23013.013
Figure 5.
Figure 5.. Quantifying CD4 TEM and CD4 TCM homeostasis assuming kinetic heterogeneity.
(A) Key kinetic parameters for CD4 TEM and TCM estimated for different levels of memory influx. Grey points represent population average parameters; for interdivision times these are offset for clarity. Vertical dashed lines and shaded areas represent the best estimates of influx with 95% confidence intervals. These estimates are the weekly influxes as a fraction of the pool size (i.e., 7 × the daily influxes quoted in Table 1; 0.07 of pool/week for CD4 TEM, 0.11 for TCM). (B) Estimated mean duration of Ki67 expression post-mitosis. (C) Estimated proportions of cells that are Ki67high within fast and slow subpopulations. The weighted averages of these proportions for each of CD4 TEM and CD4 TCM were constrained to be the observed level of expression (mean + s.e.m.) averaged over the course of the BrdU labelling experiments (Appendix 1—figure 1). (D) Stratifying Ki67high expression within CD4 TEM and CD4 TCM by host and donor, in six busulfan chimeras that were 8 weeks post-BMT and of comparable ages to the mice used in the BrdU labelling experiments, indicating that fast/slow cells cannot be exclusively identified as donor/host-derived. DOI: http://dx.doi.org/10.7554/eLife.23013.016
Figure 5—figure supplement 1.
Figure 5—figure supplement 1.. Comparing mean lifetimes and interdivision times obtained with the KH model when adding temporal heterogeneity.
We fitted extensions of the basic KH model in which death rates of Ki67high cells were set to be 1/10 or 10 times that of Ki67low cells. Orange/blue denote the fast/slow subpopulations respectively. Mean lifetimes for each population (EM/CM, fast/slow) are weighted averages of the lifetimes of the Ki67high and Ki67low subsets. Vertical bars indicate 95% confidence intervals calculated by bootstrapping residuals and resampling from the bootstrap estimates of the magnitude of the source. DOI: http://dx.doi.org/10.7554/eLife.23013.018
Appendix 1—figure 1.
Appendix 1—figure 1.. Stability of cell numbers and Ki67 expression during BrdU labelling.
Cells for BrdU/Ki67 analysis were recovered from lymph nodes. We show the corresponding data for naive CD4 T cells to confirm that BrdU feeding has no significant impact on the (putative) source population. DOI: http://dx.doi.org/10.7554/eLife.23013.022
Appendix 1—figure 2.
Appendix 1—figure 2.. Comparing models of BrdU labelling with different partitionings of the influx into memory.
We compare the fits using the model presented in the text, in which the allocation of the source into fast/slow populations is a free parameter (solid lines) with a reduced model in which the source is forced to feed the fast subpopulations only (dashed lines). DOI: http://dx.doi.org/10.7554/eLife.23013.024
Author response image 1.
DOI: http://dx.doi.org/10.7554/eLife.23013.026

Comment in

  • The maths of memory.
    Borghans J, Ribeiro RM. Borghans J, et al. Elife. 2017 Apr 28;6:e26754. doi: 10.7554/eLife.26754. Elife. 2017. PMID: 28453436 Free PMC article.

Similar articles

Cited by

References

    1. Asquith B, Borghans JA, Ganusov VV, Macallan DC. Lymphocyte kinetics in health and disease. Trends in Immunology. 2009;30:182–189. doi: 10.1016/j.it.2009.01.003. - DOI - PubMed
    1. Asquith B, Debacq C, Florins A, Gillet N, Sanchez-Alcaraz T, Mosley A, Willems L. Quantifying lymphocyte kinetics in vivo using carboxyfluorescein diacetate succinimidyl ester (CFSE) Proceedings of the Royal Society B: Biological Sciences. 2006;273:1165–1171. doi: 10.1098/rspb.2005.3432. - DOI - PMC - PubMed
    1. Asquith B, Debacq C, Macallan DC, Willems L, Bangham CR. Lymphocyte kinetics: the interpretation of labelling data. Trends in Immunology. 2002;23:596–601. doi: 10.1016/S1471-4906(02)02337-2. - DOI - PubMed
    1. Beura LK, Hamilton SE, Bi K, Schenkel JM, Odumade OA, Casey KA, Thompson EA, Fraser KA, Rosato PC, Filali-Mouhim A, Sekaly RP, Jenkins MK, Vezys V, Haining WN, Jameson SC, Masopust D. Normalizing the environment recapitulates adult human immune traits in laboratory mice. Nature. 2016;532:512–516. doi: 10.1038/nature17655. - DOI - PMC - PubMed
    1. Bingaman AW, Patke DS, Mane VR, Ahmadzadeh M, Ndejembi M, Bartlett ST, Farber DL. Novel phenotypes and migratory properties distinguish memory CD4 T cell subsets in lymphoid and lung tissue. European Journal of Immunology. 2005;35:3173–3186. doi: 10.1002/eji.200526004. - DOI - PubMed

Publication types