. 2017 Mar 10;13(3):e1005248.
doi: 10.1371/journal.pcbi.1005248. eCollection 2017 Mar.

A human judgment approach to epidemiological forecasting

Affiliations

A human judgment approach to epidemiological forecasting

David C Farrow et al. PLoS Comput Biol. .

Abstract

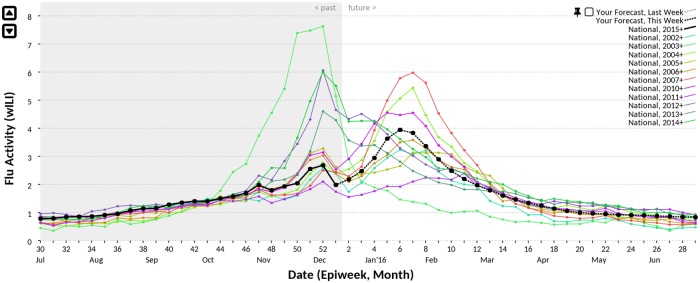
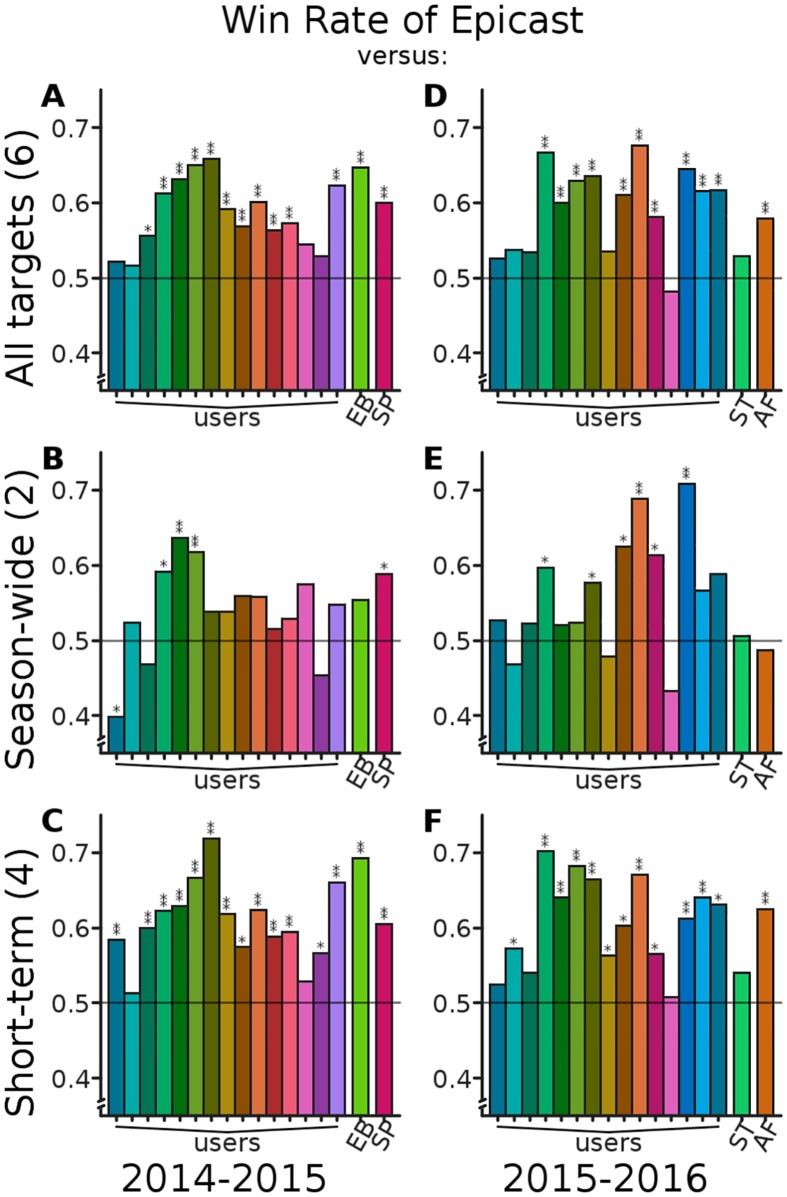
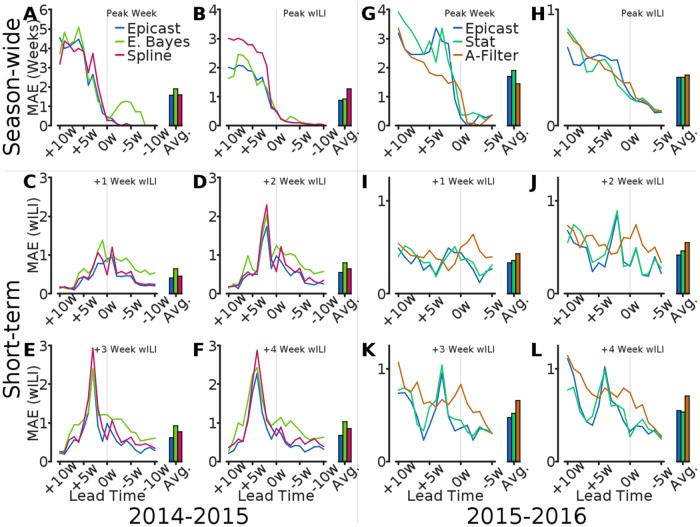
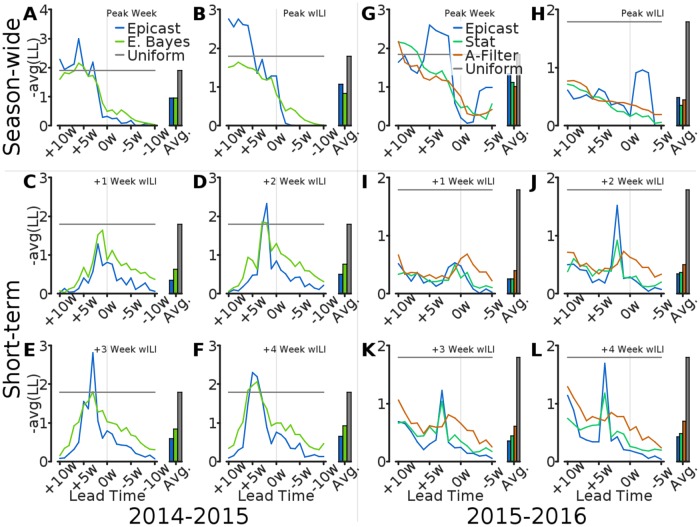
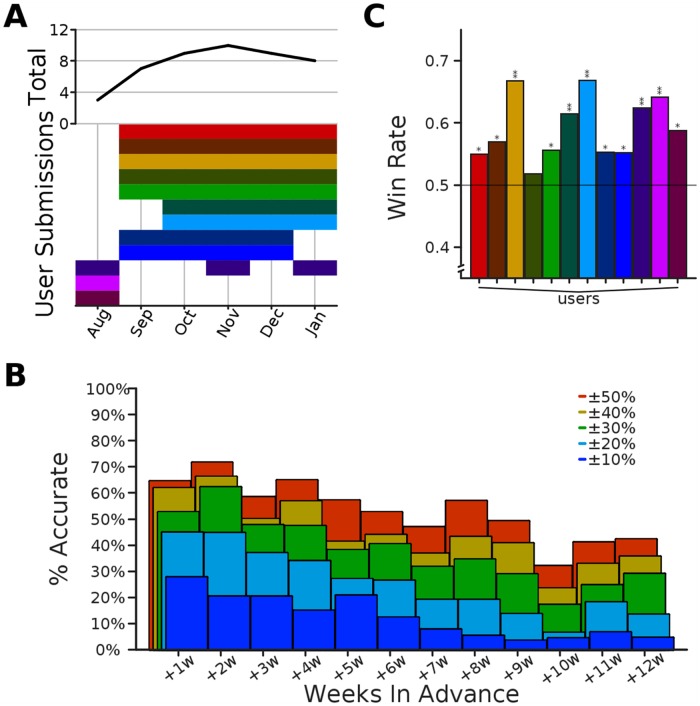
Infectious diseases impose considerable burden on society, despite significant advances in technology and medicine over the past century. Advanced warning can be helpful in mitigating and preparing for an impending or ongoing epidemic. Historically, such a capability has lagged for many reasons, including in particular the uncertainty in the current state of the system and in the understanding of the processes that drive epidemic trajectories. Presently we have access to data, models, and computational resources that enable the development of epidemiological forecasting systems. Indeed, several recent challenges hosted by the U.S. government have fostered an open and collaborative environment for the development of these technologies. The primary focus of these challenges has been to develop statistical and computational methods for epidemiological forecasting, but here we consider a serious alternative based on collective human judgment. We created the web-based "Epicast" forecasting system which collects and aggregates epidemic predictions made in real-time by human participants, and with these forecasts we ask two questions: how accurate is human judgment, and how do these forecasts compare to their more computational, data-driven alternatives? To address the former, we assess by a variety of metrics how accurately humans are able to predict influenza and chikungunya trajectories. As for the latter, we show that real-time, combined human predictions of the 2014-2015 and 2015-2016 U.S. flu seasons are often more accurate than the same predictions made by several statistical systems, especially for short-term targets. We conclude that there is valuable predictive power in collective human judgment, and we discuss the benefits and drawbacks of this approach.


Conflict of interest statement

The authors have declared that no competing interests exist.

Figures

Fig 1
Fig 1. Epicast user interface.
A screenshot of the Epicast user interface for predicting flu in the United States. On any given week, the wILI trajectory of the current season (solid black) is only partially observed. A user’s prediction is a continuation of this trajectory over weeks in the future (dashed black). wILI trajectories of past seasons show the typical course of influenza epidemics (colored lines).
Fig 2
Fig 2. Overview of Epicast participation.
Top: time series of the number of active participants per week. Bottom: timeline of weekly participation. (Assigned colors are for visualization purposes only and are consistent across figures.).
Fig 3
Fig 3. Relative prediction accuracy on short-term targets.
The percent of regions and submission weeks (n2014 = 352, n2015 = 330) where the Epicast point prediction was accurate within some range of the actual value is shown separately for each of the four short-term targets.
Fig 4
Fig 4. Number of regions accurate within a target range by lead time.
The number of regions where the Epicast point prediction was accurate within some range of the actual value is plotted as a function of lead time. Subplots show accuracy in (A; G) Peak Week, (B; H) Peak Height, and (C–F; I–L) wILI at 1, 2, 3, and 4 weeks ahead, respectively.
Fig 5
Fig 5. Epicast Win Rate against individuals and competing systems.
All plots show, for each predictor (users participating on at least half of the weeks and statistical systems Empirical Bayes (EB), Pinned Spline (SP), Stat (ST), and ArcheFilter (AF)), Win Rate: the fraction of instances where Epicast had lower absolute error than the competitor, across all regions and lead times (n2014 = 231, n2015 = 176 per target). A Win Rate above the reference line of 0.5 implies that Epicast had lower absolute error more frequently than the indicated predictor. Statistical significance is determined by Sign test; *: p < 10−2; **: p < 10−5. Subplots show Win Rate considering (A; D) all six targets, (B; E) the two season-wide targets, and (C; F) the four short-term targets.
Fig 6
Fig 6. Comparison of mean absolute error by lead time.
Mean absolute error across regions (n = 11) is plotted as a function of lead time for of Epicast, Empirical Bayes (E. Bayes), Pinned Spline (Spline), Stat, and ArcheFilter (A-Filter). MAE averaged over lead times is shown for each method on the right side of each subplot. Subplots show MAE in (A; G) Peak Week, (B; H) Peak Height, and (C–F; I–L) wILI at 1, 2, 3, and 4 weeks ahead, respectively.
Fig 7
Fig 7. Comparison of log score by lead time.
Log score, averaged across regions (n = 11), is plotted as a function of lead time for of Epicast, Empirical Bayes (E. Bayes), Stat, ArcheFilter (A-Filter), and Uniform. Log score averaged over lead times is shown for each method on the right side of each subplot. Subplots show log score by (A; G) Peak Week, (B; H) Peak Height, and (C–F; I–L) wILI at 1, 2, 3, and 4 weeks ahead, respectively.
Fig 8
Fig 8. Overview of chikungunya predictions.
(A) Similar to Fig 2, participation is shown per month (top) and per expert (bottom). (B) As in Fig 3, percent of predictions within some range of the target value as a function of the number of weeks in advance that the prediction was made (45 ≤ n ≤ 84). (C) As in Fig 5, the fraction of instances where Epicast had lower absolute error than each individual participant, across all countries and weeks (336 ≤ n ≤ 795; Sign test; *: p < 10−2; **: p < 10−5).

References

    1. Lopez AD, Mathers CD, Ezzati M, Jamison DT, Murray CJ. Global and regional burden of disease and risk factors, 2001: systematic analysis of population health data. The Lancet. 2006. May;367(9524):1747–1757. Available from: 10.1016/S0140-6736(06)68770-9. - DOI - PubMed
    1. Armstrong GL. Trends in Infectious Disease Mortality in the United States During the 20th Century. JAMA. 1999. January;281(1):61 Available from: 10.1001/jama.281.1.61. - DOI - PubMed
    1. Pinner RW. Trends in Infectious Diseases Mortality in the United States. JAMA. 1996. January;275(3):189 Available from: 10.1001/jama.1996.03530270029027. - DOI - PubMed
    1. Myers MF, Rogers D, Cox J, Flahault A, Hay S. Forecasting disease risk for increased epidemic preparedness in public health. Advances in Parasitology. 2000;47:309–330. - PMC - PubMed
    1. Biggerstaff M, Alper D, Dredze M, Fox S, Fung ICH, Hickmann KS, et al. Results from the centers for disease control and prevention’s predict the 2013–2014 Influenza Season Challenge. BMC Infectious Diseases. 2016;16(1):357 10.1186/s12879-016-1669-x - DOI - PMC - PubMed

Publication types