. 2017 Mar 10;12(3):e0173836.
doi: 10.1371/journal.pone.0173836. eCollection 2017.

Translocation of the neonicotinoid seed treatment clothianidin in maize

Affiliations

Translocation of the neonicotinoid seed treatment clothianidin in maize

Adam Alford et al. PLoS One. .

Erratum in

Abstract

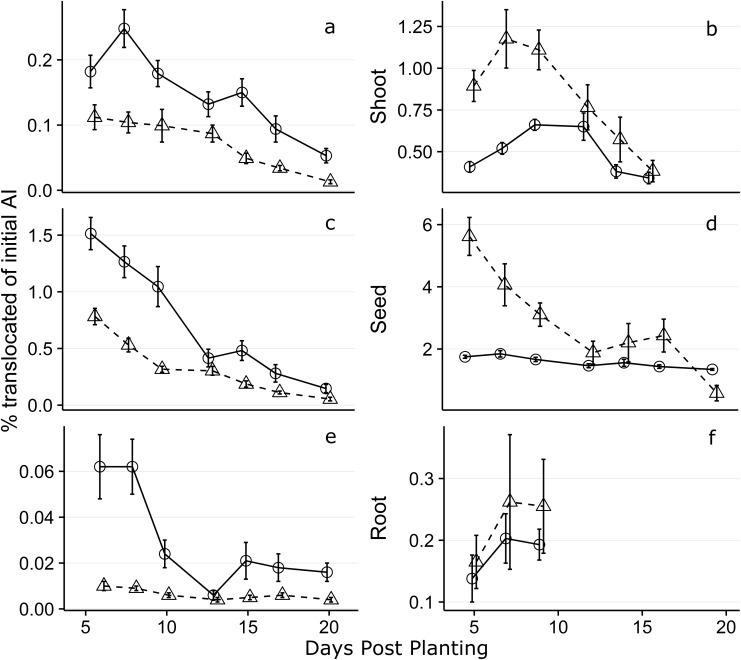
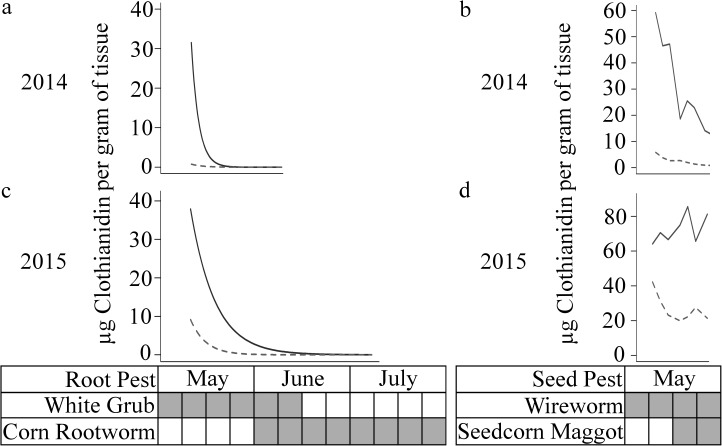
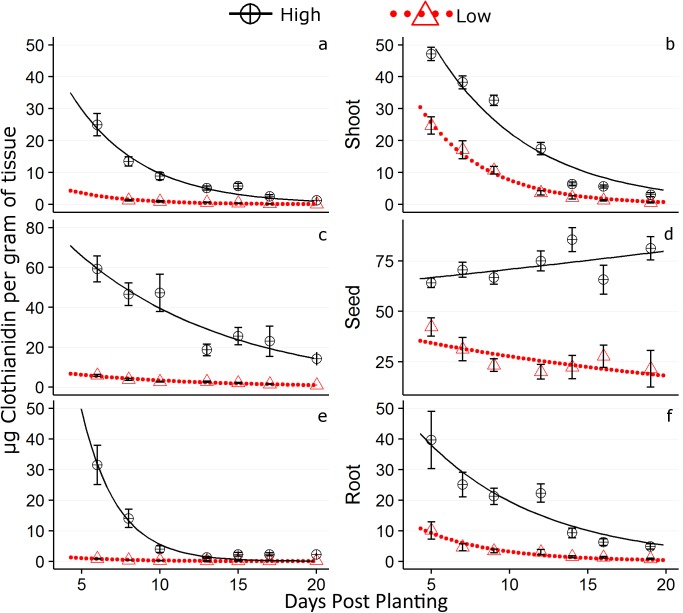
Neonicotinoid seed treatments, typically clothianidin or thiamethoxam, are routinely applied to >80% of maize (corn) seed grown in North America where they are marketed as a targeted pesticide delivery system. Despite this widespread use, the amount of compound translocated into plant tissue from the initial seed treatment to provide protection has not been reported. Our two year field study compared concentrations of clothianidin seed treatments in maize to that of maize without neonicotinoid seed treatments and found neonicotinoids present in root tissues up to 34 days post planting. Plant-bound clothianidin concentrations followed an exponential decay pattern with initially high values followed by a rapid decrease within the first ~20 days post planting. A maximum of 1.34% of the initial seed treatment was successfully recovered from plant tissues in both study years and a maximum of 0.26% was recovered from root tissue. Our findings show neonicotinoid seed treatments may provide protection from some early season secondary maize pests. However, the proportion of the neonicotinoid seed treatment clothianidin translocated into plant tissues throughout the growing season is low overall and this observation may provide a mechanism to explain reports of inconsistent efficacy of this pest management approach and increasing detections of environmental neonicotinoids.


Conflict of interest statement

Competing Interests: CK has received funding in the past from agrochemical companies that manufacture and distribute a wide range of pesticides, including many of those mentioned in this manuscript. These entities include the Bayer Corporation, BASF and Syngenta. None of these entities were involved with this work or are aware of it in any way, financial or otherwise. This does not alter the authors' adherence to all the PLoS ONE policies on sharing data and materials.

Figures

Fig 1
Fig 1
Diagram of a maize seedling at the soil surface interface, showing (a) Stem apex, (b) coleoptile, (c) nodal roots, (d) mesocotyl, (e) seed, (f) seminal roots, and (g) radicle roots. For homogenization purposes, the shoot region was classified as sections (a-d), the seed region as (e), and the root region as (f) and (g).
Fig 2
Fig 2. The minimum node-injury score required to cause economic damage calculated according to the Oleson et al. (2005) moderate environmental stress model.
2014 and 2015 are represented as an inverted triangle with dashed lines and crosses with dotted lines respectively. 2012 price data is included to show how recent (five year) high commodity values affect economic thresholds and is represented as a filled circle with solid lines.
Fig 3
Fig 3. Mean percentage of initial clothianidin application translocated to root, seed, and shoot tissues.
The Low and High treatment rates are represented by an open triangle with dashed lines and an open circle with a solid line respectively. Only plants with >80% of root and >80% of shoot tissue were used in calculation of the % of initial AI translocated. The 2014 data represented by graphs (a), (c), and (e), and 2015 data by graphs (b), (d), and (f). The first 20 days post planting (DPP) are shown.
Fig 4
Fig 4. Values of μg clothianidin per g of plant tissue fit to a first order decay equation with time as a predictor.
The root region is represented by graphs a and c whereas the seed region by graphs b and d. Actual concentrations for the seed region are displayed given the poor fit of predicted values. Dashed and solid lines represent the 0.25 and 1.25 mg /clothianidin application rates. The pest activity period is displayed underneath the graphs with activity indicated by a filled in box.
Fig 5
Fig 5. Values of μg clothianidin per g of plant tissue with standard error bars.
The 2014 data are represented by graphs (a), (c), and (e), and 2015 data by graphs (b), (d), and (f). The first 20 days post planting (DPP) are shown. Concentrations as predicted by the first order exponential decay equation are represented by a dotted red line and solid black line for the respective 0.25 and 1.25 mg /clothianidin application rates.

References

    1. Jeschke P, Nauen R, Schindler M, Elbert A. Overview of the status and global strategy for neonicotinoids. J Agric Food Chem. 2011;59: 2897–2908. 10.1021/jf101303g - DOI - PubMed
    1. Pollack P. Fine Chemicals: The Industry and the Business, 2nd ed. New Jersey: John Wiley & Sons; 2011.
    1. Elbert A, Haas M, Springer B, Thielert W, Nauen R. Applied aspects of neonicotinoid uses in crop protection. Pest Manag Sci 2008;64: 1099–1105. 10.1002/ps.1616 - DOI - PubMed
    1. United States Department of Agriculture, National Agricultural Statistics Service. 2012 Census of Agriculture United States Summary and State Data; Publication AC-12-A-51; 2014.
    1. Douglas MR, Tooker JF. Large-scale deployment of seed treatments has driven rapid increase in use of neonicotinoid insecticides and preemptive pest management in US field crops. Environ Sci Technol 2015;49: 5088–5097. 10.1021/es506141g - DOI - PubMed

LinkOut - more resources